Решение для удаленного мониторинга и управления для проактивного контроля устройств, сетей и приложений. Идеально подходит для поставщиков управляемых услуг (MSP) и ИТ-команд, стремящихся к автоматизации, масштабируемости и контролю в режиме реального времени.
Мощная и гибкая служба поддержки для команд поддержки и обслуживания клиентов, согласованная с процессами библиотеки инфраструктуры информационных технологий (ITIL).
Программное обеспечение для удаленного управления серверами и ОС Windows, Linux и Mac, ориентированное на системных техников и компании, предоставляющие управляемые услуги (MSP).
Augmentez la puissance de votre surveillance. Pandora FMS s’intègre aux principales plateformes et solutions cloud.
Collectez, centralisez et consolidez les données de journaux et d’événements provenant de différents systèmes, applications et appareils dans la plateforme unique qu’est Pandora FMS.
Solution de surveillance et de gestion à distance pour un contrôle proactif des appareils, des réseaux et des applications. Idéale pour les fournisseurs de services gérés (MSP) et les équipes informatiques à la recherche d’automatisation, d’évolutivité et de contrôle en temps réel.
Helpdesk puissant et flexible pour les équipes d’assistance et de service à la clientèle, aligné sur les processus de la bibliothèque d’infrastructure des technologies de l’information (ITIL).
An extensive collection from detailed guides that break down complex topics to insightful whitepapers that offer a deep dive into the technology behind our software.
Expande el poder de tu monitorización. Pandora FMS es flexible y se integra con las principales plataformas y soluciones en la nube.
Recopila, centraliza y consolida los datos de logs y eventos de diferentes sistemas, aplicaciones y dispositivos en una única plataforma. Los datos se integran de forma nativa con Pandora FMS, sin necesidad de herramientas adicionales.
Solución de supervisión y gestión remota para la supervisión proactiva de dispositivos, redes y aplicaciones. Ideal para proveedores de servicios gestionados (MSP) y equipos de TI que buscan automatización, escalabilidad y control en tiempo real.
Potente y Flexible Helpdesk para equipos de soporte y atención al cliente, alineado con los procesos de Biblioteca de Infraestructura de Tecnologías de Información (ITIL).
Expand the power of your monitoring. Pandora FMS is flexible and integrates with the main platforms and cloud solutions.
Collect, centralize, and consolidate log and event data from different systems, applications, and devices into a single platform. Data integrates natively with Pandora FMS agents, with no need for additional tools to capture key information.
Remote monitoring and management solution for proactive oversight of devices, networks, and applications. Ideal for managed service providers (MSP) and IT teams seeking automation, scalability, and real-time control.
SNMP protocol, whose first version was officially released on 1990 and means Simple Network Management Protocol, is the easiest and simplest way a sysadmin has in order to manage and diagnose problems inside his network devices.
Let’s see what is, how snmp works and why this simple protocol is the essential key for a smooth network environment.
In the most general terms, network monitoring means the use of available communication protocols to collect information on the status of communication systems, whether they be routers, land line communications or cell phones. Among them, SNMP raises as the most used monitoring tool.
As we previously said, SNMP works as a mechanism of communication between network devices and a network administrator. Routers, switches, servers, printers…, most of every and each network device supports SNMP protocol. Not only with informative purposes, but also to perform different actions inside those devices (such as remote configuration).
How does SNMP work?
Belonging to the application layer (7th layer of the OSI model), allows communication between network devices. Those known as SNMP agents (request receivers) work in a set of predefined UDP ports, known as SNMP port or SNMP ports. Request receiving port (sent by any available port) is UDP 161 and UDP 162 is used to receive notifications (also known as SNMP trap port).
SNMP protocol works in two different ways: SNMP polls and traps. Polling consists of launching remote queries, either actively or on demand, carrying out operation queries synchronously. Traps, meanwhile, are messages sent by SNMP devices asynchronously, according to changes or events, to configured addresses.
To get the most out of SNMP monitoring, it’s best to use both modes when setting up a monitoring system.
SNMP versions
SNMP currently has three different protocol versions, gathered in different RFCs over time (since first ones on 1988, until today).
Those versions are:
SNMPv1 – defined in RFC 1155, 1156 and 1157, defines the way SNMP works.
SNMPv2 – communication and security improvements of first version. It has two subversions, one on which security is community based (version SNMP2c, RFCs 1901 and 1908), and one on which security is user based (version SNMPv2u, RFCs 1909 and 1910).
SNMPv3 – this third version, which includes and improves security and encryption, has struggled to find a market. The SNMP v3 is defined in RFC 3411 and 3418 and, since 2004, SNMPv3 is known as the actual standard protocol version.
SNMP alerts
Therefore, after knowing how SNMP protocol works, it is clear that one of its main uses are the alerts generated by all devices. Two types can be found in a SNMP monitoring network: synchronous alerts, those requested by an agent SNMP request (known as SNMP polling alerts), and asynchronous alerts, without agent request (known as SNMP traps or snmtraps).
This alert and notification system is the true key of SNMP protocol used in network monitoring tools base their operation of custom alerts. For example, in Pandora FMS we handle a wide range of custom alerts that can be triggered based on these SNMP alerts.
Now lets discuss in more detail what are and how monitoring works based on SNMP polling and SNMP traps.
SNMP trap monitoring
First configure your devices to send traps when specific circumstances are met, and secondly set up a tool that can collect the SNMP traps it receives, whether it be a machine with the necessary services, or a piece of monitoring software. How you configure the SNMP devices will depend on the manufacturer’s model and the device itself, and is carried out from a management interface accesible via a browser and its IP address.
Traps can be received in Linux by using the demon snmptrapd, installed as follows, e.g. on CentOS systems:
In our example we’re going to use Pandora FMS to receive and process the SNMP traps. If you already have a Pandora FMS server installed you won’t need any new dependencies, but you’ll have to enable it to receive the traps. Search for snmpconsole in the pandora_server.conf file and enable it as follows:
snmpconsole 1
Once the SNMP traps console is enabled Pandora FMS will be able to receive and process them and display them in the corresponding section:
To ensure the incoming traps are arriving correctly, you can consult the corresponding log file, usually at: /var/log/snmptrapd.log.
SNMP trap alerts
Alerts can also be configured via SNMP monitoring for the traps we prepared. In this case they won’t function in the same way as any other module, unlike with SNMP polling, but instead are based on filtering rules. Using these rules we can identify traps belonging to other devices, filter the contents of said trap, OID, etc..
In the next screenshot you can see various alerts created with different filtering options, and actions checking that everything is working fine:
SNMP polling monitoring
The protocol works by launching a query against an IP address and requires a specific parameter: the SNMP community string, an alphanumeric chain used to authorize the operation, and which adds an extra layer of security. When an SNMP check is launched against a compatible device, you get a list containing a lot of data that can be difficult to interpret at first:
# snmpwalk –v 1 –c public 192.168.50.14
monitorizacion snmp
Each line returned by snmpwalk has an OID (object identifier) and corresponds to a piece of data determined by the device. To better understand what the values returned by the SNMP check are, you can install the system manufacturer’s MIBs (management information base). MIBs are libraries that translate these numeric chains into a legible format allowing us to interpret the data.
Let’s look at some data we’ve got back after executing an SNMP check with the MIBs installed:
There are also web sites where you can consult any of these OIDs in case of doubt. If you know the OIDs you want to monitor, you can carry out the query like this by indicating the alphanumeric code that appears after the IP address in question:
monitorizacion snmp
# snmpwalk –v 1 –c public 192.168.1.50 IF-MIB::ifPhysAddress.2
Done like this, only the values of the SNMP object queried will be shown, so if you have a monitoring tool the data will be included in the different checks. In this case, we created a basic SNMP monitoring for a few devices using Pandora FMS, and the result is as follows:
SNMP polling alerts
Once data collection on modules via SNMP polling is being carried out, we can create alerts on Pandora FMS for those modules, executing actions proactively in function of the thresholds we’ve configured, and they work in the same way as any other alerts for any modules on Pandora FMS.
SNMP modules in Pandora FMS
We built Pandora FMS as a flexible monitoring software, capable of monitoring devices, infrastructures, applications, services and business processes. Among them, we have a complete SNMP module.
If you want to know what Pandora FMS can offer, you can discover it here.
Or if you have to monitor more than 100 devices you can also enjoy a 30 days FREE DEMO of Pandora FMS Enterprise. Get it here.
The Pandora FMS team will be very happy to help you!
What is IPAM? Find out what it means for you and Pandora FMS
Today we will take a tour of the most technical Pandora FMS. For some people, it can be a challenge.
Although the IPAM extension already existed in Pandora FMS world, in release 731 this extension was improved to the point of being considered as a new extension. But what is IPAM? What is IPAM? and what is it for?…. In this article we will answer these important questions to be able to use it.
What is IPAM?
IPAM, or IP address administration, is a set of tools that allows us to quickly and automatically discover and manage the IP addresses of our networks.
What can I do with the new IPAM extension of Pandora FMS?
The Pandora FMS development team, also known as “The excellent Pandora FMS development team”, saw the need to improve this extension to be able to manage IP addresses in a simpler and more comfortable way, introducing additionally new features to be able to manage the network with more options.
In order to explain this wonderful and grateful extension better, we are going to do the tour that a Pandora FMS user would do. Here we go.
In order to be able to work with the different tools available to IPAM, we must first create a network recognition task so that, once the network has been generated within IPAM, it can be used in the different options. For this, within the configuration of network discovery we have several useful possibilities for monitoring. First, we can choose which type of network recognition we want to use: a basic recognition that collects little information from each device found, or on the contrary an advanced recognition that explores each device more thoroughly taking out as much information as possible. Once generated and finished the recognition we will have a first network created inside the IPAM and we will be able to begin to operate in other views.
We will be able to choose if we want to obtain statistical data and reports. As with the rest of Pandora FMS monitors, this type of monitoring can be managed through the use of alerts, as well as the generation of events in changes of state of nodes within the created network.
In the first place, we can observe the generated devices and the relevant information of each one of them within the view of the generated network. In this view, additionally, we will be able to edit each of the found hosts to be able, among other things, to reserve an empty ip for a future use.
Once we have managed the different networks that we want to monitor and manage from the IPAM extension, we enter the world of VLANs. For those who don’t know what it is, a VLAN is nothing more than a way to create different independent networks among them, belonging to the same physical network; that is, within the same network, to be able to create as many independent networks as we want.
To be able to create the different VLANs within our IPAM extension we have two options: manually or “automatically”. Let’s explain the first case. To create a VLAN manually, first create the empty VLAN with a characteristic name, and then introduce any network you have previously introduced into IPAM.
If you want to create them “automatically”, we will use the wizard that IPAM has for this task. Passing the appropriate parameters to this wizard SNMP queries will be made directly to the routers that we have in our network, which have been configured previously managing the VLANs, and they will return the necessary information to create the various VLANs already existing in our network, as well as the interfaces that belong to the VLAN.
To finish, and as a icing on the cake, we have the configuration and management of supernets within the IPAM extension of Pandora FMS. Unlike the creation of VLANs, in this case we can only create super networks manually using IPAM. In order to do this, we will have to configure each of the supernets we want to have with the necessary parameters, and then add networks already managed with IPAM that may belong to a VLAN. In addition, there is the possibility from the menu of a supernet generated to perform a subnetting process by which we can create the next available network, as we discussed in the first step within IPAM. Once the desired supergrids are managed, it would be possible to visualize these configurations inside a supergrids map, the same as the network maps already well known in Pandora FMS. In these maps you will be able to visually see the occupation status of a network managed by IPAM (red, orange or green), managing the thresholds in a personalized way.
From all these tabs available from IPAM, you can see statistics of each network, VLAN or super network, such as occupancy level or availability of ips, as well as the possibility of exporting everything to a csv.
To Find out Moreclick on this this link to our wiki.
Once in these deep technological mysteries, do you want to know better what Pandora FMS can do for you? Find out more here: https://pandorafms.com/
Also, remember that if your monitoring needs are more limited you have the OpenSource version of Pandora FMS at your disposal. Find more information here: https://pandorafms.org/
Don’t hesitate to send your queries. The Pandora FMS team will be delighted to help you!
Something that the Linux kernel inherited was the command line interface (shell): in Unix® it was called Bourne Shell (written by Mr. Stephen Bourne) and it is called Bash which stands for the Bourne-again shell, something like “terminal rebirth”, playing with the surname of the famous computer. Let’s see today the Command Terminal in Linux!
It turns out that every day and at every moment we practically use a Command Terminal. How is this possible?
Almost a Command Terminal
Strictly speaking, any software that allows us to enter commands is a Command Terminal, but all the data we enter emulates the original behaviour. The main difference is that, generally, we do not press the ENTER key nor do we have an inductor or prompt… And what the hell is all this?
Apple® Brand Adjustable Keyboard
To simplify, we have used the concept of Command Terminal to encompass several definitions. Don’t forget what we mean when we say Command Terminal ;-).
Command terminal in practice
Every time we use any program, unless it is a video game, we will need to enter information using our keyboard. Of course, this is less used every day because we can already dictate to our computers and write for us and thanks to the graphical interface of modern operating systems will often suffice with a pointing device (mouse or our fingers on a touch screen) or the use of both methods.
But if we want to finish our work quickly, there’s nothing better than typing. What we will name you is useful both for entering data and for a Command Terminal:
Our screens have a width limit, that would be our line of work.
Already in that line, indicated by a cursor, we can begin to write. Each word is separated from each other by one or more spaces. The quick way to go back or forward to each of them to correct or add something is with the CONTROL keys on your keyboard (in the lower left corner of most keyboards), plus the left or right arrow on your keyboard. This combination is denoted as CTRL+← or CTRL+→, respectively.
We also have a key dedicated to go to the beginning of the line, Home, and its counterpart, End.
Come on, let go of the mouse! Working this way, just with the keyboard, may seem intimidating, but it’s just a matter of practicing a little. It’s like riding a bicycle! Once we try it and learn, we won’t be able to live without them.
Opening a Command Terminal
To practice the previous section, depending on your Linux distribution, generally with the key combinations CTRL+ALT+T will be more than enough. But if you really want to move forward, with ALT+F2 you can invoke your favorite Command Terminal – almost always every Graphical User Interface includes yours as well as Bash-, including the powerful GNU Emacs, a text editor that allows macros that lighten our work in the Command Terminal (we write less and do more).
Editor of GNU Emacs texts and macros
A widely used command is ls which allows you to list files and directories; entering this command and pressing Enter will already be recorded in our history of issued commands (correct or not). With the date up or down we will be able to “navigate” and reuse the commands or complete lines. Another command widely used in monitoring is ping which serves to test the connectivity between two computers; as for my favourite text editor is nano; in the following figure we execute the three commands:
Command Terminal running three basic commands on Linux
With some arrows in pink we emphasize the command history in this case with the numerical parameter to see the last three orders and their identifying numbers: then look at these digits and placing as prefix the symbol of closing of admiration plus the wished number we will be able to execute again this previous line. No more forgetting for our daily routine!
We are most forgetful
The true power of the Linux Command Terminal is that one command can deliver its results to another; this is called STDIN, STDOUT and if STDERR error occurs. All three make up the Standard Entrance; again let’s go to practice: history 3 | grep ls
Here the history command gives the last three lines to the grep command which in turn filters and displays only the lines containing that string. This is useful to help retrieve our orders.
We have already seen that !+n allows us to execute the desired line; with !! we will repeat the last line… But do we do the same with an up arrow and an intro? Yes, but here comes the interesting thing with an example: if we forget to execute a command as superuser or root we simply introduce sudo !! more quickly. What do you like about this?
Also with CTRL+R you can search interactively: type a few letters and the last line containing those letters will be returned to you; pressing CTRL+R again you will see the previous coincident and so on (you can even delete with the key ⌫ Backspace or add more characters to the search). Once the desired line is located, press the Esc key and you can edit and reuse the command; with CTRL+G we cancel the search and restore the current line.
“Copy and paste” is a familiar action for anyone who has touched a computer; to do this you must first learn how to select a text. In the graphic interface we can select by pressing SHIFT+CTRL+FLECHA and pressing CTRL+X to cut and CTRL+C to copy. In the Command Terminal there are much more efficient commands:
CTRL+U: to cut from the cursor to the beginning of the line.
CTRL+K: to cut from the cursor to the end of the line.
CTRL+W: to cut a word to the left.
CTRL+Y: to paste what is in memory.
CTRL+_: to redo the last action.
CTRL+C: cancels the editing or the command in execution.
Pandora FMS
Let’s explain how Pandora FMS uses the Command Line Interface: with a file made in Perl language we can create scripts that execute our most common commands, such as creation and modification of agents, modules, alerts, etc. We will quickly understand the general syntax with what we have explained about the Standard Entry: perl pandora_manage.pl
And now that you know better the Command Terminal and its history, how about taking a few minutes to test it in Pandora FMS? Or, if you want to get straight to the point, you can also discover what it is and what Pandora FMS can offer you, going here: http://pandorafms.org/features/features/
Or you can also send any query you have about Pandora FMS for more than a hundred devices. You can do that in a very simple way, thanks to the contact form that can be found at the following address: https://pandorafms.com/contact/
VXLAN Network: a network between virtual machines, wherever they are
The development of VXLAN technology or extensible virtual networks is usually associated with the implementation of service provider company platforms.
However, the fundamental idea around VXLAN is applicable to any platform and arises to solve a network design problem with which the reader may feel identified.
Many of us have found ourselves in the situation where, having a distributed platform and dealing with a performance problem, we wanted to be able to somehow simplify the design, so that there would be a virtual network between teams located in different data centres.
In order to solve this situation we have the emergence of VXLAN, which proposes the creation of a level ¨virtual¨ of communication layer 2 or extended network. At the end of the day, the idea was to apply the virtualization paradigm to the networking and communications platform.
Today VXLANs, together with other network virtualization tools such as EVPN (Ethernet Virtual Private Network), has impacted on the development of network architecture suitable for service providers.
The resulting platform allows these companies, among others, to serve a large number of customers, offer each of them a good level of logical isolation and establish simple escalation procedures.
On the other hand, VXLAN network has been closely related to networks defined by SDN software. This is no surprise, since both concepts share the fundamental point of being the result of applying the paradigm of virtualization to the world of networks.
In fact, there are authors who consider that VXLAN is a fundamental piece for the effective development of networks defined by software, proposing architectures that include both ideas.
This combination is achieved by taking from SDN the idea of separating the logical part of the networks from the physical part and implementing this physical part considering the precepts of VXLAN.
For readers interested in this SDN – VXLAN relationship we recommend two readings; firstly our post on SDN to resume the basics, and secondly the article published in late 2017 by IEEE which proposes an architecture of SDN based on VXLAN.
The VXLAN solution
VXLAN proposes to generate a virtual network, also called overlay, from a LAN/WAN network infrastructure that will function as a base.
For the overlay network, VXLAN describes the encapsulation protocol and the tunnelling processes required for its operation.
As for the base network, called underlying or underlay, VXLAN presupposes the existence of a network where all active components are layer 3, ie are routers that implement some dynamic protocol such as OSPF, EIGRP or IS-IS.
Both overlay and underlay networks are shown in the following diagram:
This diagram shows VXLAN’s fundamental idea of having two networks, one overlay and one underlay.
About the underlay network
Let’s talk a little more about the base network or underlay.
This network, as we have already mentioned, consists of layer 3 devices, i.e. routers that make optimal use of the available roads or routes.
The choice of the optimal route will be made on the basis of an equal cost multi-path protocol (ECMP).
It is interesting to note that underlay networks rule out the use of STP (Spanning Tree Protocol). Let’s remember that STP’s main objective is to avoid the creation of loops in the transmission of packets.
In a scenario of two possible routes of equal cost, the application of Spanning Tree would result in the annulment of one of the routes with all the cost that this decision supposes. It is precisely this cost that underlay networks are trying to avoid.
Of course, there is technology specially designed to implement underlay networks, such as EVPN (Ethernet VPN), for example, which initially emerged as the solution for any encapsulation scheme and which currently use VXLAN and MPLS.
The segmentation capability brought about by the traditional VLAN concept under the 802.1Q standard has a limitation on the number of VLANs that can be created.
This number is restricted by the size of the VLAN identifier, which is 12-bit, so the VLAN limit is just over 4000 VLANs.
So if you manage the infrastructure of a service provider and decide to deliver 4 VLANs per customer you will have a not very encouraging limit of 1000 potential customers.
To overcome this limit, VXLAN uses a 24-bit word, known as VNI (VXLAN Network Identifier), as a segment identifier, providing just over 16 million possible VXLANs.
On the other hand, VXLAN Network, as we have already said, proposes the creation of a virtual network layer 2, which gives a new level of abstraction.
At this level, the independence between created virtual networks or VNs is maintained. That is, there will be no communication between the elements of different NVs unless a security rule explicitly allows it and a router implements it.
In addition, the possibility of defining a VN between devices located in different data centres is considered.
So we could have two virtual machines located in two different data centres that are integrated into the same virtual VXLAN Network.
In the following diagram look at the two highlighted virtual machines that belong to the same virtual network.
This diagram shows how two virtual machines from different data centers can be integrated into the same virtual network.
Let’s talk about the components: VXLAN uses elements called VTEP (VXLAN Tunnelling End Point) for its task.
VTEPs provide the connection between the overlay network and the underlay network and effect the traffic encapsulation process.
For this, each VTEP will have an IP address corresponding to the underlay network and one or more VNI addresses corresponding to the extended virtual networks it can handle.
As for the encapsulation, when the packet to be transmitted reaches the VTEP it is encapsulated in the so-called jumbo frames, which contain the original packet from the virtual machine plus the following headers:
VXLAN header, which contains the identifier of the associated VXLAN
UDP header, with information on UDP ports of destination and origin. Destination: 4789. Origin calculated within range 49152 and 65535.
IP header, with the address of the destination VTEP or a Multicast address.
Ethernet header, which will contain the MAC address of the next physical device on the underlay network. This header will be the only one that will change as the jumbo frame passes through the different routers on the underlay network.
The following image shows the type encapsulation performed by a VTEP:
shows the conformation of a jumbo frame with all the headers added during the encapsulation process
To complete the transport of VXLAN packets associated with a specific VN, VTEPs must create a virtual tunnel, which will remain active long enough to transfer these VXLAN packets.
To identify the VTEP destination with which it is required to establish the tunnel follow the same operations of any Ethernet network, ie the entire sequence associated with the ARP protocol, including the sending of Broadcast packets.
The difference is that at the moment of receiving the Broadcast ARP packet the source VTEP will encapsulate this packet in a multicast packet associated to the corresponding VNI, so that the destination VTEP responds and the tunnel can be established.
As far as the implementation of VTEPs is concerned, there are two possibilities:
Physical devices: You can use devices such as switches or routers that have the VTEP interface.
Software elements: Hypervisors can be used to create and maintain virtual machines that run the VTEP software at the same time.
In many implementations you will find a mixture of both possibilities, offering a lot of flexibility considering that not all switches and routers on the market support VTEP functionality.
The reader who wishes to delve into the technical details associated with VXLAN insurance will find the RFC 7348 very interesting.
Challenges associated with VXLAN
The implementation of VXLAN brings with it a new set of elements that can affect the performance of applications; therefore, the adequacy of monitoring processes is vital.
However, the challenges in VXLAN monitoring start with the loss of visibility that involves having two overlapping networks and an encapsulation process prior to the use of the entire communications structure.
Considering this, we can foresee that it will be difficult to isolate the traffic being monitored, as well as to correlate correctly the traffic generated in the overlay network with the corresponding traffic in the underlay network.
On the other hand there is the work with the jumbo frames, the fragmentation processes and the processes of encryption and decryption. We have to consider all the negative effect that these elements could have on the performance of the platform.
Another interesting point to evaluate in detail is the cost in time and resources involved in the creation of tunnels, since as provided by the definition of VXLAN this is a dynamic and recurrent process.
So in a VXLAN platform it would be interesting to monitor the multicast packets generated by the VTEPs, ARP tables and the time of setting up the tunnels.
We believe it would be opportune to resume the effect that Broadcast and multicast packages could have on the performance of the platforms, for which we recommend that you review the following post.
Finally, monitoring the VXLAN platform would not make sense in isolation; it is essential to consider the platform as a whole and adapt the monitoring processes to this structure.
As the natural target of VXLAN platforms is the service provider company, which usually have complex platforms where automation, scalability and flexibility are fundamental objectives, it is crucial to have adequate monitoring tools.
For these cases Pandora FMS has developed a solution designed just for the service providers, and of course we invite you to investigate more about all their capabilities and advantages.
To do so, we recommend that you visit this link, request all the information you require and tell us about your project.
Websocket is an API that allows us to carry out bidirectional and open communication between two devices; in this precise case, between a client and a server.
Let’s give an example: Pepín is a very nice middle-aged man who organizes meetings of “Friends of 600”. Well, let’s imagine that Pepín accesses a website. When Pepín accesses a website, what really happens is that two computers are talking, they have a chat. One of the computers is Pepín’s and the other is the server.
Computer-to-Computer Dialog
“The client computer”, Pepín’s computer, makes a communication request on a “server computer”. In this case the communication request begins with a greeting. Pepin’s computer says something like “Hello” to the server computer. The server computer responds, “Hello, you too.” For the record, it’s a figurative conversation, don’t get involved, nobody here says “Hello” literally. Pepín’s pc continues: “Can I send you a file?” For example, if Pepin wanted to send a file. The server will say, “What kind of file?” “A jpg file” will tell you Pepin’s computer. “How much does this jpg file weigh?”, and so on… then Pepín’s computer will answer him, etc…
The server computer will always answer you depending on what has been predetermined in it before for an exchange of this type of files.
This is what usually happens when we work with or interact with a static page, those of all life, a simple page. The conversation is closed and simplified. The bad thing is that every time Pepin comes to your page to get new information he will have to start again with this conversation. Why? Because there is no open communication between the two or at least it is not kept open.
If I’ve seen you I don’t remember
Both the client and the server forget that this conversation has ever occurred at the time the connection is closed. Therefore, every time you go back in you have to start with the “hello” to the server, show them your intentions, what you want, how you want it, and then say goodbye. And I’m sorry, no matter how much you esteem your servant, when it’s all over he won’t remember you, nor when you come back to him for new material. “Oblivion is the only revenge and the only forgiveness.” -J.L. Borges-
Don’t take it too personally, Pepin, it’s all programmed that way. Yours is a single-petition, momentary and perishable connection, and the protocol is designed to serve a vast number of people. You can’t just maintain deep connections for free.
What is websocket, then?
Well, with websocket, this communication we’ve been talking about is kept open. A websocket is created and at the moment it is opened an open biderectional communication can be made. This means that the server can talk to the client and the client can talk to the server. The ultimate goal of websockets is to send information (or communication between client and server) in real time. A socket is a two-way communication protocol and a websocket is the same, only it works within another directional protocol called HTTP.
As I say, the purpose of websocket is to create bidirectional and lasting connections between a client and a server. We create the connection, client and server, we consider how to communicate using the same scheme as HTTP, only keeping the port open and deciding to send messages in real time.
In this way, the server will be able to send Pepín, or any of his esteemed clients, any message at any time and they will receive it immediately. The same thing would happen to the opposite. We will be able to create a message from our computer and we will be able to send it without having to start from scratch with a new connection or with the happy conversation. It’ll be open and it’ll recognize us.
And now you are more or less ready to answer the fearsome question. I don’t mean “do you still love me?”, but “what is Websocket?” But…
Do you already know Pandora RC?
Pandora RC is a remote computer management system (remote desktop software) that can help you with many tasks.
Do you want to know what Pandora RC can do for you? You can see much more by going here.
Or you can send us any question you may have about Pandora RC. You can do so using the contact form.
Hace apenas unas pocas décadas, casi ninguna empresa disponía de servidores. Ni siquiera utilizaban los de terceros. De hecho, en el mundo empresarial apenas se conocían las funciones de los servidores, ni se concebía qué podían aportar a un negocio.
Con la popularización de las redes e Internet, sin embargo, las cosas han cambiado. Los servidores han pasado a formar parte de la vida de muchas empresas, encargándose en la actualidad de algunas tareas clave para que estas puedan funcionar cada día.
Servidor caído: causas y perjuicios que puede ocasionar a una empresa
Como puedes imaginar, en este mundo en el que vivimos siempre estamos expuestos a imprevistos; nada está a salvo de posibles fallos o pérdidas de rendimiento, y esto también incluye a los servidores. Para algunas empresas, un servidor caído puede ser una pequeña o incluso una gran catástrofe.
Pero, ¿cuáles pueden ser las causas por las que esto suceda? ¿Qué es lo que puede afectar de tal manera a los servidores de una empresa? Y una vez esto suceda, ¿cuáles pueden ser las consecuencias? Intentemos dar respuesta a estas preguntas…
Servidor caído: algunas causas posibles
La razones por las que un servidor puede ver afectado su rendimiento o directamente dejar de funcionar son tan variadas que sería casi imposible reunirlas en un solo artículo, por lo que lo que vamos a hacer es referirnos a algunas de las más habituales.
Causas físicas: accidentes como la caída de un rack, o siniestros como un incendio o una inundación pueden causar graves problemas en los servidores.
Fallos en el suministro eléctrico: por supuesto, los servidores necesitan suministro eléctrico para seguir funcionando, por lo que su falta provocará su apagado.
Problemas de hardware: averías causadas por diversos factores, como el sobrecalentamiento, pueden ocasionar la caída de un servidor.
Problemas de software: también pueden ser de diversa índole. Por ejemplo, pueden deberse a problemas con la base de datos.
Actuaciones externas: la presencia de malware o ataques externos también pueden provocar la caída de un servidor.
¿Cómo puede perjudicar a una empresa la caída de un servidor?
Cuando hablamos de problemas en el ámbito empresarial, lo primero que solemos preguntarnos es cuál será el impacto económico de un evento. Aunque resulta difícil establecer cifras concretas -pues los cálculos dependen de múltiples factores, como la actividad de la empresa o la cantidad de servicios que se vean afectados por la caída- sí podemos ver, a modo de ejemplo, algunos de los aspectos en los cuales la caída de un servidor puede hacer daño a la empresa.
1. Pérdida de ventas
Imagina que se cae el servidor que está soportando la página web a través de la cual tu empresa realiza una buena parte de sus ventas (¡tal vez todas!).
La pérdida de servicio, aunque solo sea durante unas pocas horas, puede hacer mucho daño en términos económicos. Todas las personas que intenten llevar a cabo sus compras durante ese tiempo y no puedan hacerlo probablemente optarán por utilizar páginas (las de la competencia) que sí se encuentren en funcionamiento. Y no solo eso. Es posible que algunas de esas personas, defraudadas por no haber podido utilizar tu página, no vuelvan a hacerlo en el futuro.
2. Pérdida de productividad
Ahora imagina que el servidor está soportando algunos servicios importantes en tu empresa, como determinados programas con los que trabaja tu personal. La caída del servidor hará que tu gente no pueda utilizarlos durante un tiempo, tal vez impidiendo su trabajo, lo que afectará a su productividad.
Además, este tipo de problemas, volviendo al punto anterior, también pueden afectar a tus clientes. Imagina que el servidor que se ha caído daba servicio al software que soporta la facturación. Este deja de funcionar y, por lo tanto, durante un buen rato tus clientes también se ven afectados a la hora de realizar sus compras. Mal asunto…
3. Problemas de imagen
El anterior es un ejemplo que, a su vez, también nos sirve para introducir otro tipo de problemas, como los derivados por la mala imagen que puede transmitirse a los clientes. Y es que la caída de una página web o de un sistema de facturación no solo afectará al momento puntual en el que ocurran, sino que transmitirán una imagen negativa de la empresa, con todas las consecuencias negativas que eso puede acarrear.
Monitorización de servidores
Como hemos visto, las causas por las que podemos encontrarnos con un servidor caído son variadas y los problemas que las caídas pueden ocasionar a una empresa no son desdeñables. Y ahora te preguntarás, ¿qué puedo hacer para evitarlas?
Bueno, la respuesta a esa pregunta daría para escribir un nuevo post (¡o varios libros!), pero una de las cosas que pueden ayudarte es contar con un buen software de monitorización. Y, dado que te encuentras en el blog de Pandora FMS, lo normal es que te demos referencia de nuestro querido software, ¿no crees?
Entre las muchas cosas que Pandora FMS puede monitorizar, por supuesto también se encuentra la monitorización de servidores. ¿Quieres saber más? Echa un vistazo aquí: https://pandorafms.com/es/monitorizacion-de-servidores/
Además, también puedes enviar cualquier consulta que tengas acerca de Pandora FMS. Hazlo de una manera muy sencilla, gracias al formulario de contacto que se encuentra en la siguiente dirección: https://pandorafms.com/es/empresa/contacto/
Por último, ten en cuenta que Pandora FMS es un software de monitorización flexible, capaz de monitorizar dispositivos, infraestructuras, aplicaciones, servicios y procesos de negocio, por lo que puede ayudarte en muchas otras tareas de monitorización.
No dudes en enviar tus consultas. ¡El equipo que se encuentra detrás de Pandora FMS estará encantado de atenderte!
In this blog we have already told you about the application programmer, but… what about the code we write? Do we have any tools that shed any light on this? Well, that’s what we’re going to talk about today, a code line counter. Let’s see.
In the field of chemistry there is qualitative analysis, as well as quantitative analysis: the first tells us how many elements or compounds a sample has and the second how much of each of them it has. In the field of automated computing, Pandora FMS work field, the programming languages are like compounds, so we would need to know how many of them make up a project.
Programming languages
A look at the past
Steve Ballmer (Microsoft®) in the 1990’s talked about the IBM® company and encouraged his employees to boast about projects with large amounts of lines of code, in some cases monstrous amounts (used the unit of measure K-LOC, thousands of lines of code, in English). We must understand that IBM® operating systems are designed to run at one hundred per cent use of each processor – yes, 100%, all the time, every day, every second – so they were prepared, at least as far as hardware is concerned, to have that working model for software development.
Besides, we are talking about very few programming languages, mainly Cobol, so the study to be carried out was not major.
Independent or installed?
Any modern operating system provides an application with all the capabilities (explore directories and files, for example), so a project only needs a few hundred lines for these tasks; there is already a saving of time and effort out there. But this wasn’t always so. In the 1990s we had to deal with direct calls and communications to the hardware, and the operating systems recognized their limitations and therefore allowed it.
For those who visit our blog for the first time, the tool embedded in Pandora FMS to connect remotely to computers is eHorus. This technology allows to install a software agent and thus have direct communication in monitoring tasks, but we can also use it without Pandora FMS. Up to 5 devices are free.
In the remote machine we can install it permanently or in your other option independently (standalone). Of course, in the second type of download there will be more files and data because everything must be in a single folder, after using it we delete the directory. On the other hand, in the permanent installation it will take into account the version of the operating system destination for the libraries necessary to interact with it. Because of this, the Lines of Code Counter we use must be able -or be able to be configured- to detect if our project uses any collection of utilities (libraries) in order not to add or analyse it as part of the project.
For example, if it is written in C or C++ language the header files must be considered separate, as well as in the particular case of Microsoft Visual C++ the “.cs” files, which are pre-compiled before running the source code and should also not be considered in the count (note: the Smalltalk language also has the same file extension and the situation changes in that case).
Code Line Counter
We have already defined the task to be carried out. We will now move on to the choice of tool. To begin with, most likely the programming language or languages have their own options for such tasks, but always in a very basic way. We could also use Ohcount, which is written under free software license and in C language. Other options are:
SLOCCount.
Unified Code Count.
loc.
scc.
gocloc.
Sonar.
vsclc.
tokei.
But on this occasion we noticed cloc, an “old” software released in 2006 and updated in October 2018, also with GNU v2 license and written in Perl… Yes, we know, it is a rough language for beginners, but once you use it we will notice its great power and, frankly, it is better than the C language.
Another interesting detail is that cloc is also available for the Windows® platform and even has an extension for Visual Studio Team Services® (VSTS, what is now known as Azure DevOps®). It is capable of analysing a simple file, directory or subdirectory, or if necessary a compressed file or installer in .deb format from a minimalist web browser and thus give us a summary like the following:
Code line counter applied to the Min web browser installer
We also apply it to the eHorus agent installer and PandoraFMS repository in GitHub:
Code line counter applied to eHorus agent installer
Code Line Counter applied to Pandora FMS 7.0 NG 731
What we are seeing is the download in zip compressed format of Pandora FMS 7.0 NG 731, hosted in GitHub. We observe that it leads PHP followed by JavaScript and Perl (the .PO files are translations of the instructions, because they are high level language they occupy high values). The Code Line Counter is also able to summarize an attack, such as version 5.0, when the order was first JavaScript, PHP and then Perl:
Code Lines Counter to extract the “commit” of Pandora FMS 5.0 version
Now, cloc has a lot more to offer:
You can compare two compressed files from different states or versions of a project and consistently show by programming language how many lines of code, blank lines and comments were added and/or removed (option –diff-aligment=filename.txt).
These resulting text files, in turn, can be merged and totalized again by cloc. You can export, as we saw, the results to a text file, in a separate format by commas, JSON, YAML, etc, but the most important thing in SQL: this gives the opportunity to have instructions to inject values into any database and be able to monitor broadly through an agent and graphics.
With the –strip-comments option and a string of characters that we supply copies all the files removing the comments and then it analyses the resulting code, which must be equal to the one applied without the option; possibly we will be able to reuse the copied files without comments with the extension that we provide.
If a language is not supported we can make our own definitions of it with the option –write-lang-def=misDefinitions.txt
Flexibility
Pandora FMS allows us to extend even to the area of source code analysis and it can help you in countless computer tasks, no matter how dissimilar they may seem. Get in touch!
What is the silicon lottery? And high-end processors?
What does computer science have to do with lottery and high-end processors? Actually, not too much. But there is an important factor in the manufacturing process of the processors that has quite a lot to do with both.
Maybe you’ve heard of the silicon lottery and high-end processors. The latter are sought by some people almost as if they were the Holy Grail.
These types of processors are really prized for their ability to deliver great performance. In this article we are going to know both concepts, so that you see that computers, lottery and high-end processors do have much more in common than it seems…
What is the silicon lottery?
To understand what the silicon lottery is we should first know a little about the manufacturing process of the processors.
As you know, silicon is the material on which the processors that use our computers are made (at least until it is replaced by new materials, which could happen in a few years). To do this, it is introduced into ovens, where it reaches high temperatures and melts. It is then purified, its impurities are removed, and the material is poured into moulds in which it is cooled, forming monocrystals.
Subsequently, the monocrystals are cut into wafers, which are chemically treated and polished, and then passed to the lithography machines, which will print the circuits on their surface.
What happens is that, no matter how much effort is made in the effort to sanitize the material so that the purity of silicon is maximum, there are parts of wafers in which its cleanliness is very high, while others may contain small imperfections. In addition, there may also be some minor faults in the manufacturing process. What does this mean?
What happens is that the purest parts offer an advantage when it comes to manufacturing the processor. These wafers, which are usually closer to the centre of the wafers, need a lower core voltage (what we know as Vcore), which means that the processor will need less power to work, which in turn will probably mean that it warms up less. In fact, some less pure parts of the wafers – usually located on the edges – are often discarded for the manufacture of processors, as they are not considered suitable.
Indeed, when we acquire a computer we do not usually have knowledge of what is the purity of the silicon. We may have purchased one whose cleaning is standard, but we may also have purchased a “winning” number and received the “good one” of the silicon lottery in the form of high-end processors.
High-end processors
We know as high-end processors those processors that have been awarded in the lottery of silicon with a material of the highest purity and therefore can offer a superior performance.
However, you shouldn’t worry too much if you haven’t been graced with this type of processor. Major manufacturers usually guarantee the quality of all their products, so you shouldn’t have any problems if you’ve purchased a more “normal” processor. The thing is, if you’ve been lucky enough to buy high-end processors its performance is likely to be somewhat superior.
In addition, another thing to keep in mind is that the “silicon lottery” is not “played” only in the manufacture of processors, but also works with other components of the computer, such as the cores of graphics cards. So, if you haven’t had any luck with the processor, you might have it with another component!
In search of high-end processors
A curious phenomenon that occurs in some computer users is their fondness for trying to obtain high-end processors, or at least to know if their computer would be one of them.
What happens is that it is difficult to establish what we can consider as high-end processors, especially considering that the performance of processors constantly changes due to the evolution of manufacturing processes. Thus, it is likely that what is today considered a “high-end” (always from a subjective point of view) will no longer be “high-end” in a few years’ time.
However, some users take measurements to find out the ratio between the performance achieved by their processors and the voltage they need to reach it, driven by the illusion of having high-end processors.
But wait… what if you find out what Pandora FMS is?
Pandora FMS is a flexible monitoring software, capable of monitoring devices, infrastructures, applications, services and business processes.
Do you want to know much better all that Pandora FMS can offer you? Click here: https://pandorafms.com/
Or you can also send us any query you may have about Pandora FMS. You can do this in a very simple way, thanks to the contact form that can be found at the following address: https://pandorafms.com/contact/ The team behind Pandora FMS will be delighted to assist you!
Citrix NetScaler Monitoring Integrated with Pandora FMS
In this article, we offer you the possibility to make an approach to the issue of Citrix NetScaler monitoring, based on the scope of this product line and the visibility challenges involved, to finally propose the solution provided by Pandora FMS in this regard.
Citrix proposal
To have a little bit of context, we can try to understand the position that Citrix gives to NetScaler.
Citrix divides its entire offer in three major areas:
On the one hand, we have the Digital Workspace area, where you can find products that allow you to create and maintain virtualized schemes both for servers and workstations, in addition to tools for sharing content.
Within this part of the classification, we find the virtualization tool known as Citrix XenServer or Citrix Hypervisor, which has already been object of analysis on the part of our colleague Rodrigo Giraldo, who wrote an article that we recommend you to read on XenServer monitoring using Pandora FMS.
We also find an area called Citrix Analytics, which proposes the implementation of artificial intelligence and machine learning procedures, especially for security issues.
Finally, we have the area that concerns us, called Networking, which is controlled by NetScaler products.
The Citrix Networking line includes the following:
Application delivery control and management products (Citrix ADC and Citrix Application Delivery management).
Products related to security and access control (Citrix Gateway, Citrix WEB Gateway, Citrix WEB App Firewall).
A product related to the implementation of machine learning in traffic optimization (Citrix Intelligent Traffic management).
Undoubtedly, the spearhead is made up by the Citrix ADC product, which is also known as NetScaler ADC (Application Delivery Controller).
It is a tool that aims to improve the quality and speed of user access processes to applications.
What does NetScaler ADC intend to solve?
NetScaler ADC starting point is the fact that today part of the platforms present the following situations:
Platforms offer multiple applications to their end users.
Users have access from the internal network or the Internet through real or virtual platforms, that in addition include non traditional devices like smartphones, tablets, etc.
The architecture associated with applications is increasingly more complex, considering the presence, among others, of factors such as server virtualization schemes, cloud services, technology such as containers and microservices, etc.
Therefore, NetScaler ADC tries to influence this reality by controlling, managing and optimizing application delivery through a system that includes hardware and software and that at first acts as a proxy server for applications.
That is why, when accessing applications users point to this NetScaler ADC device, which is the entity that manages access to these applications.
It is easy to make the mistake of thinking that NetScaler ADC, as well as other ADCs, are nothing more than load balancers, when actually load balancing, understood as application traffic distribution among several servers, is just one of the activities carried out by ADCs.
In fact, these activities are extended to cover things like traffic optimization, load balancing based on characteristics associated with levels 4 (IP addresses, TCP ports) and level 7 (HTTP header, SSL session identification) of the OSI model, SSL encryption and decryption, security and access control.
Citrix NetScaler architecture
Let’s start with the Citrix NetScaler basic architecture to specify the actions that this controller can execute.
Consider a simple platform where we have a group of servers implemented based on a group of physical computers, based on which the group of virtual servers containing all the elements of the applications is defined.
Which virtualization platform? Well, actually, NetScaler is a platform capable of working with different virtualization schemes such as VMware, Hyper V, KVM, but in general, we find it associated with Citrix XenServer when customers choose full Citrix platforms.
On the other hand, we have these application users that can be both local users, directly connected to a network defined with multiple VLANs, for example, or remote users accessing applications from Internet connections, which can be accessed from their laptops or from devices such as smartphones or tablets.
Consider the following figure:
Basic solution architecture based on Citrix NetScaler
As we see, Citrix NetScaler will offer a single connection point for all users, both local and remote, and will be placed before the server platform, usually in the data center.
It uses an address known as NSIP (NetScaler IP), which identifies each NetScaler in the platform. In fact, in our example we have an NSIP, but in more complex platforms with several present NetScalers, either in Clusters or high availability scheme, each of the NetScalers will have a unique address.
Then, the access to the applications is achieved by the users by establishing this NSIP address as the destination address where all the access requirements will arrive.
Now, access to the servers itself is achieved through IP addresses called VIPs, which are usually associated with virtual servers.
Here, it is interesting to consider that VIP addresses can be disabled, which in turn inhibits the linked virtual server and, also, in more complex architectures with several NetScalers, the VIP address of a specific virtual server can be referenced in all the NetScalers that belong to the same Broadcast domain.
Once the servers are located in different VLANs, NetScaler can use another IP address called MIP (Mapped IP) that allows the possibility to create the path to the servers in a specific VLAN. In our example, we have two MIPs, one for the servers in VLAN 1 and one for the servers in VLAN 2.
Therefore, end users will make requests to the virtual addresses of the servers (VIP); this traffic will be oriented to the NetScaler using the NSIP address.
And when the requirement arrives, NetScaler will execute its balancing functions and select a server that will attend the request, to complete the sending of the client’s request using the MIP addresses.
For those readers who are interested in the architecture of this solution in hybrid schemes (owner – cloud), we recommend reading this document.
Challenges in Citrix NetScaler monitoring
If you are gauging or already have a Citrix NetScaler solution, you should be on the lookout for the monitoring needs generated with this scheme.
Usually, Citrix NetScaler is just one piece of a large project, where you can include server virtualization, container creation, microservices, workstation virtualization, cloud services, etc.
Also, remember that Citrix NetScaler is a product line, so the data center platform and WAN network design can be based or made by products of this line.
Therefore, in principle, Citrix NetScaler monitoring requirements should be aligned with the global monitoring scheme proposed for the entire platform, applications and user experience.
With this integration always in mind, you can focus on the specific monitoring requirements that Citrix NetScaler platform brings already includes.
In principle, as we saw in the architecture, it is about including additional hardware equipment to our data center platform.
Since these devices are operating and and traffic management points, their general state becomes crucial for the entire platform. Therefore, we must consider the monitoring of the performance and general health of these devices.
Then, in addition to monitoring the device itself, there is the impact generated by the functions it performs such as balancing, session control, application access control, etc.
At this point, monitoring should ensure that enough information is generated so that analysts can, among other things, determine platform errors, evaluate the efficiency of the NetScaler system work and define the relevant changes in terms of their configuration, and support or hinder system growth and expansion processes.
In addition, for the particular case of application monitoring and end-user experience, at crucial points such as response time, for example, it is essential to consider the portion of time consumed by NetScaler actions and their contribution in the total amount of time.
All these challenges can be faced with the Citrix NetScaler monitoring from Pandora FMS platform.
The idea here is to extend the scope of Pandora FMS to cover the NetScaler system, for which there is a group of plugins specially developed for this purpose.
With this integration, we can obtain information about NetScaler devices using the SNMP protocol.
Among the information we can obtain are the level of CPU, disk and RAM use, as well as values that will allow us to check in real time the status of its most important components.
And, as for the health of the system itself, the plugins allow to determine the number of active connections and total connections, in addition to improving traffic evaluation in terms of sent, received and failed packages.
It is interesting to mention that the integration proposed by Pandora FMS uses the IP addressing of the VIP virtual servers to establish the measurements on the status of each of the virtual servers connected after the NetScaler device.
Of course, you are invited to delve into Citrix NetScaler monitoring possibilities and all the Citrix products included within the Pandora FMS product.
A first step can be asking for more information filling up this simple form; remember to tell us all about your platform and your monitoring needs.
And of course, you can review all the facilities provided by Pandora FMS through this link.
Best productivity apps to improve your productivity
Work may be the place where we are least productive, perhaps because of pressure, laziness, routine, or boredom. In fact, it is in our humble workplace where procrastination triumphs the most. That buzzword that encompasses postponing our homework and tasks for another time, while we entertain ourselves in less urgent things but that please us much more: reordering pens on the table, going for the third coffee in the morning, wondering what we will have for dinner tonight, or recalling an unfair school fight in which we had to win. So, to make our work easier and deliver greater performance, today we’re going to go over a list of applications to improve the most cutting-edge productivity.
Best productivity apps to improve productivity : Google Now
We deserve this, Google Now is not the only one, but it’s one of the ones we like and it’s available for both Android and iOS.
It is activated by the powerful voice of the owner of the computer where it runs and begins its work by doing its searches on the Internet, locating the places you are interested in going, approaching the weather forecast, publishing in networks, programming alarms and events … You will also be able to make calls, read emails and write texts faster. In short, everything you could do alone but faster and ordering it to another being who is not to blame but is super effective and diligent.
Best productivity apps to improve productivity : Trello
One of the best task managers in the market. You can make it work any way you want. You don’t have your shopping list ready, go for it. You want to organize the final project for your company, go for it. Your town’s neighborhood association needs someone to fix an event for them, it looks good and that’s why.
The application is free and compatible with the web. With it you will be able to share the tables of tasks between users, organizing yourselves like the best of the devices. There are different tags, checklists, attachments, delivery dates or end dates to help you. You will be able to communicate with your team through comments or make another member of the project responsible for a task (when you look too tired to continue as a leader).
Best productivity apps to improve productivity: Buffer
If your company must be synchronized and in deep symbiosis with social networks 24/7, you need Buffer. This application gives us the possibility of programming our content in LinkedIn, Facebook, Twitter and Instagram, among many others, to be published when you better come or more suited to your target of followers.
Buffer is free, and it’s nothing complicated to handle. You can find it available both for your computer and in its different operating systems and also in iOS and Android in their mobile versions.
Best productivity apps to improve productivity: GoToMeeting
If going back and forth is a torture, try GoToMeeting. You’ll save all that time and money that unnecessary trips to meetings take with them.
This more than award-winning application will allow you to videoconference up to 25 colleagues, as long as they are users. Through it you will be able to share the necessary documents, without having to take them from one side to the other in a file cabinet, and make sure that the companions that are with you in the meeting are following the meeting.
Another of its great values is the invulnerability of its transmissions, protected with high security encryption and optional passwords. This, combined with a web-hosted subscription service and highly restrictive firewalls, forms a perfect shielding for your communications.
Best productivity apps to improve productivity: IFTTT
IFTTT (“If This, Then That”). This application performs immediate actions, previously programmed, if a certain action occurs.
IFTTT is a type of web service that lets you create and program actions and automate them on the Internet. Some examples could be that the phone is turned on at a certain time, that when we mark an email as important or a reminder to your mobile, and to make sure that if we upload a photo on Facebook is also uploaded to Twitter, Telegram or Instagram … It is also used in a wide spectrum of automation, especially in home devices, you know, that the lights are magically turned on if it detects any movement in the room.
IFTTT is a free online application. You can use it on both Android and iOS.
By the way, speaking of the most useful things for productivity and work, how about the latest in monitoring? Do you know Pandora FMS? Pandora FMS is a flexible monitoring system, capable of monitoring devices, infrastructures, applications, services and business processes.
Still want to know more about system monitoring? Luckily, you’re in the right place to learn more. In this blog there are dozens of articles that can introduce you to this exciting world. Here you have a link to our homepage: https://pandorafms.com/blog/
You can even send us any query you may have about Pandora FMS. You can do this in a very simple way, thanks to the contact form found at the following address: https://pandorafms.com/contact/
Get to know through an illustrated TLS how private data is protected
The wise saying says that the rope always breaks at its weakest point. That is why today we will cover the subject of safe communications with an illustrated TLS connection.
In a previous article, we talked about the Caddy Web Server, which incorporates the Transfer Layer Security or TLS (its accronym) by default, which provides us very important security for our communications with our Pandora FMS server, our banks, social networks, etc.
Once upon a time…
As the beginning of children’s stories says, we will tell you a bit of history: the popularization of encrypted communications (which can be intercepted by third parties but whose content would take a long time to decipher, which means our personal data) arose as a result of the scandals related to the information leakage of the hacker Edward Snowden. At this point you may realize that this article is appropriate not only for us geeks, since the case had a huge media coverage worldwide and surely you have heard about it. Thanks to this incident, most browsers today warn whether a page is not encrypted and even deny the connection if the security certificate is self-signed.
In order to massify our privacy, the Electronic Frontier Foundation, better known as EFF, created the program Let’s Encrypt so that with just one little donation a year you can count on certificates automatically and massively in your blogs, company websites, etc. In fact, Caddy Web Server includes Let’s Encrypt installed by default!
Then, HTTPS is available to everyone. Indeed, that famous lock icon that appears on our web browser, usually in green or blue (depending on the certifying authority), which originally came to be by merging HTTP and SSL (“Secure Sockets Layer“) which today is completely “obsolete” and has been replaced by TLS in order to make it impregnable.
Pandora FMS and its console
At this point, we must make clear that Pandora FMS (along with a huge number of web applications) uses a web server for console operations and its Application Program Interface (API), and it is our duty to acquire a security certificate to install it and guarantee privacy when monitoring systems. But all of what we are explaining here is beyond the scope of the Pandora FMS source code.
In case you are wondering: “In what (safe) way does Pandora FMS communicate with its software agents?”. The answer is the Tentacle protocol and here you have a guide for your own certifications withOpenSSL. After this general overview, let us get into the illustrated TLS.
Coffee
We recommend it since you will need it to get your neurons ready for this journey. Seriously.
Illustrated TLS
In November 2018, Mr. Michael Driscoll created the illustrated TLS version 1.3, under the software license of Massachusetts Institute of Technology (MIT license), so that understanding how this technology works, step by step, byte by byte, would be easier (which he managed to portray very well). In this link you can see live how the 1.3 version and also the previous 1.2 version work. Here we will describe the latest version and the process of sending the word “ping” encrypted (with an encrypted answer too: “pong”) in a very summarized way.
Terms used
Just a few necessary concepts:
Endpoint: one of the two ends in communication, the client or the server.
Client: the endpoint that initiates communication.
Connection: the transport layer that communicates both endpoints.
Handshake; here we will place greeting: the negotiation between both endpoints in order to agree which protocols to use.
Private key: a very, very special number that we can either generate ourselves or can be provided by a trustworthy certifying entity. In both cases, a corresponding public key will be calculated by complex mathematical devices, which will be the one we will give to everyone with whom we are going to communicate.
Illustrated TLS: start of the procedure
Client key generation
Prior to connecting, the client randomly selects a very large number to use as private key and with a mathematical formula (in this example X25519, proposed by Daniel J. Bernstein) proceeds to generate a public key that will be the one that will provide safe communication to anybody (with OpenSSL you will be able to confirm its mathematical relation).
Generated temporary key verification by means of OpenSSL
Client greeting (connection start)
The client sends a packet introducing itself with the information about the TLS to be used. Do you remember that we mentioned SSL? Well, the client sends the “31” keyword in hexadecimal to tell the server that it is able to understand TLS 1.0 (SSL 3 + TLS 1 = “31”) But weren’t we talking about TLS 1.3 ? Yes, but for backward compatibility it is necessary to indicate to the server that your client manages all these versions:
TLS 1.0: “31”.
TLS 1.1: “32”.
TLS 1.2: “33”.
TLS 1.3: “34”.
Also, for compatibility reasons we send a non-empty session identifier, although it is not necessary in TLS1.3 since it uses PSK (pre-shared keys). Another important value is SNI (Server Name Indication) for web servers that host multiple web domains together. The new features are encryption methods, narrowed down to the safest ones in TLS1.3, as well as not using compression.
Server key generation
Once the greeting is received, the server performs the same job done by the client before answering.
Server greeting (response to connection)
If the server supports TLS1.3 here, it will still send a “32” (TLS1.2), probably the same session identifier that the client sent (which we will not actually use) accompanied by the very important server public key calculated at that point. Among other values, it will send the encryption method, in this case AES128 and SHA256. Notice that we have not started encrypting any communication yet; all this can be intercepted and read by a third party without much effort, but let us continue.
Calculation of keys in both parts
It is worth clarifying that, although encrypted, the packets will be “tagged” (first 5 bytes) as TLS1.2 for all of those which are in the middle, since the norm is very recent it can lead to these intermediaries blocking our messages. This happens because Internet is a series of interconnected computers and they trace a “path” between us and our destiny.
Conclusion of the greeting
The server will send its granted security certificate, provided by Let’sEncrypt for example. What is this? Well, basically, it is the public key generated from the private key generated by Let’sEncrypt, in addition to the identifiers for this certifying entity. The interesting thing about this process is that these identifiers are also certificates backed by other certifying entities in a trust chain that will eventually reach a pre-installed security certificate in the web browser of the client.
The server takes the public key from the client and combines it with its own private key and the client does the same too. It is here where all encrypted communication starts, which is what really differentiates TLS1.3. However, packages with superfluous information will be exchanged by backward compatibility.
In addition, the server will mathematically bind the public key generated for this connection with its own private key that belongs to its security certificate granted by Let’sEncrypt (go for it, we are about to finish).
Although there are other processes that we will not mention, the next important step is that both server and client will make a digital trace or hash made with an SHA256 algorithm for all these messages in TLS1.3 format (without the 5-byte header that identifies them as TLS1.2 publicly to avoid blocking) that have been exchanged. This is done in order to verify throughout the conversation that ALL encrypted packets that are sent and received are issued by who they claim to be.
Illustrated TLS: end of procedure
Simplified process: the conversation
The greeting and encryption process is much simpler than what it seems. Here we illustrate it as a conversation between client and server:
Client: Hello! I would like to establish a secure communication between us, over here I hand you out my encrypted code and the SSL/TLS suitable version.
“Server key generation” and “Server greeting (response to connection)”
Server: Hello! How are you dear client? I have already checked the encrypted code and the SSL/TLS version. They are ok, so let’s continue with the conversation. I send you my certificate and my public key. Check them out!
“Calculation of keys in both parts”
Client: Let me check them… hum… yes, they seem correct, but first I need to verify your private key. To do this, do the following: generate and encrypt a pre-master (a shared secret key) using your public key. Next, decrypt it using your private key and use the master key to encrypt and decrypt the information. Is that ok with you?
Server: Perfect!
“Conclusion of the greeting”
Now that both client and server have made sure who they are really talking to (after checking the certificate Let’s Encrypt), the information they exchange will be safely transferred.
Sending the “ping”
The client will be able to send the word “ping” in an encrypted form, the server will also answer “pong” in an encrypted form, but in addition, it will send us two session identifiers before (with additional security measures). Those usually expire in 48 hours, to accelerate the following connections and not repeat completely all this process that we have just analyzed. Brilliant, right?
You already have in your web browser the session identifiers needed for you to read our other articles. ¿Do you still want to know more about IT system monitoring? Luckily, you are at the right place to find out more. In this blog, there are dozens of articles that can get you in this exciting world. Here is a link to our home page: https://pandorafms.com/blog/en/
Or you can also contact Pandora FMS directly if you have more than 100 devices to monitor. Just click here: https://pandorafms.com/contact/
If you have a reduced number of machines to monitor, you can learn more about the Pandora FMS OpenSource version here: https://pandorafms.org
Customer service culture (or customer centric) is that set of practices or strategies that promote for the actions carried out by a company to be aimed at the client. That means they are carried out thinking about the customers’ point of view and trying to meet their needs or wishes.
The concept of customer centric culture has been developed and become a trend over the last few years, as users have been gaining power in their deals with brands.
Because, in recent years, customers have been gaining a certain kind of “superpower”. In fact, although the user has always been very important for any business, things were very different just a few years ago.
We can think, for example, of the differences regarding purchase options. A customer born in the 60s, for example, could hardly choose among the products that could be found in his closest geographical area. At present, however, you can choose among a range of options that go far beyond your street or your city, covering the entire country and, often, stores beyond your own borders.
Or you can think about how much the information that the customer has has changed. While before you could hardly resort to friends or acquaintances, now you can find at your disposal a large amount of information, displayed in hundreds of blogs, profiles on social networks or reviews.
Or you can also think about you being able to express your opinion. By having so many options, so much information and so many ways through which you can express your opinions, brands must take care of their users more than ever, under penalty of receiving negative criticism that can be seen by thousands of potential customers .
Since currently the client is so powerful, many companies have taken it into account in all aspects of their activity. Thus, more and more people who want to take care of their users keep supporting customer centric culture, because they know that the survival of their businesses depends on them.
But what does “customer centric” philosophy mean in more practical terms? Let us see some ideas.
1. Convey the customer centric culture
To put into practice customer centric culture ideas, it is essential to convey to the people who are part of the company the need to take this philosophy into account.
Because customer centric culture involves all the people who are part of the business. It must be something that everyone keeps in mind to be able to apply it to their corresponding work areas. And to keep it in mind, you should talk about it, remind it and emphasize this philosophy as many times as necessary.
2. Involve the members of your company
Communicating is important, but it can be even more effective to show how the customer should be dealt with by setting an example.
Because dealing with the users does not have to be a matter of just commercial or customer service departments. For example, some companies ask members of more technical departments to spend a few hours in customer service, in order to experience for themselves a closer contact with users.
With this type of practice, it is easier for certain members of the company to understand better the needs and concerns of customers, which will help them when thinking about them.
3. Make an effort to get to know your clients
It is one of the keys, and something that you sould not forget. In order to be able to provide a good customer service to the client, you must be willing to get to know his desires and needs. Otherwise, the measures that you take could not be the appropriate ones.
How? There are multiple ways, depending on the activity of your business and the way you deal with your users. For example, you can find some clues to find out the needs of your clients in this post.
4. Encourage setting customer centric culture in motion
Indeed, it will not be always as simple as remembering it or experiencing it. Sometimes, particular incentives will have a great effect.
For example: imagine that you have a restaurant and you ask your clients to rate the service offered by the waiters at the end of their visit. You can set bonuses for those who got a better rating, which will probably improve the quality of the service.
This is just one example. According to the characteristics of your business, you will find a way to implement some measures that encourage applying customer centric culture.
And these were our very special tips, they are just some ideas, but this is a factor that, undoubtedly, you should not forget: customer service.
Because customer service is a “key point” within customer centric culture. And, where else is the relationship between users and business more direct?
Therefore, if you want to stablish a customer centric culture in your company, you must care for customer service. And to achieve it a little bit easier and more efficiently, you have some tools available, such as issue management systems. Will you let us introduce ours? It is Pandora ITSM!
Pandora ITSM is a program that provides, among many other features, an issue management system (help desk software) based on tickets (ticketing) that can be useful for customer service management within enterprises and organizations.
Or you can also send us any questions that you may have about Pandora ITSM. Do it in a very simple way, thanks to the contact form which is located at the following address: https://pandorafms.com/en/contact/
Behind Pandora ITSM there is a great team that will be happy to assist you!
What is Data Lake?; Learn all about it and Big Data
Data! More data! What is Data Lake?
Big Data is not only a more or less fashionable marketing “word”, but also contains a quite clear concept: the accumulation and processing of enormous amounts of data in order to take advantage of the knowledge they may contain. So far so good: it’s easy to describe (not so easy to do, though).
Now, the way to store and take advantage of that enormous accumulation of data that is the Big Data can be diverse. Traditionally, one of the ways in which companies have been storing data is in the so-called Data Warehouse; however, a new way of storing data -closer to the concept of Big Data- is gaining followers in recent years: we know it as Data Lake. What is Data Lake?
But what is Data Lake?
Data Lake is a data repository in which data is stored “raw”, with hardly any processing, in order to be used later, at the time it is considered appropriate. Continuing with our oil analogy, we could say that in a Data Lake the data are stored “raw”, just as they “come out of the ground” and without “refining”.
Data Lake are fed by all types of data, with different structures (they also accommodate structured data) and from heterogeneous sources. The key concept is that of “storage”; the idea is to save the data so that they can be processed and used when necessary.
Now, not everything is as simple as throwing them into a container. Each element of the Data Lake receives an identifier and extended metadata tags, so that it can be easily identified and retrieved. However, as we will see below, this treatment is much more basic than the one received by the data used in the Data Warehouse.
How is Data Lake different from Data Warehouse?
We could say that the main difference is found both in the quantity and in the “refining” of the data.
In a Data Warehouse, the data will be structured or discriminated according to their usefulness; only the data that we are going to use for the specific objectives that are tried to reach would have a place. In addition, they will be processed beforehand so that the system can use them and extract useful information. As we said, in the case of the Data Warehouse, the “refined” is much more exhaustive than if it were a Data Lake.
The Data Warehouse will be fed with data depending on its usefulness for a specific purpose and, in addition, will give these data the specific format so that they can be analysed. The objective to be achieved will usually be the answer to a specific question or series of questions, which will be reflected in the form of reports.
For example, the Data Warehouse can help a company detect customer demographics and identify buying patterns, with the goal of directing marketing efforts in one direction or another. Or it can be used to identify users who are most likely to leave with competition, with the aim of providing incentives for them to remain customers.
What is Data Lake? Data Lake works in a different way. This is a huge “lake” in which, as we said, the data are stored with a very basic pre-treatment, only with the aim of being able to be recovered when necessary processing and analysis. Thus, Data Lake can accommodate many different types of data, from different sources and in different formats. This requires, of course, that the storage capacity be enormous, often more than in the case of a Data Warehouse (this is one of the main reasons why Data Lake is usually considered closer to the concept of Big Data than the Data Warehouse).
The different structures of a Data Lake and a Data Warehouse will make each option offer different advantages and disadvantages. With regard to Data Lake, it is often said that they are more flexible and agile (but also more extensive) about Data Warehouses that are more structured and more efficient (but also that they are more rigid and less adaptable).
Both are different ways of storing and organizing large amounts of data and, therefore, each option may serve to a greater or lesser extent depending on the objectives to be achieved. In addition, they are not exclusive options.
And now that we know what a Data Lake is, how about spending a few minutes discovering Pandora FMS?
Pandora FMS is not a Data Lake, nor is it a Data Warehouse. However, it is another type of tool that can also offer great benefits to a company or organization. Pandora FMS is a flexible monitoring software, capable of monitoring devices, infrastructures, applications, services and business processes.
Or you can also send us any query you may have about Pandora FMS. You can do this in a very simple way, thanks to the contact form that can be found at the following address: https://pandorafms.com/contact/
Black Mirror and monitoring: how it is linked to fiction
At this point of the series-junkie revolution of the last couple of years, who has not already seen the great ones? The Sopranos, Lost, Breaking Bad, Game of Thrones… are some of them and there is one that is more related to what concerns us today: Black Mirror. You have heard about it, right? That TV show, created by Charlie Brooker, whose plot deals with how and to what level technology affects us, sometimes bringing out the worst in us. But how are Black Mirror and monitoring related?
Each episode has a different approach and scenarios, but they always address the immediacy of technology and its influence on us. It works as a mixture of The Twilight Zone and Tales of the Unexpected, which explains our current discomfort with what could be expected in the future if we deal with technology with little ethics. Among all the themes that the series approaches, we especially love the ones closest to monitoring. Because, while they make our hair stand on end, they also help us to get a glimpse of how monitoring works and what its powerful qualities are. We are going to review two specific episodes that focus on the Black Mirror and monitoring topic to see what we can learn from them.
Black mirror and monitoring: Hated in the Nation – Season 3, episode 6
We go to the most recent news with a thriller whose goal is to reveal a series of murders. Karin Parke (actually, Kelly Macdonald, the girl who gets involved with Renton in the legendary Trainspotting) is a detective who, together with her expert partner in technology, tries to solve murders, which seem to have no explanation, of certain people who have been criticized and vilified on social media. Does it ring a bell? It sounds just like criticizing non-stop on social media, right? Well, as the plot progresses, several circumstances that we currently believe to be impossible are revealed, but they could actually be part of the future.
Broadly speaking, the episode deals with the possibility that, through a hashtag (“#DeathTo“), affiliates to social media can vote who deserves to die for having insulted their honor or having offended them. Those who get more votes in the episode are those who end up dying. This case sounds interesting, right? Let’s say, for example, that everyone gets mad at Taylor Swift for dissing Kanye West and she wins this contest and appears dead the next morning. “How?”, these detectives would ask. Well you see, there is a whole fleet of robot bees, which at first are used to replace those that are currently disappearing, but the villain of the episode hacks and uses them for his own purposes. That is it, the villain guy hacks the robotic bee that pollinates the garden closest to the scapegoat and “BAM!”, lethal sting, self-destruction, and nobody knows how it happened.
From here we cannot give a solution to those people who gather to hate from home in any social network, and no one can be held responsible if one day they come together, far from the virtual scene, and undertake the killing of those people who have offended them, the thin-skinned, but we can talk in favor of monitoring. The real problem with these bandit robotic bees is that their monitoring is not good.
Why not provide them with a type of sensor that allows the robot apicultor (or robot bee manager) to monitor their hives from a computer or from a mobile device? This specific bee control would allow us to receive in real time information about them (including where they are or where they have been) with the possibility of intervening right at the time you are warned by a circumstance alarm. Because it is obvious that this type of monitoring would also reveal any type of danger or external control to which they are subjected. In fact, this is already done with bees (not robotic ones) at present.
We want to think that after the success of this episode, the fictitious company of the plot has learned from its mistakes and took action on the matter. It will not happen again.
Black mirror and monitoring: Arkangel – Season 4, episode 2
Let’s go for the bothersome super parents, those who jump rope with the longest umbilical cord in the world and with which they strangle their poor children.
“Arkangel” is the name of the episode and also of the company of the plot responsible for the chip that parents implant their children for things, as viable for a crazy father as tracking, controlling, or pixelating the images that they think would cause them anguish.
On this occasion, it is Marie, the single most control-freak mother in the world, who had that technology implanted on her daughter Sara, poor Sara. At first, this technology seems to be useful, but we will soon realize that an excess of love and supervision can become an obstacle with ethical and vital connotations. Nobody learns to ride a bicycle if we always hold it from the back.
In this case of Black Mirror and monitoring, we can feel the effects of the excess of control. As we already know, no extreme is stable and we advise nobody to turn to them in monitoring, which is useful to solve technological problems in the work environment and regarding staff, but could be uncomfortable when dealing with the privacy of the individual.
By the way, if you have come this far and are interested in the particulars of monitoring, how about a little bit of time to talk about the latest in monitoring? Do you know Pandora FMS? Well, Pandora FMS is a flexible monitoring system, capable of monitoring devices, infrastructures, applications, services and business processes.
Still want to know more about system monitoring? Luckily, you are at the right place to find out more. In this blog, there are dozens of articles that can get you in this exciting world. Here is a link to our home page: https://pandorafms.com/blog/
You can even send us any questions you may have about Pandora FMS. Do it in a very simple way, thanks to the contact form which is located at the following address: https://pandorafms.com/contact/
Once upon a time, we practiced all the yoga poses with the radio and TV antenna in order to leave the snow behind and get a good signal.
We’ve also seen partners shouldering their partners with their arm in the air, trying to get a little more coverage.
But none of that compares to the chaos that ensues in trying to get good Internet or WiFi itself, that manna of wireless interconnection that we all need in our lives like coffee on Mondays or vermouth on Sundays. Desperate people have been seen, in search of how to improve Internet speed, praying in distress on street corners, asking the God of technology for a solution.
How to Improve Internet Speed: 6 Tips for Faster Internet Speed
For all those people who have such a hard time trying to find out what the hell is going on that pages never load and files never download, for all of them, this article will try to elucidate how to improve Internet speed with the techniques and tactics that we can enjoy in this year 2020.
1. Test your speed
Just sensing that your Internet is going badly is not enough; that is why the best thing you can do is to test your speed, to test it. Because if you don’t really know the speed you already have, you will never know if you are improving it a lot, a little, or getting worse. For this there are a lot of applications that you can find on the Internet. Do not limit yourself to a single measurement, perform the process for several days and on several occasions, so you can assume the times of saturation or some specific problems.
2. Restart your network
It may seem too easy, but there are connectivity problems that can be solved by rebooting the router, such as operating system failures, two devices that have the same IP and this conflict causes the network to fail, excessive heat…
So, you know, hit the “fat button” before going crazy looking for possible intricate problems and solutions.
3. Beware of interference
You may not have suspected it, but there are devices that are not linked to WiFi and can sometimes operate on the same 2.4 Ghz or 5 GHz frequencies.
From Bluetooth devices, cell phones, baby monitors, poorly positioned satellite dishes, power supplies, LCD screens… Microwaves, for example, can generate radio frequencies that hinder the network, slow it down or even disconnect it.
For that reason you should place the router strategically and as far away as possible. It may also be a good idea to turn off (temporarily) those electronic devices that may bother you, to see how their interference affects you. We can solve the frequency interferences by changing the WiFi channel for the router.
4. The best wifi channel
Your friendly neighbors and their inherent routers may interfere with yours, causing your signal to suffer. This is because wireless routers operate on a number of different channels. It is best to put yours on the channel that is least likely to have the least amount of interference. To find the channel that suits you best, you can use tools such as Wi-Fi Stumbler or Wi-Fi Analyzer.
5. Say no to the wifi thief
Even if your router has that impossible-to-memorize password, it can be very easy to hack by the minimally knowledgeable. The expert WiFi thieves know it, I’m not saying they are something like Carmen Sandiego or Ethan Hunt, but they usually find out in an easy way the password of others, especially if you still use the password that comes from the factory.
Therefore, for the sake and security of our WiFi, the best thing to do is to drastically increase the security of the router. Use a WPA key or eternalize the key by lengthening it endlessly and customizing it, so that the wifi kleptomaniac will give up trying to hack it.
6. Bandwidth-sucking applications
Look around; if there is someone out there who does not stop with video calls, who has no life because he dedicates it to online games, who on top of that downloads torrents in droves or polishes platforms like Netflix all day long… surely that one, if it is not you, is the one who is killing your Internet speed.
Activities such as those mentioned above are the ones that can eat up a large part of your bandwidth, causing your Internet speed to suffer for the rest of the users. It is necessary to give preference to some applications over others, so that the most important ones receive the bandwidth they deserve.
And while we’re on the subject of monitoring…
How about a little space to talk about the latest in monitoring? Do you know Pandora FMS? Pandora FMS is a flexible monitoring system, capable of monitoring devices, infrastructures, applications, services and business processes.
For example, if you have a website and you want to know if your visitors are having a good user experience, you can monitor it with Pandora FMS. In this video you can see how:
Do you want to learn more about what Pandora FMS can offer you? Find out by clicking here.
If you have to monitor more than 100 devices you can also enjoy a FREE 30 days DEMO of Pandora FMS Enterprise. Get it here.
Don’t hesitate to send your questions, the Pandora FMS team will be happy to help you!
Mapping and Monitoring: Always together until the end of time
Maps have been related to the management and monitoring activities of IT platforms for a long time.
Years ago, when there were no tools available to generate the graphical vision we call maps, the documentation of the device that made up the platform was usually carried in tables and diagrams where the existence of the components, their characteristics and relationships were recorded.
Tools were then developed to facilitate the creation of network diagrams and maps. These tools were very useful, but they did not make automatic discoveries so all the information had to be entered manually. Even today tools like Microsoft Visio continue to be in frequent use.
Then the network management tools introduced automatic resource discovery facilities, also offering sophisticated editing facilities for the resulting maps.
Also worth mentioning are the tools specialized in business intelligence and data visualization that use, in addition to maps, other types of tools such as graphs, diagrams and infographics. Tools such as Tableau, Qlik and Carto, among others, are popular in this area.
As for the maps in the general purpose monitoring tools, like Pandora FMS, we can say that they are one of the fundamental facilities of these tools.
Maps exist to support and facilitate the work of analysts and administrators, who use monitoring tools for daily monitoring activities and in optimization projects.
In fact, it is assumed that any monitoring tool must include the possibility of network mapping and offer a minimum of editing facilities.
On the other hand, it is common to hear about the advantages offered by other types of maps also related to monitoring, such as so-called application dependency maps or heat maps for wireless networks.
Maps and Context (in mapping and monitoring)
Maps are graphical representations of information on a spatial basis, which immediately gives context to the data being observed.
This contextualization is the key factor that makes it possible to differentiate maps from other information presentation tools such as graphs and info graphics.
For example, if the failure of a server is important to us, because it implies a risk for the optimal performance of the platform, visualizing this situation in a map immediately gives us a context.
In other words, you can tell us in which locality the condition occurs, in which network segment and which are the possible devices, users and applications involved. All this in a merely visual exercise.
Maps and their advantages (in mapping and monitoring)
From here the maps are distinguished by the advantages they offer and their potentiality.
Indeed, mapping advantages are decision factors when choosing one monitoring tool over another.
Here is a non-exhaustive list of the most common advantages:
Automated discovery: this feature is one of the most basic and also one of the most valued.
The idea is that the monitoring tool, through the creation of maps, could “read” the platform in its entirety and present both physical and virtual elements, as well as their relationships.
Automatic discovery is efficient in that it automates human documentation activities as much as possible.
At this point we also include the fact that the map is constantly attentive to changes and modifications in the platform, so that through constant updates reflects the current situation of the platform.
It’s also interesting to mention the capabilities of maps to show changes over time, i.e. the possibility of having one map before and another map after a change in the platform.
In particular Pandora FMS maps have a waiting area where the nodes that are new in the platform appear, without warning in the maps, which results in a very practical way to be aware of the changes.
In this image we see an example of this way of reflecting the changes:
example of a map with new devices in the dock
Low levels of bandwidth consumption: When a map makes the discovery and automatic updates implies an additional load on the platform.
This additional load is formed by the traffic associated with the protocol(s) used by the map to access device information, e.g. SNMP, WMI, CDP, VMware, Hyper-V, etc.
The idea is that this additional load is minimal to the total traffic of the platform and in no case represents a distorting factor of the performance of the platform.
Reliability and consistency: Data consistency and a high level of resulting reliability are indispensable characteristics of any map.
The monitoring tool must ensure the consistency of the data that feeds the maps, as well as the information that is included through the map editing facilities.
This ensures that the analysis done using the map as a source of information has the same validity as the analysis performed through any other non-graphic facility.
Flexibility: This includes all the facilities that maps associated with monitoring tools can provide.
Simplicity in the conformation of the maps; as the possibility of starting from a blank map and adding the real or fictitious devices that are necessary.
Simplicity in the visualization; perhaps of a very extensive map we are only interested in seeing a portion or working by blocks of devices, reason why it is interesting that the map includes possibilities of approach and grouping.
Pandora FMS network maps include a red box that shows the general map section you are working with.
example of a map with the box showing the section of the map being worked on
It is also interesting the facilities that allow us to filter elements within the map by one or more criteria. For example, we could require a network map to see only the routers, or only the SMTP servers, or in a map of application dependencies we might be interested in seeing the WEB servers associated with a particular application or a specific transaction, etc.
Simplicity to include documentation about the devices on a map; for example including information about the vendor’s contract for that device, its purchase date and whether or not it is covered by a service contract.
We invite you to review the advantages of Pandora FMS network maps in its version 7.
Export: The idea is that all the information associated with a map can be transferred to other business intelligence tools, for example, which requires simple export processes that include formats such as PDF, PNG, among others.
Sharing and personalization: The maps must be able to be shared by several users of the monitoring tool and at the same time the tool must offer the possibility that each user creates the maps that are interesting to it according to the inherence of his work or to the case that it is analysing.
It is possible for maps to be treated as objects that have an integral entity and can, for example, be copied, erased or used as templates for more complete maps.
Scalability: As with any monitoring tool, maps must be able to scale easily given the growth of the platform and the inclusion of new technologies.
Maps and the future (in mapping and monitoring)
Maps will continue to be one of the most important facilities of monitoring tools, so they must adapt to changes in the world of technology.
In fact, different virtualization schemes, software defined networks and the tendency to implement hybrid platforms (proprietary – cloud) are challenges for maps.
It is also expected that the maps will contribute to the analysis that is carried out. We have recently seen an interesting fit with application performance analysis.
Application dependency maps are intended to provide information about the hardware and software components that are part of each of an organization’s applications, making it easier to find the causes of a problem and multi-layered analysis of the performance of the application in question.
In the future we will undoubtedly see efforts from the developers of monitoring tools tending to build up the capabilities of their maps.
For now, we invite you to share how useful you make maps and what you would expect from them in the future.
Surely you have heard the term “smart home” some time, and you may have wondered “what is smart home?” but you’re not sure what it is about. Or you may already know perfectly what smart home is, but you want to increase your knowledge.
You have come to the right place! In this article we will anwer the wuestion “what is smart home?” and see some of its applications, both present and future. And at the end of the article we will also cover some aspects of smart home in regards to monitoring. Because we are that good!
What is smart home? We call smart home the set of intelligent technologies that are used for the automation of homes and/or buildings, in order to improve aspects such as security, energy management or comfort.
But, what are we talking about when we say “intelligent technology”? Well, although it should also be applied to the approach we give to the different elements that make up smart home, when we talk about intelligent technology we refer to, as in many other fields, the application of IT to the home environment. In short, we mostly talk about what we like the most in Pandora FMS blog: information technology.
Some examples of smart home
To know some examples and uses of smart home, what better option than to classify them according to the specific benefits it pursues? Thus, in addition, we will be able to guess about some technologies that, although they have not yet been developed, it is likely that they will do so over the next few years.
Comfort
Everyone wants to be comfortable at home, and that is why this is one of the aspects we first think about when we think of smart home.
Currently, there are some devices which have already emerged, with the aim to make our home life more pleasant. From the very popular voice assistants, to the no less famous cleaning robots, which involve an approach of artificial intelligence and robotics to the domestic sphere. But not only them; intelligent lighting (controlled by voice, automated and adjustable) or controlling different functions (for example, thermostat or electric blinds) through your cellphone via Internet are some technologies we already can count on.
But, what about the future? The options will multiply. As the Internet of Things is developed, all the elements of your home will gain interconnection and reach new levels. You will be able to control your entire house with your voice and automate virtually any need you have in your home life. And not only that: the effects of smart home will be transferred outdoors through the use of multiple services. Our refrigerators will buy groceries autonomously when they deem it necessary (do not worry, they will not walk out through the door, but they will order what is necessary through the Internet) and intelligent objects themselves will be responsible, autonomously, for home maintenance. And these are just a few examples!
Communications
Today, we are obsessed with communications, and smart home is not uninvolved. We can already see it, through the aforementioned voice aids and functions to control some devices from our cellphone.
In the near future, the possibilities will multiply: from videoconference screens distributed throughout the house to the Internet integrating itselft with many elements on our home. Smart televisions, for example, are an outpost of what we will see in a couple of years, when our homes will become, indeed, a communications center in our lives.
Energy saving
Energy management matters to us, and even more each day. Smart home will help us with this task. We have already seen some examples, such as intelligent air-conditioning control. This will not only provide benefits in terms of comfort, but it will allow a more efficient management of energy consumption.
More examples: a wind or sun sensor will allow the system to make decisions, such as roll up an awning to prevent it from getting ripped on a windy day, or throw back electric blinds if we want to enjoy a sunny day. Certain electronic devices will be able to detect when they will be necessary or not and they will be switched off or swiched on depending on our needs. Even some will carry out their tasks adapting to the schedules in which rates are lower, reducing expenses.
Security
An always delicate issue, in fact, our home security is always an aspect that we want to take care of.
Devices such as alarms (of course, they already exist, but future smart home will aim to improve them), presence simulators and surveillance cameras will improve home security. Different detectors such as those of smoke, heat, water or gas presence will help us to act faster in the event of emergencies, and they could even be directly conected to public services such as the fire department.
Accesibility
For some people, smart home will mean a significative improvement in their life quality.
For example, people with reduced mobility, blind people, or people who suffer from some disease. In these cases, multiple devices will be a great help. Including intelligent devices that communicate by voice with blind people and others that move around the house to help those who have difficulties when moving around. Not to mention, why not, robots that carry out complete assistance functions. It may sound like science fiction, but they will soon be a reality.
Smart home and monitoring
To wrap things up, and after having seen “what is smart home?”, let us talk a little bit about monitoring.
As you may already know very well if you are a regular reader of this blog, system monitoring is responsible for ensuring the proper functioning of all types of devices and networks, in order to help anticipate their malfunction or solve issues quicker when the failure cannot be avoided.
As the use of technology increases, so does the need for good monitoring. Very soon, we will see it everywhere. Think, for example, of a building or a neighbourhood that has hundreds or thousands of devices connected to the Internet and distributed around common areas. In addition, smart home is part of the so-called revolution of the Internet of Things, and that requires a specific type of monitoring.
One of the things we know about IoT monitoring is that the monitoring systems’ flexibility is something to take into account. And it leads us directly to Pandora FMS.
Why?, because Pandora FMS is a flexible monitoring software, capable of monitoring devices, infrastructures, applications, services and business processes.
And now you may need more specific answers. Do you have specific needs and want to know exactly what Pandora FMS can monitor? It is very easy, you just have to send a message asking all your questions through the contact form.
Before doing it, and if you want to know more about the IoT monitoring of Pandora FMS, you can have a look at this link.
Do not hesitate to contact the Pandora FMS team and send us all your questions. We will be happy to assist you!
Everything has to work at the right temperature. Everything! Or would you be able to work at 70ºC?
Our computers too. Although they are capable of withstanding higher temperatures than us – humans – computers also have an optimal temperature range for operation and, if they fall outside this range, problems can begin to appear.
Do you want to know how the temperature affects a computer and the causes? Do you want to prevent your devices from becoming a bakery? In this article we will look at some of the causes and consequences of a high temperature, and also talk a little about something as important as computer heat.
How does temperature affect a computer?
Whether you manage a lot of devices or just operate one or two computers, knowing the importance of maintaining the right temperature can be key to keeping your device in good condition.
Computer heat can cause multiple damages. For example:
It can physically damage some components, causing breakdowns.
It can cause performance losses, for example by causing a slowdown in the execution of applications.
It can cause restarts and even damage so severe that they render the equipment unusable, with all the consequences that this can entail.
What causes an increase in the temperature of a computer?
In a computer work various components that can raise the temperature by its own operation, from the CPU to the power supply, through graphics cards or hard disk, are elements whose normal operation produces computer heat.
Therefore, the reasons why a computer can reach an excessive temperature can be multiple. These would be some of the possible causes:
The devices are not well placed: if they are placed in places where there is excessive dust or dirt, direct sunlight or other sources of computer heat we will be putting our computers in serious difficulties.
The device is not clean: it is not only the external cleaning (which also) but, above all, the internal cleaning. Computers tend to accumulate dust and this can cause various problems, for example by malfunctioning internal fans or hindering the circulation of air inside, which will affect cooling.
The device has not been installed correctly: for example, a poorly structured rack may cause heat to not dissipate properly and the temperature to rise.
The places in which they are found do not maintain a stable temperature: you know, the temperature tends to go down in winter and up in summer. The ambient temperature is also an important factor, so care must be taken to ensure that it is adequate in the rooms in which the device is located.
We demand excessive performance from devices: running at a slow trot doesn’t cause the same flushing as sprinting, does it? Even if they are not human beings, our computers also overheat more when the effort you demand of them is excessive, so you’ll have to be careful not to ask too much of them.
The cooling elements don’t work or don’t work properly: it’s a classic. Our long-suffering internal fans often break down or dirt does not allow them to function properly. In this section would also enter other problems, such as those related to thermal paste. Thermal paste is an element that facilitates the dissipation of heat produced by components such as the CPU, GPU, or chipset. Occasionally, a poorly applied or deteriorated thermal paste may fail to do its job and cause the temperature to rise.
There are one or more defective components: in this situation, these components can raise the overall temperature and lead to faults in themselves and other components.
The cooling elements are not well configured: this occurs, for example, when a fan is rotating at low speed. It will be easy to fix it, increasing the rotation frequency, but you have to do it!
Temperature monitoring
As you can see, a computer can see its temperature elevated for many different reasons (the ones we have mentioned are only a few) and get involved in many problems. And the problems it suffers can make you the one who ends up suffering a lot!
Are your devices fundamental to the smooth running of your business or organization? Nowadays, this is very common: many companies depend on the good state of their IT infrastructure. That’s why monitoring tools have become so important in recent years. That’s why it’s so necessary for you to know Pandora FMS.
Pandora FMS is a flexible monitoring software, capable of monitoring devices, infrastructures, applications, services and business processes.
Do you want to know much better what Pandora FMS can offer you? Go here: https://pandorafms.com/
Nowadays, many companies and organizations around the world already have Pandora FMS. Do you want to know some of our clients and read some of our success stories? Check it out: https://pandorafms.com/pandora-customers/
Or you can also send us any query you have about Pandora FMS. You can do this in a very simple way, thanks to the contact form that can be found at the following address: https://pandorafms.com/contact/
Since load balancers are active devices that can be included in the design of a WAN, the question arises: Should we adapt our monitoring scheme to include something that could be called Load Balancer Monitoring?
To answer this question we can assume that WAN monitoring is based on the following fact: the behaviour of communication links directly affects the performance of applications and therefore the entire platform.
It is clear then the need to monitor the links, but to perform this monitoring requires knowledge of the entire associated architecture.
Architecture that usually consists of elements such as active devices (routers, firewall, modems, etc.), communication protocols, the technology used by the links contracted to a service provider, the applications and services that use these links, etc..
Based on this architecture, WAN Load Balancers Monitoring has the following objectives:
Monitoring of the active teams involved with the traffic that passes through each link.
Measurement of bandwidth consumed and available.
Evaluation of the levels of services contracted to a specific supplier.
Identification of bandwidth consumption patterns; which application, which protocol, which user consumes what percentage of bandwidth.
Monitoring of error conditions such as number of retransmissions, packet loss, increased latency, etc.
On the other hand, WAN Load Balancers Monitoring has required adapting to the evolution of technology.
All the elements that have influenced the evolution of WAN platforms have brought challenges that WAN monitoring has had to face. For example, we can mention the trend towards the cloud, the networks defined by software, the consolidation of a model centred on the Internet, the variety in the types of services provided by specialized companies or the development of administrative capacities in the allocation of bandwidth.
The reader interested in these challenges may find interesting this article on the challenges assumed by the implications of SDN and this other related to the Internet-centred model.
At this point, the relationship between WAN Load balancers Monitoring and the architecture of the network to be monitored is clear.
WAN Load Balancers Monitoring
One of the elements that have emerged to improve the performance of communications links and that can form part of the architecture of WAN design are just load balancers.
The operation of the same part of establishing a process through which the outgoing traffic of a network is distributed or balanced between multiple links, which can be provided by different service providers and can be implemented by different technologies.
Let’s consider this scheme as an example:
Diagram 1, example of installation with a balancer and three links from three different suppliers
The definition that some authors use when they indicate that a load balancer is the result of the blissful crossing between a switch and a router is nice.
However, this idea is a bit short given that some balancers have actually been covering Firewall, Proxy, security and even offering QoS implementations.
In any case we can say that, in their basic activity, the balancers offer the following advantages:
They establish a redundancy scheme in case of failure between the different links.
They define an efficient scheme of utilization of the capacities of each link.
They offer administrators a flexible working scheme, where they can choose the best balance configuration based on certain link conditions such as availability, performance, latency, and cost or based on traffic characteristics such as protocol, origin, priority, etc.
The balancing protocols that apply these devices usually do not balance package by package but are often used as a work item ¨ the connections¨.
It is then understood that transmissions are carried out in full by the link assigned at the beginning, regardless of the load in number of packets or total bytes that such transmission involves.
For example, let’s consider the diagram above and assume that we have 10 different connections to transmit, and let’s also assume that each link has a different capacity. After the balancer applies its balancing protocol, we can end up with 6 connections for ISP 1, 3 connections for ISP 2 and 1 connection for ISP 3.
Description It is diagram 1 modified to show capabilities of each link and illustrate the example with 10 transmissions
Of course not everything is light as far as balancers are concerned; their detractors tend to focus their criticism on the consequences of the fact that balancers are other ¨boxes¨ that must be integrated into the WAN platform.
This new box, critics say, offers a central point of failure, makes the platform more complex, and requires administrators to use a proprietary platform for administration.
The reader interested in these negative aspects can review an interesting article here.
Load Balancer Monitoring
Those who are determined to use a load balancer or already have one in their WAN solution must face a challenge in terms of platform visibility.
The problem of visibility of the balancers is that, being a box, monitoring them only offers visibility on the traffic that passes through them and on the performance of the balancer itself.
Monitoring the balancers will not provide visibility over the last mile of the links that connect to it, so the monitoring of the balancers must be integrated into a broader WAN monitoring scheme.
On the other hand, there is the level of abstraction offered by this equipment; when balancing the connections between the links, in some way all the links they handle are being integrated in another non-physical general link that contains the previous ones.
And although they add up the bandwidths of each link, to obtain the total available bandwidth, for example, it is true that the administrative consoles of the balancers present an overview.
In fact, when we manage these teams naturally there is a tendency to understand all the links associated with a balancer as a whole.
Taking this into consideration it is sensible to think that the monitoring traditionally done, i.e. link-to-link monitoring falls short.
So the monitoring software must offer the possibility to monitor each link but at the same time it must offer users the expected group vision.
Said which, we are in the point to be able to specify as requirements to carry out the efficient monitoring of links connected to a load balancer:
Monitor load balancers as an active network device. We can use for example Pandora FMS SNMP monitoring to collect, store and analyse information about the balancers operation.
Perform monitoring of each link individually, determining for example variables such as latency, number of lost packets, compliance with contracted service levels, bandwidth, application list, list of users, list of protocols, and so on.
In this link the reader will be able to find information associated to the bandwidth calculation made by Pandora FMS.
Adapt traffic identification to the way the balancer establishes balancing schemes. For example, if we have a balancer it uses the IP addresses of origin and destination in addition to the identification of the ports, because it would be very useful if we could adapt our monitoring platform so that it carries out this same type of identification.
To form a group with the links connected to a load balancer in order to obtain statistics of the group.
Establish well integrated monitoring and optimization processes between the monitoring tool and the traffic balancer management tools.
At the end of the day the idea is to adapt our WAN monitoring scheme to facilitate the decision making of the configuration of the balancing scheme, support the execution of growth plans in terms of links and bandwidths and evaluate the service provided by each provider, all this in light of the comprehensive monitoring of our platform and applications.
Of course, we invite you to know all the potential of Pandora FMS, especially in the world of LAN and WAN networks, visiting this section of our website.
We also encourage you to share your experiences or concerns regarding WAN load balancers and monitoring, leaving us your comments.
Cloud applications; the best ones to make things easy for a company
Previously, on our own “How to know everything about the technology that surrounds us”, we have already talked about what cloud computing is: that option given by the Internet and its endless possibilities that allow you to store information not just within the hard disks of our computer, at the same time that it allows you to work with colleagues in real time, no matter where you are, and also operate without worrying about any space or location limitations.
The cloud sounds truly like the best thing ever in computer science, the alpha and the omega of technology. Therefore, all kinds of companies turn to several thousand cloud applications in their daily routine. There are all kinds of cloud apps, which is why today we are going to review some of the best ones that can help you in our day to day work. Take a piece of paper, a pen and something to keep you warm, because we are going up to the cloud.
Cloud apps: Microsoft Office 365 OneDrive for Business
OneDrive is the cloud service provided by Microsoft that enables you to have access to all the files you need in this world (within OneDrive and the ones you have access to).
It gives you the possibility to save and keep your files safe, send them to other users and get a hold of them from anywhere and from the device that you have at your disposal (this does not include Gameboys or Tamagotchis, obviously).
Broadly speaking, if you use OneDrive with an account provided by your company or your school, you can call it “OneDrive for Business”.
Cloud apps: Dropbox
If you have ever needed to store something in the cloud you will already know Dropbox, since it is a reference service.
Dropbox allows you, as a user, to store and synchronize files online. You can also share them with other users and technological devices such as tablets or smartphones. There are paid and free versions that allow you different options you can work with.
Its mobile version is available for Android, Windows Phone, Blackberry and Apple. Currently, it has more than 500 million registered users. That makes it a pretty big community.
Cloud apps: Salesforce
Here comes a set of tools suitable for sales or marketing company staff.
With Salesforce you will track your clients, potential customers and possible contracts more easily. Thanks to this, you can increase the loyalty and satisfaction of the customer. In fact, thanks to the Salesforce features, you can anticipate their wishes by monitoring their previous behaviors.
Cloud apps: Spotify
Regarding cloud applications aimed at companies, there is nothing better than Spotify. It entertains and calms down users while they enjoy their activities and consequent productivity.
Do you like music? Who does not? Well, here you have one of the largest online music collections around the world. There is no need to download it and occupy space. It is right there, in the cloud, waiting for you to put on your headphones and enjoy life and work to the rhythm of Queen, Power trip or The Strokes.
Its premium version, without advertising, costs some money. But if you do not care too much about ads, like on the radio, you can obtain Spotify for free.
Cloud apps: Evernote
Evernote is neither more nor less than a computer application whose purpose is organizing your life and your personal information through note files.
There are different versions for several operating systems and also a network version. It is suitable for Mac, Windows, Android, Iphone, Blackberry…
As if by cloud magic, all those notes, pictures, documents, audios, web pages that you have saved in Evernote can be synchronized and they do so automatically in any of the other platforms where you use it.
Cloud apps: G Suite
G Suite (formerly called Google Apps) is a service that provides several Google tools, but with a customized name, for the client.
It is made up of, among other features, several web applications that recall traditional office tools: Gmail, Hangouts, Calendar, Drive, Docs, Sheets, Slides, Groups, News, Play, Sites and Vault.
Currently, G Suite (we do not know when the name will be changed again, as Prince did in the good old days) is free for 30 days and then its price goes up every month and every year.
Cloud apps: LinkedIn
LinkedIn is a social network, but nothing like Facebook or Instagram: it is aimed at finding jobs. It is useful for all types of business, for workers and companies.
Yes, it is true that it is based on a user profile, similarly to the rest of social networks, but its purpose is for you to show your work experience and your great skills as a professional, so that the web gets you in contact with millions of companies or employees.
It was founded in December 2002 by Reid Hoffman, Allen Blue, Konstantin Guericke, Eric Ly and Jean-Luc Vaillant and in March 2013 it already had more than 200 million registered users.
By the way, now that we are talking about the most useful things for a company, how about spending some time to check out the latest in monitoring? Do you know Pandora FMS? Well, Pandora FMS is a flexible monitoring system, capable of monitoring devices, infrastructures, applications, services and business processes.
Still want to know more about system monitoring? Luckily, you are at the right place to know more. In this blog, there are dozens of articles that can get you in this exciting world. Here is a link to our home page: https://pandorafms.com/blog/
You can even send us any questions you may have about Pandora FMS. Do it in a very simple way, thanks to the contact form which is located at the following address: https://pandorafms.com/contact/
Alternativa a Datadog: historia, comparativa y casos de uso
¿Conocéis el software Datadog? Datadog es también el nombre de la empresa que lo produce, y aquí lo traemos en una comparativa con Pandora FMS. De entrada os decimos que Datadog en realidad es un Software como Servicio (SaaS, en inglés), mientras que Pandora FMS es tanto un programa autónomo como un servicio. ¿Queréis saber más sobre la alternativa a Datadog? ¡Venid y leed a continuación!
La alternativa a Datadog
La alternativa a Datadog es, como era de esperar, Pandora FMS, un software que lleva acumulando experiencia desde 2004. Ambos software combinan tanto soluciones libres como privativas, si bien es cierto que Datadog se decidió a radicarse solamente en la nube para centralizar sus operaciones y adaptarse a la manera de trabajar de los Estados Unidos. Por ello, colocan en segundo plano el soporte y auguran una curva de aprendizaje de entre una a dos semanas.
Como cada software de monitorización llama de manera diferente a sus componentes, utilizaremos el glosario de Pandora FMS, que es más extenso debido al mayor tiempo de presencia en el mercado; el glosario de Datadog está en este enlace.
Software libre y software privativo
Mientras que Pandora FMS es de código abierto y es necesario como base para la versión Enterprise, Datadog es privativo en su núcleo, el cual se ejecuta en servidores de Amazon Web Services® (AWS). Pandora FMS está en AWS desde marzo de 2016 con una Imágen de Máquina Amazon (AMI), así que podremos instalar nuestro servidor en la nube sin ningún problema. Ambos desarrollan para GNU/Linux, Windows (Datadog para Windows 7 en adelante) y Mac OS X. Datadog se basa en el desarrollo agile o sistema ágil y Pandora FMS en la Integración continua de software y la Liberación Continua de Software desde la versión 7.0 NG.
La alternativa a Datadog ofrece un esquema de alta disponibilidad; en la siguiente gráfica, a grandes rasgos, os dibujamos la arquitectura de alta disponibilidad de Pandora FMS:
Datadog high level architecture
Pasemos ahora a explicar componente por componente.
Agente Software (A.S.)
Un tema delicado para Datadog fue el tener un A.S. v5 de código abierto basado solo en lenguaje Python; después pasaron a v6, también en código abierto, basado en lenguaje Go y algo de Python. Curiosamente tienen incrustado un servidor web que solo acepta conexiones locales en el puerto 5001 (en Windows de 32 bits esta característica no está incluida) y observamos tutoriales para revertir o pasar de v6 a v5.
Logo de Ansible
Por otro lado la alternativa a Datadog, Pandora FMS, ofrece versiones perl para monitorización de dispositivos Unix / Linux sin necesidad de instalar paquetes adicionales. En entornos Windows el Agente Software está escrito en C y compilado, por lo que tampoco son necesarios paquetes adicionales. Además, Pandora FMS dispone de un sistema de auto-actualización de agentes desde la consola.
La alternativa a Datadog propone Ansible y Puppet para la instalación de A.S., así como la posibilidad de desplegar agentes utilizando la funcionalidad Active Directory de la versión Enterprise, siendo mucho más cómodo para las empresas que utilicen estos servicios. Esto servirá para desplegar muchas otras aplicaciones. Datadog está pensado para ir de computadora o dispositivo, de uno en uno (cada agente software con su consola web), aunque en el caso de Docker (desde 2015) el panorama es otro muy automatizado. El 18 de octubre de 2018 presentaron el Datadog Cluster Agent que permite a partir de 20 mil pods, lo cual conlleva una disminución en la carga de trabajo de los servidores API. Todo esto comparado con Pandora FMS cae en la sección de monitorización distribuida con varios servidores (en este enlace también os presentamos todas las distintas combinaciones posibles).
Servidores API
Ambas aplicaciones pueden conectar sus A.S. por medio de API pero los A.S. de la alternativa a Datadog, Pandora FMS, se conectan utilizando Tentacle como opción primaria, aceptando entregas por FTP o SSH; en este caso, los A.S no usan la API, pero está accesible para ser consultada por quien considere oportuno el administrador (plugins, scripts, integraciones, etc.).
Ante un fallo de comunicación, Datadog perdería la conexión y, con ello, los datos. Pandora FMS por el contrario, al enviar la información en ficheros XML, no perdería los datos ya que los guarda hasta que pueda enviarlos. En cuanto la conexión se restablece se envían, respetando las marcas de tiempo.
Como todo SaaS, Datadog tiene sus límites máximos en número de conexiones API y cobros adicionales en determinadas cantidades.
Destaca Datadog su apoyo a terceros, y que es capaz de recibir datos directos desde un agente statsd que envía por UDP (obvio, sin cifrado de datos y sin confirmación ni verificación de entrega) sin representar mayor carga al dispositivo monitorizado. Sin embargo, Datadog lo incorpora -esto es lo bueno del software libre- a sus propios A.S. -los llama DogStatsD– para permitir el etiquetado.
Etiquetado
Datadog emplea cuatro etiquetas reservadas (etiquetas de sistema) llamadas host, device, service y source. Pensamos que Datadog parte de un escenario normalizado o standard (en dos pantallas tipo de gráficas llamadas TimeBoards y ScreenBoards y que se pueden compartir por URLs públicos y en formato JSON) y que a partir de allí cada usuario comience sus personalizaciones hasta el límite especificado.
Existe una versión gratuita hasta cinco dispositivos y registro de datos con un máximo de 24 horas sin alerta alguna; Pandora FMS en su versión OpenSource es completamente libre, gratuita, sin límite en cantidad de dispositivos y sin ataduras (excepto si nos alojamos en AWS, como explicamos previamente).
Complementos (plugins) de la alternativa a Datadog
Contamos 260 (Datadog las llama Integraciones), tanto internas como externas. Podemos mencionar SNMP (interno) que permite crear nuestros propios MIB con ayuda de Python (pysnmp) y para controlar nuestro código fuente almacenado en GitHub con un hook web (en el mismo estilo de Jenkins). La alternativa a Datadog, Pandora FMS, cuenta con 530 plugins que son totalmente libres y 158 en la versión Enterprise para un total de 688 al finalizar noviembre de 2018; sin contar con los que cada usuario ha diseñado para su entorno de manera específica. La simplicidad del desarrollo de plugins en Pandora FMS es uno de sus puntos fuertes.
Perro guardián
Watchdog observa patrones y tendencias en las métricas de la aplicación, como tasa de solicitud, tasa de error y latencia, y comportamiento inesperado. Watchdog evalúa todos los servicios y recursos sin necesidad de configurar un monitor para cada servicio. Por supuesto, necesita de cierta cantidad de tiempo para recabar información. Es el equivalente al Prediction Server en Pandora FMS disponible desde 2008.
Alertas
Tanto en Pandora FMS como en Datadog las podemos definir vía consola, pero en Datadog hay soluciones de terceros tales como Barkdog (Ruby Gem), Dogpush (YAML) o datadog_monitor.
¿Quieres conocer mejor la alternativa a Datadog? ¿Necesitas monitorizar un gran número de dispositivos? Entra aquí para conocer más en profundidad Pandora FMS Enterprise: https://pandorafms.com/es
Solicita ya una demo gratuita para más de 100 dispositivos y comienza a experimentar la flexibilidad total en la monitorización: https://pandorafms.com/es/demo-gratuita
Do you want to know more about Pandora FMS?
The total monitoring solution for full observability
Contact our sales team, ask for a quote or solve all of your doubts about our licenses.
We can see them on the streets of many cities. They are an ecological and healthy alternative to other means of transport and are becoming more and more fashionable. Haven’t you tried them yet?
Bike sharing is quite trendy. At a time when government teams in big cities are increasingly concerned about environmental issues, bicycles are presented as an ecological alternative and their shared use as a flexible, economical and user-friendly modality. What if we get to know them a little better and then discover what monitoring has to do with all this?
Bike Sharing. How does it work?
It’s not just a way of talking. Bike sharing are a reality in more and more cities, protected by the desire to achieve a healthier life and to have a simple, cheap and ecological means of transport, ideal for short journeys. But how do they work? How much do they cost? Where do they come from? They’re a few questions! Let’s start with the answers.
– Where do they come from?
Although they are now experiencing their biggest boom, bike sharing has been used in some countries for a long time.
Already in 1964 a pilot program was launched in Amsterdam, with not too much fortune: most bicycles ended up being thrown into the canals or stolen.
Years later, in 1974, in the city of La Rochelle (France) began the first successful municipal system of bike sharing, which still survives to this day.
From these experiences, multiple cities, especially in central and northern Europe, established their own shared bicycle programs, spreading the practice around the world at the beginning of the 21st century, which brought hand in hand the creation of various private companies that also began to provide this type of service.
– How do they work?
Bike sharing services are quite heterogeneous, and their functioning depends on the city in which they are established, on whether they are managed by public or private companies or by other factors, such as parking spaces or whether bicycles are conventional or electric.
For example, in a general way, a distinction can be made between bicycles that can be found in fixed car parks distributed throughout the city and those that operate without fixed bases (a more recent modality), so that they are parked at the place where the last user who used them completed their journey (within certain areas set aside for this purpose).
Similarly, there are also different forms of use and payment.
For example, we can find bicycles that use magnetic card systems, or others that are reserved, paid for and unlocked via mobile phone. Their use is usually temporary, almost always for hours or minutes.
– How much do they cost?
As you can imagine, the answer to this question varies depending on the city we are in. For example, in some cities, you can buy monthly bonds that work as a “flat rate” or lower the price of temporary use. We could say that, in cities like Madrid, the price is approximately 3 euros/hour, as we say, that can vary quite a lot depending on the city and the mode of payment and use.
Bike sharing and monitoring
And now you will ask yourselves, what does all this have to do with monitoring? Well, even if it doesn’t seem like it, a lot, and nowadays everything has to do with technology.
The sharpest readers will have already detected the most obvious relationships. A shared bicycle service involves keeping a large number of bicycles on the street, exposed to loss or theft. For this reason, shared bicycles have for some time now often incorporated technologies such as GPS, which are used to avoid this type of incident.
But we’re not just staying here. When it comes to managing hundreds or thousands of bicycles and dozens of stations in an environment of several square kilometres, things get complicated, and all the help that technology can provide seems little.
For example, parking lots often have access terminals that allow users to interact with the bicycle lending system. In addition, the fixed devices (stations or pedestals) that store bicycles also often have technological systems that serve to anchor them, know the number of bicycles available or recharge them in the case of electric bicycles, among other functions.
In addition, many of the shared bicycle services offer their users information about available bicycles, station locations and all kinds of service-related aspects via websites or apps.
And if that’s not enough, companies that manage shared bicycle services also often have the usual equipment that any service company usually uses, and sometimes involve a negligible computer park.
As you can see, something apparently as simple as a shared bicycle service can involve a considerable amount of technology. However, as everyone who uses technology knows, it is not infallible; it is exposed to failures or drops in performance. And this is where monitoring comes into play.
Monitoring systems are responsible for monitoring technology (hardware, networks and communications, or applications, for example) in order to analyse its operation and performance, and to detect and warn about possible errors.
When it comes to monitoring the technology of a shared bicycle service we also enter a specific field of monitoring, what we know as IoT (Internet of Things) monitoring.
One of the things we know about IoT monitoring is that the flexibility of the monitoring systems is something to bear in mind. And if we add to this the variety of devices and services that must be monitored in a shared bicycle service, this leads us directly to Pandora FMS.
Since Pandora FMS is a flexible monitoring software, capable of monitoring devices, infrastructures, applications, services and business processes.
And now you might have questions. Do you have specific needs and want to know exactly what Pandora FMS can monitor? This is easy, you only have to send a message consulting all your doubts through the contact form that can be found at the following address: https://pandorafms.com/contact/
Before doing it and if you want to know more about Pandora FMS IoT monitoring, you can have a look at this link: https://pandorafms.com/iot-monitoring/
Or you can check our main page or get to know some of the clients that already trust Pandora FMS, among which there are multinationals and public institutions from all over the world.
Don’t hesitate to contact our Pandora FMS team and send all your questions, they’ll be happy to help you!
Who is exactly Linus Torvalds? Get to know the man behind the “x”
Few human beings enjoy the privilege of having given their name to an operating system (at least one that is known beyond the room of its creator). What about meeting one of them? His name is Linus Torvalds.
The creator of the Linux kernel is considered a genius and an “ogre” almost equally. However, very few people have had a similar impact on the technological world, and his recent public announcement about temporarily retiring from the Linux leadership to improve his way to deal with others made some people shed a couple of tears of emotion (more or less).
In this article we are going to get a little closer to a figure that might be unknown to the general public but it is very familiar for all of those who are professionally related to computer science. And to do it, nothing better than getting straight to the point…
Who is Linus Torvalds? Linus and Linux
The story of Linus Torvalds is undoubtedly linked to the creation of the GNU/Linux operating system. Although it is likely that Linus’ talent may had found other projects to develop, it is the creation of his operating system what made him famous and made him known by so many people. Let’s take a look at his creation process.
Torvalds was born in 1969 in Finland, within a Swedish-speaking family. His first contact with a computer took place when he was 11 years old, at the moment his grandfather, a renowned statistician and mathematician, asked him for help to use the Commodore he had just bought. The computer virus stung little Linus and then, as they say, the rest is history…
Years later, Linus began his studies in computer science at the University of Helsinki. Soon after, he would devote himself to a project that has reached historical dimensions today.
At that time, Torvalds used a system called Minix, created by Professor Andrew Tenenbaum, but the young student thought it could still be improved, so he started a personal project to develop his own operating system.
According to legend, the first public announcement about GNU/Linux took place through the publication of a Torvalds’ message in the Minix news group, oc.comp.minix, which would read something like the following:
“Do you miss the wonderful days of MINIX-1.1, when men were men and wrote their own drivers? Do you lack interesting projects and you’re dying to challenge an operating system that you can modify at will? Do you find it frustrating that everything works with MINIX? Are you tired of staying up late to get a program to work? So, this letter may be just for you. As I mentioned a month ago, I am working on a free version of a MINIX type system for AT-386 computers. Finally the environment has been improved, it can even be used, and I am eager to release the sources of a more powerful distribution. This is only version 0.02… but so far I have made it suitable for bash, gcc, gnu-make, gnu-se, compress, etc.”
The kernel of the operating system was based on Unix, to work with IBM/PC computers. After having finished his work, on September 17, 1991 he made it available to the public through an FTP server, baptizing it as Freax (which combines free + freak + x), although soon enough the person in charge of managing the server changed this name to Linux, that corresponded with the nickname used by Torvalds. That version, called 0.01, had 10,000 code lines. Soon it would grow much more…
From that moment on, the operating system began to spread and develop all over the world, under the philosophy of free software on which its creator based it, turning his figure into something almost mythological. In addition, and although only 2% of what is currently Linux was developed by him, Torvalds still retains the management direction of the system kernel.
Since then, Torvalds has not stopped receiving recognition, and also being the spotlight of some controversies.
In addition to multiple awards and appointments as a honorary doctor, Torvalds has been recognized as one of the “people of the Century” by Time magazine, he is also part of the “Internet Hall of Fame” and has been awarded as “pioneer” by the IEEE.
But, as we say, the figure of Linus Torvalds has also given rise to much controversy. His direct and “too” sincere character has generated a numerous series of statements over the years, in which he has had no mercy, lashing out against developers and companies from all over the world and even Linux developers themselves were not safe from such statements.
However, Linus surprised the world when, in September 2018, he published a letter in which he announced that he was going to take some time off to “try to fix his own behavior” and publicly apologized.
Whatever the case, the fact is that Linus Torvalds has earned, for years, the reputation of being one of the best developers in the world, and both his work and the philosophy with which he has impregnated his project have been decisive in making GNU/Linux one of the most used and most successful operating systems in history (which is no small feat).
But if you want to go straight to the point, you can also find out what Pandora FMS is and what it can offer you clicking here: https://pandorafms.com/
Or you can also send us any questions you may have about Pandora FMS. You can do this in a very simple way, thanks to the contact form that can be found at the following address: https://pandorafms.com/contact/
Cloud Backup Cost: Things to Keep in Mind Before You Buy
A backup is a set of files that are mirrors or exact images of their originals at any given time. They are generally compressed to save space both in storage and transport. They should not be kept in the same place where they were generated, because many things can go wrong and leave us unprotected. Therefore, today we are going to consider and analyse the cloud backup cost: join us in this vital task for any company (or person).
Pandora FMS and its tireless work
In this blog we have presented the basic concepts of what is a backup and its monitoring with Pandora FMS; it is never too much to read it from time to time so as not to lose our way of working.
Pandora FMS is very useful monitoring software, with infinity of uses but even Pandora FMS must have its backups to guarantee its own operation and in this other excellent article we show you how to do it.
Pandora FMS is also compatible -and works side by side- with other backup solutions, such as Bacula or Veritas Backuo Exec; now, where can we keep all this data? And most importantly, what is the cloud backup cost? In the case of companies – legal reasons, such as the Sarbanes-Oxley Act in the U.S. – we must use some service that guards them out of our hands. Some countries that use electronic invoices require by law that data be publicly available for a minimum amount of time, usually between five and ten years: a set of web servers with their own replicated databases are themselves a cloud storage! Considering all this, prepare yourselves because our approach will be anything but orthodox. Let’s see.
Cloud backup cost?
If we are administrators of local area networks, this will be the question that our boss or immediate boss will always ask us. It is a delicate balance between supporting the minimum necessary for the company, the minimum necessary required by law and the minimum necessary considered by our users (these three factors can often coincide in everything, half, something or nothing).
Cost of cloud backup: service providers
Incidentally, the cloud as such does not exist: this only means secure, powerful and remote servers with large storage capacity and Internet access with very fast connections, at least 300 mbps. “Online backup” and “cloud backup” mean exactly the same thing, only one word is buzzword and the other is not. Most services also allow you to view and download your files from a web browser or mobile device, but we should not confuse the storage and editing of shared documents online (Microsoft OneDrive, Google Drive, Apple iCloud Drive, Dropbox, etc.) with the job of safeguarding our backups. These services have drawbacks: privacy risk and when we delete a document is deleted from each of the synchronized devices, totally opposite to what we want to do!
The Cost of Privacy
Compressing saves storage and transport space. Why not encrypt at once? This would somehow guarantee our privacy, but when it comes to checking whether externally stored files are legible, it can delay and even cost more money and time to check. That’s why we present the first element of our formula to calculate the cost of cloud backup: let’s add one percent, as we will use files that contain hashes of each of the files and of which we will have a local copy to compare them before starting the checks. Some services offer version control over files at no additional cost, usually up to a dozen changes to the same file: we could use this to carry a catalogue of hashes of our backups that are encrypted and/or compressed and/or not. In any case, those with whom we contract data hosting will also encrypt our files and to transmit them will also use an encryption protocol, which adds extra protection to our privacy.
Carrying our own catalogues is also practical, given that the cloud company does not offer a specific file search service in particular. Some others, such as Acronis True Image Review, perform data verification using blockchain, which reaffirms that the only constant is change.
Note: if we decide to encrypt we will have to vary and keep the passwords used very well, so we must have a software capable of dealing with it, apart from the time to learn to use it, maintain it and monitor it. Encrypting always requires more energy consumption: add this to the cloud backup cost.
Megabytes, gigabytes or terabytes?
Companies offer multi-year contracts (although there are companies that don’t return money if you don’t want to continue with the service), this will result in a cheaper cost per megabyte. Yes, with so many years working with computers we still use the phrase “cost per megabyte” but let’s face it, at the moment we must talk about the cost per terabyte. This is already a truism: they will charge us for storage space… but they can also put a damper on the number of devices we can use to “upload”. What is the reason for this commercial behaviour?
The cost of an Internet connection
Yes, we must add to the cost the time and energy to transport the information, and if we have several branches in different geographical areas our hosting provider will be forced to offer a very complete service for our money. That‘s why they limit the number of devices that can be connected.
Related to this, for the initial backup we will have to investigate if they receive external storage devices by messaging (off-line backup, in English language) in order to safeguard our connection to Internet; then we will continue backing up in an incremental way. Of course, vice versa also works: if there is a lot of information that we need to restore, we should ask if they have tracking service and package security to ensure that we get our hands on the precious disks or devices. This option, generally, means an extra cost for us and even some services offer with these plans the complete cloning of fixed disks with their own catalogue of files, in case we need to recover specific files or directories instead of the entire disk.
By agents or by protocols
Finally, we must consider whether we can “upload” our backups through widely known protocols (FTP for example) or whether on the contrary we should install software or agents on a computer so that it works with local backups or -if it allows- local network drives. The hidden cost is the work of implementing them (some allow configuring the data upload speed; if not, then we must configure the speed of our router for that machine in charge of “uploading” the data), monitor and take care of any security breach. We can also ask if the storage has any APIs available to program our own online backup agents.
Advantages and disadvantages of cloud backup
Virtual machines or droplets
It’s not a far-fetched option: we can now rent from six euros a month 25 gigabytes for a virtual machine that includes its own automatic backups in the cloud. The setback would be that it is just another machine to manage -and monitor- and we must check how much data we can move on those machines per time period (there is always a traffic limit, usually on a monthly basis).
In Pandora FMS we can help you in any doubt about backup monitoring, we are your first option, always contact us!
What is cache memory? You’ve probably heard of it on more than one occasion, usually abbreviated as “cache”. You may even have heard about whether or not to delete it periodically.
In this article we won’t go into technical details, but we will try to explain briefly what cache memory is and what it’s used for, so you can get a general idea of what this component of our computers means. What is cache memory? Shall we start?
What is cache memory?
The first thing we should say is that there is no single cache and no single type of cache. Although they can be divided into several different types, probably the simplest and most enlightening thing is to distinguish between hardware cache and software cache.
The hardware cache or processor cache is a memory that is inside the microprocessor itself and is a physical component of it. It is organized in different levels according to its proximity to the processor core (known as L1, L2 and L3 levels) and each of them is faster or slower depending on its proximity to the processor. To give you an idea, the L1 and L2 levels usually have a very small capacity, just a few KB (much less than the capacities of RAM or the hard disk). In the case of cache memory, this is justified: the important thing is not the capacity, but the speed
Because, precisely, the utility of the processor’s cache memory is to serve as a very fast access memory – even faster than RAM memory – so that the processor can use certain data (the most commonly used) at the maximum possible speed. We’ll talk a little more about it later.
In addition, there are other types of cache, such as the GPU cache, which also makes it easier to operate. The important thing is to keep the concept that they are hardware components that improve the speed of operation of the main components they serve.
Software cache, also known as application or browser cache, is not a hardware component, but a set of temporary files that are stored on the hard disk
Probably more “popular” than hardware cache, although not a physical component, the concept of software cache also focuses on increasing speed.
In this way, the software cache will store certain data on the computer so that applications can access it quickly, without having to access slower sources such as an Internet connection, for example. But what is cache memory?
What are these two types of cache memory for?
The main function of the different caches is to save time (or increase speed if you prefer).
When it comes to hardware cache, the mechanism is as follows: when the processor first accesses data, it makes a copy into the cache. If you need to access the same data again, the first thing you do is to check if there is a copy in the cache, which is the one you have closest to and the one you access and in which you write with a higher speed. If it doesn’t find it in the cache, it is when it looks for it in the RAM memory or in the hard disk (more “distant” memories, big and slow).
As we said, it’s a question of speed. Cache memory usually stores the most frequently used data, so having it so close to you; the processor can run at a higher speed. Without cache, access to certain recurring data would be slower, and your computer’s performance would suffer.
Software cache shares a similar philosophy.
We can see a very clear example with the cache of browsers. When we access a web page, the browser we are using contacts, via the Internet, the web page server, which sends “back” the content of the page so that we can download it to our computer and view it.
The content of web pages can sometimes be cumbersome and slow loading. Think, for example, of those that contain large images. Therefore, the browser’s cache stores some of its parts. Thus, if we access the same page again, we will directly access the content stored in the software cache (in the form of temporary files) without having to download it again via the Internet, which will increase the speed of browsing.
Finally…
As you can see, when we talk about cache memory we may be doing it about different things, although its philosophy is common; it is about both physical (hardware) and logical (software) components that are used to store temporary data that can be accessed quickly in order to improve the speed and performance of our equipment and applications.
And now that we have a little clearer what cache is and what it’s for, how about spending a few minutes to know Pandora FMS?
Pandora FMS is a flexible monitoring software, capable of monitoring devices, infrastructures, applications, services and business processes.
Or you can also send us any query you have about Pandora FMS. Do it in a very simple way, thanks to the contact form that can be found at the following address:
As far as we know, computer programming seems to be a field entirely occupied by men. In fact, if we go to the evidence and the data is quite embarrassing: they tell us of a large majority of men working in this job after finishing their studies and of the few women programmers who, despite having studied it, finally perform it.
Of course, different groups, institutions and companies interested in gender parity and diversity struggle to promote the insertion of women in this type of work. A job that, as we know, is the future. Since, we need programmers.
The fact that there are currently few women programmers, or not enough for the perfect gender mix, does not mean that throughout history there have not been women programmers. In fact, we are going to see how they have had an essential participation in the events in the world of programming.
Women programmers: Margaret Hamilton
Computer scientist, mathematician, and systems engineer born in the United States in 1936.
Margaret became the software engineering director of the project that carried out the writing of the Apollo Computer Guide (AGC) code. This code was created in the MIT Instrumentation Laboratory for that little Apollo 11 trip. As you know, Apollo 11 was that manned space mission that had the purpose of human beings walking on the Moon.
“When I first arrived, no one knew what we were doing. It was like the Wild West. There were no rules. We learned everything ourselves,” Hamilton commented. Practically all the programmers had to create everything from scratch. Even so, the tenacity and effort were amply rewarded: we reached the Moon and a new type of industry was created with Hamilton at the forefront as an expert in systems programming.
Women programmers: Grace Hopper
Grace Murray Hopper, born in 1902 in the United States, was a computer scientist and U.S. military admiral.
Among her achievements, being a pioneer in the creation of accessible programming languages.
From the beginning, as a misunderstood visionary, Grace saw the need for computer science to spread in non-scientific circles, and that simpler programming languages would be needed for this. Her key idea was simple (it may seem to us now) but revealing and took many years to be accepted. However, thanks to her struggle and perseverance, she created a programming medium based on words rather than numbers. It is known as COBOL language (Co mmon B usiness O rientated L anguage). If you’ve heard about David Letterman’s Late Night program, you can find Grace defining herself as “Software Queen”.
Women programmers: ENIAC girls
During World War II, artillerymen aimed their weapons using firing charts; these charts included the trajectories followed by the missiles. Normally each table included about three thousand trajectories, and each trajectory required about 750 calculations. The calculations were made on their own by women with studies in mathematics.
This military purpose had the ENIAC computer and the work of programming the ENIAC was assigned to six women. These girls ended up creating the basics of computer programming, developing the first library of routines and the first software applications. However, they were not recognized at the time. Betty Snyder Holberton (1917-2001), Betty Jean Jennings Bartik (1924-2011), Ruth Lichterman Teitelbaum (1924-1986), Kathleen McNulty Mauchly Antonelli (1921-2006), Frances Bilas Spence (1922-2012), Marlyn Wescoff Meltzer (1922-2008).
Women programmers: Ada Lovelace
Perhaps you know more about his father, the romantic poet Lord Byron. But the daughter of the Englishman was not left behind at all, she was an eminent Victorian mathematician.
Charles Babbage, with whom he worked hand in hand on his calculating machines, spoke of her as the “charming of numbers”.
Needless to say, although at the time there were not many women studying science, Lovelace stood out in the field, and not only that, she is considered the founder of computer science and also the first computer programmer in history. You can read more about Ada Lovelace here.
Thanks to the British Museum of Science we know that Ada established what we might consider modern computing, and that her notes on the description of machines contain the first estimated algorithms designed for the operation of machines. She also hypothesized on the idea of similar devices for music or the creation of graphics.
By the way, talking about programmers and computers, how about talking about the latest in monitoring? Do you know Pandora FMS? Pandora is a flexible monitoring system, capable of monitoring devices, infrastructures, applications, services and business processes.
Do you still want to know more about system monitoring? Luckily, you’re in the right place to learn more. In this blog there are dozens of articles that can introduce you to this exciting world. You can find a link to our homepage here: https://pandorafms.com/blog/
VDI Monitoring: All you need to know to face the Challenge
The decision to introduce Virtual Desktop Infrastructure (VDI) technology is not an easy one. One of the most important aspects to consider is precisely the administration and monitoring of VDI.
From the point of view of the monitoring analyst the approach to this issue is direct: if VDI is part of the platform and we have users who access applications from a virtual desktop, it is clear that this technology must be monitored.
Now, how often are we going to come across a platform that includes VDI?
In reality, the prevalence of VDI technology is an issue that has provoked debate; on the one hand, less optimistic analysts have indicated a slowing of technology adoption rates, and on the other hand, there are those more optimistic who speak of little adoption but a high level of satisfaction.
However, just over a year ago Allied Market Research staff published a study estimating that cloud-based VDI will experience an annual increase in its market value to over ten billion dollars by 2023.
Another interesting point of this report is that it indicates that the adoption of VDI will be evident not only in large companies, but predicts a significant upturn in the sector of small and medium enterprises.
In this scenario it is interesting to evaluate the challenges that VDI implies for monitoring, so in order to approach the subject we propose you first to evaluate its architecture and determine the problems that we will have to face.
VDI architecture and associated problems
Let’s use as reference the general architecture presented in the following image:
The architecture of a VDI platform starts from a first level where we find a wide variety of devices from where users can establish communication with the virtual machine that contains the appropriate environment for each of them.
The variety of devices, which range from workstations to smart devices such as phones and tablets, generate one of the first challenges: operational problems.
We can have users opening support cases indicating that:
Once connected the user interface does not work properly.
Being in a remote location they cannot access the same applications that are connected in their office.
They are unable to print using the locally available printer, etc.
Then, at the communications level, we can also find different schemes, from a local Ethernet network located in the same building as the data centre where the elements with which VDI is implemented are found, to the Internet services of a hotel.
This point includes all the active elements that make up the network; we refer to switches, routers and firewalls.
This brings us to the level of VDI devices. Which devices and what their respective targets are depends on each manufacturer; however, we can mention three functions that usually appear regularly:
Gateways: Control secure access to virtual machines that serve as virtualized desktops. This control may vary in scope depending on whether the communication comes from a secure or unsecured network.
Brokers: They control which virtual machine a certain user must access.
Connection Servers: Servers whose hypervisors allow the creation of virtual desktops.
At this point we may come across the famous Connectivity Problems in which users often report things like that:
They can’t connect.
Once connected from a remote location they don’t get the same level of performance as when they connect from their office.
The keyword they use regularly doesn’t work if they are connected remotely.
Depending on the location where they connect, they do not have access to the same systems or the same data, etc.
Finally we can consider a level of access to corporate resources, which involves all services and equipment access to applications and data such as servers, storage devices, active directory, etc.
Related to these last levels we have the possible infrastructure problems, which are related to the fair provisioning of resources such as CPU, memory and storage.
Here it is interesting to get that fair value for each virtual machine, since a deficit of resources can go directly against the performance observed by end users and an over dimensioning can involve waste of resources and the consequent economic problem.
VDI Monitoring: Objectives
Defining a monitoring platform that supports the resolution of the three types of problems mentioned (Operatively, Connectivity and Infrastructure) must be based on:
Providing the necessary visibility within VDI’s own platform (Hypervisor, virtual machines, gateways, brokers, etc.).
Providing visibility of the entire platform (networks, communications links, routers, servers and applications).
Assuring us these levels of visibility the idea is to generate the monitoring processes from two approaches:
On the one hand we can develop a vertical vision in which the main challenge is that, given a failure report, the monitoring platform facilitates the discernment of whether it is a problem of the VDI infrastructure or a problem of the general platform.
On the other hand, a horizontal vision that should support resource adjustment and capacity planning processes.
VDI Monitoring: Tools
The VDI market offers a considerable range of products aimed at the administration and monitoring of this type of platform. We can classify them into three groups:
Tools from VDI solution producers: Companies such as Citrix and VMware have management and monitoring products that accompany their products.
These management and monitoring products are usually based on a licensing scheme that distinguishes between small and larger installations. Their simpler versions tend to be more administration oriented than monitoring oriented.
However, for medium to large installations, additional licenses are offered with which monitoring elements such as Application Monitoring and Workload and Time Behaviour Monitoring are provided.
Another option is the tools specially designed to manage and monitor VDI platforms.
These tools in general present an offer that allows the development of a hybrid structure; with data collection through elements present in the user’s platform, having in the cloud the consolidation of said data and the possibility of evaluating it and carrying out the analysis.
Of course, in terms of licensing and service levels offered the options are very diverse, both in the capacity they deliver and in the costs they involve.
We can mention tools such as ControlUp, ExtraHop or Goliath, as a guide to introduce you into the subject.
A third option is the general purpose monitoring tools.
An organization that already has Pandora FMS, for example, when undertaking a VDI project, will be able to face the challenge of VDI monitoring as an extension of the competences of its monitoring platform.
For example, the monitoring developed in the area of applications or user experience should consider that there is a whole new structure through which certain users will access the application.
Therefore, the parameters that are measured in terms of evaluating the performance of the platform should be extended to include, among others, variables such as:
Response time on the VDI connection (including connection and authentication).
Network response time for VDI connections.
Application response time for VDI connections.
It is also interesting to think about the natural extension of the capacities already developed in terms of data centre monitoring, where the management and administration of computer resources is fundamental.
The reader interested in Data Centre Monitoring will find this article published in this blog interesting.
In short, the basis for successful VDI monitoring is based on:
On the one hand, in the ability to monitor any system provided by Pandora FMS architecture, and all the capabilities for monitoring virtualization platforms, our data centre, applications, and so on.
On the other hand, knowledge about the chosen VDI architecture is required, which will allow us to understand the flow of transactions, key operational elements, etc., in order to adjust the monitoring platform.
With these two elements and considering the type of problems that the VDI platform can generate, it is possible to cover the VDI infrastructure in an efficient way through Pandora FMS.
Of course, we invite you to request information about how Pandora FMS can support you in the implementation of a VDI monitoring platform, in this link.
What is WMI? A new German car brand, poised to break the pockets of wealthy parents in their mid-fifties crisis?
The split of one of the brothers of Warner Brothers for a fight in the last family meal?
Something related to home automation and that effort of technology to make our houses as computerized as they are not very homely?
A computer move that we had not heard of until today or if we had done it was to nod without having a clue what it really is about? Well, rather the latter!
For this reason, and because we like to explore the vast fields of knowledge, we are going to try an approach to the transcendental question: What is WMI? There are people out there who do not have the urgent need to master the concept, taxi drivers or taxidermists for example, but there are other brave people who will live much better with the knowledge of these skills. Today goes for them: What is WMI?
WMI (Windows Management Instrumentation) is a technological invention of Microsoft, whose purpose is to take care of the different operational environments of Windows.
The Windows Management Toolkit (WMI) consists of a set of extensions of Windows Driver Model, which provide an operating system interface so that its components give us information and different types of notifications.
WMI is Microsoft’s implementation of web-based business management standards (WBEM), the common information model (CIM) and the Distributed Management Task Force (DMTF).
WMI allows script languages (such as VBScript or Windows PowerShell) to manage Microsoft Windows personal computers and servers, both locally and remotely. WMI comes pre-installed on Windows 2000 and Microsoft’s newest operating systems. It is also available as a download for Windows NT, Windows 95 and Windows 98.
Microsoft, also provides a command line interface for WMI called Windows Management Instrumentation Command-line (WMIC).
What can we do about WMI?
Now that we’ve assimilated and internalized what WMI is, let’s go with a few easy things we can use it for.
As we have mentioned, through WMI it will be easy to manage both immediate and remote computers, being able to program processes that will be executed in indicated and chosen moments; to initiate it and to begin to operate in a remote computer; also to restart them from a distance, if it is necessary; to obtain lists of the applications that are installed in our computer, the rest of local computers and also the remote ones; to inform us of the registers of events of Windows, in the local computers as in the remote ones…
You need to know that since WMI comes with a set of ready-to-use automation interfaces, all administration functions supported by a WMI provider and its set of classes are supported by scripts for immediate and free use. Beyond WMI class design and vendor development, Microsoft’s development and testing teams are not required to create, validate, and test a scripting model, since it is, in fact, available in WMI.
In fact, nowadays you can use something more advanced…
Using monitoring software so powerful, it works for 1 computer or 10,000.
And you can use it for free. Shall I tell you how?
Purposes of WMI
We can consider that the purpose of WMI is to define a set of specifications independent of the environment, which allow sharing management information between the same management applications.
WMI prescribes enterprise management standards and related technologies for Windows that work with existing management standards. Like the Desktop Management Interface (DMI) and SNMP, WMI complements these standards by providing a uniform model. This model represents the environment through which management data from any source can be accessed in a common way.
Let’s try to simplify it. WMI operates, more or less, as a database would do; it offers you a large and varied information, which will be most useful for monitoring systems that are based on Windows.
Imagine yourself in front of an instrument control panel. You have all the necessary access to its parts and you can be observing the levels that match the most personal variables of a computer running in a Microsoft Windows environment. WMI uses its language to give us representative samples of the functioning of systems, applications, networks, different devices, etc..
If you are interested in WMI, you will also be interested in…
By the way do you know who does it like no one else and is a champion when it comes to monitoring? Pandora FMS, a flexible monitoring system, capable of monitoring devices, infrastructures, applications, services and business processes.
For example, in the following video you can see how to create and configure a WMI module remotely in Pandora FMS:
Technology never ceases to amaze us. Sometimes, it even seems capable of performing magic actions.
In the near future the astonishment will not stop increasing. Everyone is talking about Big Data, IoT, robotics or artificial intelligence, but there are other very practical technologies that could have an impact on our lives in no time.
Since the beginnings of the Internet, connections have not stopped improving, driven by ever-increasing demand. The world is hungry for more data, more connection, more intelligence, more speed. What happens is that current technologies have their limits, and therefore new solutions are knocking strongly at the door from time to time.
Today we live in a Wifi world. Some very popular terminals, such as mobile phones, as well as many other devices, use today’s wireless networks to provide all kinds of services over the Internet. What happens is that even such an effective technology has its limitations.
Lifi (or Light Fidelity) technology is one of the options proposed as a new form of data transmission. But what is lifi?
What is Lifi technology?
The term Lifi was first used as recently as 2011 by engineer Harald Haas during a TED conference.
What is lifi? In short, Lifi technology consists of a data transmission technique that uses visible light and ultraviolet and infrared lights to carry out the communication.
What’s that supposed to mean? Well, the data could be transmitted to any place where these types of light could reach. How is that possible? It’s simpler than it looks.
If we think, for example, of the popular LED lights, it is estimated that these could be turned on and off about 10 billion times per second (something that humans would not be able to perceive). Having this capacity, the “on and off” could be translated into binary language, thus reaching speeds of 10 Gbps.
Some advantages and disadvantages of Lifi technology
Let’s see some of them.
Advantage: its transmission speed would be much higher than that of Wifi transmissions. As already mentioned, it would move in the range of 10 to 20 Gbps, and maybe even more (in some tests it has even reached 224 Gbps).
Disadvantage: light waves are not able to pass through opaque obstacles, such as walls, so they would have range limitations. However, these could be defeated by sensors. In addition, a direct line of sight is not necessary (light can be reflected on the walls), although through this route the transmission speed would drop significantly.
Advantage: Lifi could be used in certain places sensitive to electromagnetic areas, such as airplanes or hospitals, without causing interference.
Disadvantage: light beams do not have a long range (about 5 to 10 meters). However, as in the case of overcoming obstacles, sensors could help increase distances.
Advantage: while the electromagnetic spectrum used by Wifi technology runs the risk of becoming saturated, it does not seem that the visible light spectrum (10,000 times greater) will do so in the short term.
Advantage: although it may seem so, it would not always be necessary for the lights to be on at a level perceptible by the human being. Their intensity could be reduced so that they could continue to operate in a non-visible way.
Advantage: in theory Lifi technology would be quite cheap to implement. It would be enough to incorporate modulators to the lights and to include the necessary receivers in the devices.
Present and future of Lifi technology
Given all these advantages, why hasn’t Lifi technology already been massively implemented?
The truth is that this is a promising technology, but they are still working on it. It is expected that in the coming months the standard will be published and the first associations dedicated to its dissemination will be formed. In addition, as on so many occasions, both technical and economic factors will come into play.
Its advocates claim that it will replace current Wifi technology or, at the very least, live with it by providing service in certain places and circumstances. Its detractors, on the other hand, find great objections to its limited range, which would require the deployment of a large network of sensors.
One of the issues most strongly advocated by Lifi developers is that infrastructure needs would be reduced. Now, whether we use Lifi technology or Wifi, we’ll always have some kind of infrastructure to monitor, don’t you think?
And that’s where Pandora FMS comes into play.
Since Pandora FMS is a flexible monitoring software, capable of monitoring devices, infrastructures, applications, services and business processes.
Commands iwconfig, grep and cut to extract the percentage of the quality of the Wifi signal
Wifi monitoring, power and wireless network range
Although since 1985 the federal government of the United States of America provided the radio bands (frequencies) to be used for our daily use, it was not until 1999 when the brand Wi-Fi® was registered, which means wireless fidelity and in that same year was founded the WECA (Wireless Ethernet Compatibility Alliance).
A bit of history
We may have surprised you when we told you that Wi-Fi® is a registered trademark, but after so many years of massive use there are many ways to write it and Wikipedia picks them all up; however, here we will write it simply as Wifi. The case that concerns us today is Wifi monitoring and as you can see we will leave links throughout the article complementing our indications.
Already in 2005, with the G standard fully established (54 million bits per second in the 2 400 000 000 hertz band), and when the first mobile phones with Wifi connectivity appeared, the word began to appear in dictionaries and since then its ubiquity has been taken for granted. For many years it was faster to connect our mobiles to our wireless networks in homes and offices (including public places such as parks and shopping malls) until the fourth generation standards (Long-Term Evolution, LTE with 4G) arrived for our mobiles, with the small detail that it is still faster and safer to access our documents, applications and data repositories in our offices or homes via Wifi to our local servers, including those of Pandora FMS.
That said, the number of wireless routers has only increased, and for this year with the explosion of the Internet of Things has come an avalanche of new devices to monitor. Now, my reader friend, you may be wondering: What do I care about the intensity of the signal, when moving around a little with my laptop/mobile/tablet/etcetera is enough? The issue goes further in business and industry with desktop computers and other “immobile” artifacts.
Specifications
We cannot start without a firm basis such as public norms, and we will expound it in such a way that it deprives simplicity over formality. As we said, the Federal Communications Commission (yes, the one we see on the labels of our electronic devices) made the 900 Mega Hertz, 2.4 Giga Hertz and 5.8 Giga Hertz frequency bands available for everyday use in 1985.
Federal Communications Commission (FCC) Logo
It is easier to represent them with multiple prefixes (kilo for thousands, mega for millions and giga for billions) than as we placed it at the beginning of the article with a large number of zeros. We did it in a totally didactic way; a Hertz (named after Heinrich Rudolf Hertz, German physicist) indicates the number of repetitions per second of a given physical phenomenon. For electronic devices this concept is used to keep track of the clock that becomes the necessary and indispensable heart for the whole digital world we know to work. These watches are made of quartz and generally vibrate at 32 Kilo Hertz at room temperature, but at extreme temperatures they can accelerate their operation and even stop completely in very particular working conditions as happens with the iPhone®in the presence of helium gas.
In the case of frequency bands, the higher the amount of data to be transmitted, the higher the energy consumption. However, the use of ingenious coding algorithms allows data to be multiplexed and increases efficiency:
In 2000, the 802.11bstandard transmitted at eleven million bits per second (11 Mbps) at 2.4 GHz.
Year 2002 the 802.11astandard transmits at 54 Mbps at 5 GHz.
In 2003 the 802.11gstandard transmits at 54 Mbps at 2.4 GHz: this is still the most widely used standard, as many new models of routers bring compatibility.
In 2006 the 802.11nstandard had a theoretical maximum of 600 Mbps at 2.4 GHz and 5 GHz.
As we explained in a previous article the rules have been advancing, always at higher speed. Remember the clock speed? Well, now the routers have grown in complexity requiring even multi-core processors and fantastic cycles – they’re all complete computers now!
These frequency bands were then divided into channels, MHz or GHz values preset so that each router can transmit without disturbing or interfering with other nearby routers. Unfortunately there are still routers that do not change channel automatically, or in the case of companies the tanks have movement of machinery and trucks that interfere with the signal, among other environmental factors that can affect the power and quality of the Wifi signal.
Wifi Monitoring
With all these good news of higher frequencies and better technologies we can never forget that all this infrastructure is just a section of the network topology and its monitoring. What happens is that we must now collect a new set of data that we will then turn into information. There is a lot of software that can inform the user directly about their WiFi connection, such as NetSpot, WiFi Analyzer, inSSIDer and many more. In our case, the workhorses are Unix or Linux systems and for them one of the software that allows us to see in a “graphic way” through a terminal is wavemon, written by Jan Morgenstern in 2009 and maintained by Gerrit Renker since then. It is found in the Debian and derivative repositories, as well as for CentOS: in the first case we will install it with apt install wavemon and in the second case with yum install wavemon (for any other distribution we will be able to compile by downloading its source code). The only thing left to do is to execute it and press the F8 key for help, which only consists of the advice “don’t panic“, which we still laugh at (geek humour is somewhat difficult to understand and appreciate) and with the F9 key the familiar “About” window.
wavemon: help and window “about”
With the F3 key you can display, for example, the channel and frequency to which the wireless network card is connected, as well as other important values such as the MAC address of the router, for example:
wavemon informs about wireless router: SSD, MAC address, signal strength, channel, frequency and connection type
Pandora FMS: Modules and plugins
Pandora FMS works on the basis of modules and plugins, which are very well explained in an excellent article published by one of our writing colleagues. The problem is that wavemon does not deliver this type of values by standard input, but instead we can use a much simpler command called iwconfig which is part of the wireless-tools maintained by Jean Tourrilhes. Although its main function is to set configurations and connection parameters, we will only use the query options, i.e. read-only values.
With iwconfig we will obtain the summarized data of each one of our network cards, either real or virtual. In case of not obtaining a wireless connection in the network connection, it will show the message “no wireless extensions“; for it we will have to filter the result, since we are not interested in the error outputs or STDERR:
iwconfig 2>/dev/null
Once we have identified the card that does have wireless connection capabilities we can make your Wifi Monitoring. Our concrete example has the name wlp4s1 :
Commands iwconfig, grep and cut to extract the ESSID
For the ESSID and Access Point we will use in Pandora FMS a “Generic string” to store these text strings and we will place an alert if they change, because they should not vary, we work with devices that must always be connected to the same routers. In the case of the quality of the signal we will use a “Generic numeric” taking into account that from the two numerical values we obtain a percentage.
Commands iwconfig, grep and cut to extract the MAC ADDRESS
Commands iwconfig, grep and cut to extract the percentage of the quality of the Wifi signal
However, due to the large number of manufacturers, this area belongs in depth to the Enterprise version. Please contact us if your hardware has specialized OID’s. Thank you for reading!
MWC or Mobile World Congress; Find out why it is so important
The Mobile World Congress or MWC, which will be held in Barcelona over the next few days, is no ordinary event. In recent years, it has become one of the world’s leading congresses in its sector, and annually raises the expectations of millions of people.
But what about its history and what does it represent? And why does it arouse so much expectation all over the world? Let’s answer these questions.
What is the Mobile World Congress or MWC?
The MWC is an annual event held since 2006 in the city of Barcelona (Spain), dedicated to the world of technology and especially mobile communication.
MWC finds its background in the GSM Congress, organized by the GSM Association and began to be held in 1990, at the dawn of mobile phone technology. The congress passed through several major European cities to establish its headquarters in the city of Cannes, until 2006. Given the enormous growth of the event, which already needed by those dates of larger facilities and greater infrastructure, it was decided to change location, moving to Barcelona.
The event takes place over 4 days and generates enormous expectation, with the presence of around 100,000 professionals (including thousands of CEOs) from some 200 countries, thousands of accredited journalists and millions of people who follow the presentations and news generated by the congress through multiple media. It occupies an area of more than 90,000 square meters, accommodating more than 2,000 exhibitors, generating around 13,000 jobs and an economic impact close to 500 million euros.
Why does the Mobile World Congress raise so much expectation?
The MWC has become a reference event in a sector as dynamic as the mobile technology.
But not only that. In addition, many companies -among them the largest in the world- take advantage of the MWC to present their breakthrough technologies such as Artificial Intelligence, Robotics, Virtual Reality, Augmented Reality, Drones and all types of software and hardware.
The Mobile World Congress often welcomes celebrities from the world of technology and economics, who often give talks or present products. In previous editions, personalities such as Mark Zuckerberg (founder of Facebook), Hiroshi Mikitani (founder of Rakuten) or leaders of the highest level, such as Kin Yong Kin, president of the World Bank, have come to its facilities.
In addition, the MWC provides another aspect that, although not so visible to the public, greatly affects its participants, and is the large number of contacts that are established at its facilities, and that serve to reach all kinds of agreements at the highest level.
The MWC seeks maximum comfort for its participants. For example, the facility has nearly 100 restaurants to serve its multiple visitors. Of course, during the days that are celebrated the demand for hotel places in the city increases dramatically.
Some ideas if you are going to attend the Mobile World Congress
– Don’t take too long to buy a ticket on your preferred means of transport
Barcelona is a very well communicated city, but the influx of visitors is so big during the MWC that, depending on where in the world you are, it will be essential that you prepare your trip well in advance.
– Remember to book your room with plenty of time
As we said, although Barcelona’s hotel capacity is excellent, it is advisable to reserve a place as soon as possible.
– Don’t forget to check the programme and plan your stay
Don’t miss those events that interest you most, since the activity is usually frantic.
– Freshen up your language skills
The Mobile World Congress is a global event where you will meet people from all over the world, so it will be good for you to come with your best knowledge of languages (preferably English) and ready to work at full capacity.
– Come well prepared
If your visit to the MWC is of a professional nature, you will need to come well prepared for the appointment. As we said, your company will not only be visible to millions of potential users, but you could also establish contact with important players in your sector and have great business opportunities at hand.
Technology and monitoring
And now that we’ve seen what Mobile World Congress is and what its importance is, how about taking a few minutes to learn what computer system monitoring is and why it’s also very important?
Monitoring systems are responsible for monitoring technology (hardware, networks and communications, operating systems or applications, for example) in order to analyse its operation and performance, and to detect and warn about possible errors. And this leads us to Pandora FMS, which is the great tool thanks to which this blog is possible.
Pandora FMS is a flexible monitoring software, capable of monitoring devices, infrastructures, applications, services and business processes.
Do you want to know better what Pandora FMS can offer you? Find out here: https://pandorafms.com/
Or you can also send us any query you may have about Pandora FMS. Do it in a very simple way, thanks to the contact form that can be found at the following address: https://pandorafms.com/contact/
Finally, remember that if you have a reduced number of devices to monitor you can use the OpenSource version of Pandora FMS. Find more information here: https://pandorafms.org/en/
Don’t hesitate to send your questions. Our Pandora FMS team will be delighted to help you!
What is DNS? Learn about its advantages and disadvantages
What is DNS? DNS is the Domain Name System, or the hierarchical system of nomenclature that orders the names of members who connect to IP networks, such as the Internet.
In this article we will briefly learn what DNS is, how it works, what it is used for and some of its advantages and disadvantages. What is DNS? Shall we begin?
What is DNS?
Although it also fulfils other “less popular” functions, DNS is a system that organizes web domain names and makes them more “intelligible” for all those who want to connect to the network.
As you probably already know, each of the devices that connect to the network has an IP number (Internet Protocol), which is the number that identifies that device as part of the network. It is something like what our physical address would be (our home address, for example), but in the network.
What happens with these numbers is that, like phone numbers, they are not usually easy to remember. They follow a structure like the following: XX.XXX.XX.XXX
And while it’s true that we usually remember or store phone numbers with a certain simplicity, imagine if you had to do the same with any web domain you wanted to access. The list would end up being endless and our management of the network would be much more cumbersome.
What is DNS? Let’s take an example.
Imagine you want to connect to Google. If there weren’t a system like DNS, every time you wanted to connect to Google you would have to search and type in a heavy string of numbers. And the same with any other place you’d like to access.
What the DNS system does is “to translate” the names we give to the domains to the IP language, so that the devices (client and server, in this case) can communicate satisfactorily without the need for us, as users, to know the IP numbers of each domain.
How does DNS work in practice?
DNS uses a hierarchical database that contains information about domain names.
If, for example, you try to access a web address from home, the DNS system goes through a whole series of steps.
Imagine that you make a request that requires a DNS search (for example, you type the name of a web page in the address bar of your browser). The first thing your computer will do is to send a request to the local DNS server of the operating system. This checks to see if the answer you need is in your computer’s cache (for example, if you’ve recently accessed that page, it’s likely that the information is still stored).
If it is not found in the cache, the request is sent over the Internet to one or more DNS servers, which will generally be those made available to its users by the Internet service provider you have contracted. If the required information is not found on these DNS servers either, the request will be sent to other external servers.
These are the steps that are followed, but how is the search structured? Let’s look at a key idea.
As we said before, the DNS search is hierarchical, and this is what explains the structure of domain names.
Domain names are divided into two or more parts, called tags, which are separated by dots. (For example, blog.pandorafms.org).
The right label is called the top-level domain (the “org” in the example). The following on the left are called subdomains, and the one on the left most often expresses the name of the machine (it does not refer to a particular physical machine). The DNS system will use all this information to rank your searches.
Some advantages and disadvantages of the DNS system
For all of the above, you can already assume that the main advantage of the DNS system is that it greatly facilitates the use of the Internet, which would be much heavier and more difficult if we had to know all the IP addresses we wanted to access. But it’s not the only one.
Another considerable advantage is, for example, the stability it provides. For different reasons, IP addresses (e.g. servers serving a web page) may change, so if you want to access a website you not only need to know the IP address, but this information should also be up to date. If we had to do it ourselves, we would be faced with a very laborious task. On the contrary, the DNS system is in charge of updating the IP addresses in a much faster and constant way, avoiding an important effort.
However, like everything in this life, the DNS system also has some drawbacks, such as those related to security. For example, there is the possibility of one of the famous “DNS attacks”, in which the attacker replaces the real DNS address with a fraudulent one, with the aim of deceiving users and directing them (without them knowing it) to malicious addresses, usually with very bad intentions, such as taking over their bank details or other sensitive data. In addition, there are other types of fraudulent practices, such as the creation of domains very similar to the real ones (for example, replacing the letter “l” in the name with the number “1”) that can mislead users and direct them to harmful websites.
DNS Monitoring
At this point, do you want to find out what DNS and monitoring have to do with it? You can see it in this article by our mate Alexander De La Rosa. Enjoy it!
Dark fiber: concept, pros, cons, challenges and monitoring
There is a very interesting alternative in the market in terms of communications services; we refer to the possibility of leasing or buying dark fiber segments.
Since the 90s of the last century, many companies have been making large investments in laying fiber optic cabling, managing to cover large geographic areas.
Many of these fiber segments have never been used and are referenced with the dark adjective, referring to the fact that light impulses were never passed through them.
In this article, we invite you to review what dark fiber is, what the dark fiber market is like, what its advantages and disadvantages are, the challenges that an organization that opts for this option must face and how monitoring can contribute to face them.
What is dark fiber?
As we said, dark fiber are fiber segments that were never used and that we can now lease or acquire.
These fiber segments are there since many Internet service providers, cable TV providers and even government agencies associated with electric power carried out fiber optic cables to support the delivery of their services.
When they performed a laying project they overestimated the amount of cable required. Among the factors that supported and promoted this practice are:
Marketing plans aimed at preparing the company for a growing demand.
The economy of scale that favors the acquisition of large quantities of materials and hire the necessary labor for time.
The processing of permits of municipalities and other government agencies, in which it was more practical to do the process for a large area than for a single street.
So, there were kilometers and kilometers of fiber optic cable but these were never activated. That is, dark fiber.
The dark fiber business
Some companies saw the data transmission capacity of the dark fiber segments, especially if techniques such as Dense Wavelenght Division Multiplexing (DWDM) are applied.
Indeed, DWDM has become a key technical element for the development of the dark fiber business, since it allows several signals to be transmitted simultaneously through the same fiber optic cable.
The signals are transmitted in unique and separated wavelengths; in this way the same physical cable is converted into several virtual cables.
This makes viable and interesting the marketing under the dark fiber lease scheme.
With this scheme a client can lease the capacity to transmit by fiber or the dark fiber optic threads necessary to create their own communications network.
Thus, the alternative of leasing dark fiber represents an alternative to the scheme of paying for bandwidth to a communications provider, regardless of the technology that said provider manages.
According to the National Commission on Markets and Competition, in Spain there are, since 2016, more than 2 million kilometers of dark fiber available, keeping Red Eléctrica as the main owner with more than 60% of the total. You can check the annual reports on this link.
Who are the customers when it comes to dark fiber?
The dark fiber business has been developed targeting those companies and organizations with high levels of Internet demand in terms of speed and security, and that must transmit a large number of files with sensitive data between different locations.
An interesting example is a company that requires connectivity between two data centers; In this case, it is required:
A good level of bandwidth.
A high level of data security.
A very short latency time and a very high level of link stability.
A company in this condition is an ideal candidate for a dark fiber point-to-point segment.
Thus, reports from companies specializing in dark fiber refer to clients that include government institutions, e-commerce companies and commercialization companies with multiple stores for direct sales.
At the moment, no significant sales levels are reported at the level of small businesses or households.
Advantages and disadvantages
There is an interesting point of this scheme and that the leased dark fiber wires are logically separated from the general network of the provider, offering the possibility that the client has complete control of the resulting fiber optic network.
Under this scheme you rent the fiber threads and you keep the control of the communications network, with all the benefits when it comes to security.
The promise of value of the companies suppliers revolves around rules that emphasize this:
It recovers the control of your data.
It constructs your own communications network totally prevailed.
Another point in favor of the dark fiber is the scalability; let us say that a company undertakes a project of connectivity of two localities with a scheme point to point based on dark fiber.
And we also say that initially it decides to establish a scheme of 10Gbps on this connection; therefore it makes the appropriate design, acquires the necessary equipment.
After some time the speed requirements change and a connection of 100Gbps is required; then, it starts from a constant physical platform and it will be required only to update the equipment or in any case to change it.
Cost control is also implicit in this scalability scheme. If the company surely had a service of communications based on another technology the change of bandwidth of 10Gbps to 100Gbps it would imply an increase in the monthly costs.
Now, dark fiber has a serious disadvantage in terms of availability since, although there is a lot of dark fiber available, perhaps for the location required by a certain company there will not necessarily be the possibility of leasing dark fiber.
On the other hand, although the stability of dark fiber links can be very high, for a specific segment it can be complicated to create a fault tolerance scheme, since it will require the lease of another fiber segment or the acquisition of another communication scheme.
Finally, having control of the communications network implies costs and challenges at the technical level that the company that leases segments of dark fiber must resolve in some way. Things like;
Design, acquisition and implementation of the necessary transmission equipment to be able to bring the dark fiber segments to production.
The regular maintenance of the segments and any repairs that may occur.
These technical challenges are usually solved by contracting the additional services that the companies that commercialize dark fiber usually contribute.
However, the scope of these companies may be limited; in fact, many of them do not include in their proposals the necessary equipment for the integration of the dark fiber segments.
Likewise, their capabilities are limited in terms of the monitoring of the links and the data that passes through them, so it is vital that the client assumes the activities of constant monitoring of the behavior of the resulting network.
Challenges and monitoring
It is interesting to think about the challenges that a company that decides to bet on technology around dark fiber links must face.
The main challenge is to integrate a fiber segment to the base platform in the most efficient way, which we can also assume that it will pass a large amount of sensitive data.
This integration has certain technical and operational implications that could become a headache for the computer scientists in charge.
One way to avoid problems can be to start the integration from a platform on which a high level of governance is exercised, both at the physical level as well as servers and applications. Which leads us to think about the support that a general purpose monitoring tool can provide to this situation.
In the event that the company does not have an implementation of a monitoring solution, the acquisition or lease of a dark fiber segment may represent the ideal time to start an acquisition and implementation project of Pandora FMS.
If the reader is in this situation we invite you to read a very interesting article published in this blog, which may be ideal to introduce the advantages of network monitoring.
In the best case, the company will have a monitoring system for general purposes such as Pandora FMS fully operational and in this situation we recommend to be alert to the following steps:
Platform personnel training : If the management and platform support staff of the company does not have the technical knowledge and experience to give regular maintenance to this type of technology, it is necessary to plan a training plan that covers these needs.
Define maintenance and support processes: For the new links, it will be necessary to define the internal processes associated with regular maintenance and the escalation procedure of support cases with the specialized providers.
Adjust the visibility platform: It is necessary to integrate the new equipment associated with the dark fiber segments into the network monitoring platform. Include in the IT assets list the equipment associated with the dark fiber segments, update the network maps, evaluate if this equipment supports protocols such as NetFlow or SNMP that allow us to monitor their physical parameters and behavior, evaluate if it is necessary to include hardware elements to capture traffic such as fiber TAP, etc.
In the following link you can find information about the network monitoring scheme applied by Pandora FMS, which could be the starting point to integrate the monitoring of dark fiber links.
Set the required alarms: Adapt the alarm scheme to include those that indicate performance problems in dark fiber links.
Review the application monitoring scheme: Starting from documenting the applications whose traffic passes through the dark fiber segments. The transactional analysis of these applications should be adapted to take into account the global performance of the fiber segment and the individual performance of every active component.
In the following link you can find all the information you may need about the Pandora FMSapplication monitoring scheme.
Finally, if the transmission needs of a company such as volume, security and stability are aligned with the advantages of the dark fiber segments and can also support a high initial investment in terms of reducing monthly costs for communications, then Dark fiber should be considered.
Now, without a doubt, the best situation to face the challenges and disadvantages inherent in this technology is based on having a broad, solid and flexible monitoring platform.
We invite you to share your experiences, doubts and expectations regarding dark fiber by leaving a comment below.
We recently mentioned Grafana without going into detail.
Today we are going to solve it and present it to you properly.
What is Grafana and what does it do for you?
Grafana is a tool made in free software, specifically with Apache 2.0 license, devised by Torkel Ödegaard (who is still in charge of its development and maintenance) and created in January 2014.
This Swedish developer began his career in the .NET environment and in 2012 (to date) continues to offer development and consulting services on this popular proprietary platform, in parallel with the development of open source software.
Grafana is written in Go Language (created by Google) and Node.js LTS and with a strong Application Programming Interface (API).
It is an application that has been climbing positions, with an enthusiastic community of more than 600 well integrated contributors (there are 7 lead developers -Torkel at the head- and 5 part-time to coordinate such a group of people).
Its source code is published, of course, on GitHub.
What does Grafana do?
Grafana is a tool for visualizing time series data.
From a series of collected data we obtain a graphical overview of the situation of a company or organization.
From words to deeds: Wikidata, the huge knowledge database, collaboratively edited and progressively structuring the articles in the online encyclopedia Wikipedia, uses grafana.wikimedia.org in a public way to show the edits made (in our personal case we do it regularly) by the collaborators – and machines – with the “pages” created (or rather, data sheets created) and edited in a certain period of time:
What is Grafana for Wikipedia and/or Wikidata?
It is just a way to represent statistical data in a fast and public way, always using open source and/or free software. Other entities that use Grafana regularly are:
European Organization for Nuclear Research (CERN).
DigitalOcean, a hosting service for virtual machines based entirely on free software.
Fermi National Laboratory (FermiLab).
And many other private companies!
What are the advantages of Grafana?
What makes Grafana special? What makes it unique?
It can run in TV mode (a particular euphemism for kiosk mode) so that, every certain preset time, it can display different control panels that we have saved in playlists.
This seeks to solve two details: if we cannot visualize everything at once on one screen, then divide it into parts and display it automatically and periodically; the other detail is to combat the static, for us human beings, of seeing the same screen – with values that change, of course – but that attracts our attention – and that of the public, as the case may be – by making the graphical transition.
To exit the kiosk mode we only need to press the “d” plus “k” keys, which brings us to the next point.
Grafana loves the use of the keyboard.
What is Grafana without a keyboard shortcut?
It’s like a flower without a scent, poetically speaking; for developers this is a point of honor: being able to work without the use of a pointing device such as a mouse.
Again, in our personal case, we value this feature very much, not only in this software but in any other.
If we want to see online a demo, in this web link you can see something like this:
Grafana Ecosystem
As we said, it serves to visualize information, which is collected and/or processed by third party applications. The sole purpose of Grafana is to present monitoring data in a more user-friendly and pleasant way.
At this point we should make a disclaimer: it can natively collect data from Cloudwatch, Graphite, Elasticsearch, OpenTSDB, Prometheus, Hosted Metrics and InfluxDB.
There is an Enterprise version (grafana.com) that uses add-ins for more data sources, but there is no reason why those other data source add-ins cannot be created as open source, as the Grafana add-in ecosystem already offers many other data sources; as of February 2018:
37 data source add-ons.
28 dashboard add-ons.
15 application add-ons.
Over 600 dashboards created for popular applications.
They recently added an option to manually send an alert to where you want it by simply zooming in on the graph and calling a pop-up menu.
While this is a welcome addition that will not necessarily replace an alert platform, it can certainly help by providing a different perspective on alert criteria (obviously, for mass uses and criteria for hundreds of devices it is unfeasible).
Grafana in the monitoring field
Elasticsearch is one of the data sources for which Grafana offers native support; this is not surprising, considering that Grafana was initially a component within Kibana, from which it was forked.
The ELK platform means the combination of Elasticsearch, Logstash and Kibana; the first two components are used by Pandora FMS since version 712 for log collection and we show it summarized in the following image, which is worth more than a thousand words:
Note: Pandora FMS has a powerful web console and Metaconsole to unify them; it can run in kiosk mode and provides powerful tools associated with monitoring as a whole.
This article about Grafana is just a sample of the extraordinary flexibility of Pandora FMS, and does not signify a public endorsement of the information presented here.
If you want to see it for yourself totally free and for any size of installation
Sign up here and we will tell you how:
Time is an important factor when searching and viewing logs. The keyword(s) will be the other determining factor, but who provides this keyword?
For this we imagine non-routine scenarios: one or more executives who have at their disposal a programmer who builds the necessary dashboards to represent the most varied information, or perhaps a network administrator who wants to take the information of a certain development that is being applied to a production system.
Actually, there are many uses that we can give to Grafana, besides the fact that it offers a user authentication at user level that could be shared with Pandora FMS if used in both LDAP.
However, we find more useful the possibility that Grafana connects by authentication with GitHub so that our programmers can themselves look up their own log information without affecting the system(s) to which it is connected.
What is Grafana for programmers? It is the opportunity to investigate – and review – the result, in production – of their own applications, with no more effort than creating the necessary dashboards and/or customized dashboards!
Pandora FMS always at the forefront
You can have your own style of programming, working and doing things, either in the old way or as we need in our development team, but you always have to keep updated with the advances and new trends, which as we see can become new useful tools.
If you want to try them all at zero cost, sign up here and we will tell you how:
Computer peripherals for a company; Let’s find out more
Hello again, dear friend. It’s possible that, a few days ago, you read our fantastic article in which we offered some ideas to choose computers for your company. Did you think you had it all figured out? Ha, ha, ha! Your problems have only just begun! Haven’t you thought about the peripherals? You don’t know what’s waiting for you!
Although sometimes the purchase of computers is done in pack (some peripherals, such as mouse, keyboard or screen are “attached” to the computer), in many cases the purchase is done separately, so you should take into account some important factors, and even more if you are going to purchase large quantities of computer peripherals, for example for your business.
In this article we are going to remember some aspects that you should take into account before doing so, advancing through the main peripherals that we usually buy for our devices. Let’s go!
Some things to keep in mind before choosing computer peripherals for a company
– Monitor
The King of computer peripherals claims our attention. When it comes to choosing screens for your company’s computers, remember that cheap is often expensive. The monitor happens to be, probably, the peripheral that we have to take into account when we make this type of purchase. We have to remember that we spend up to 8 hours a day in front of the screen, which entails the duty to take care of its quality and characteristics.
Screens must be large enough to work comfortably, and even more so when it comes to activities such as design that require a high degree of visual detail. In addition to this, you should avoid poor quality, low-definition or flickering screens, which can even end up causing vision problems. Don’t forget: monitors are very important for work comfort and can have an impact on productivity, so if you have to save, you’d better save on other purchases.
– Keyboards
What about keyboards? Our battered colleagues are often the great forgotten in this of the computer periphery, even though we do not stop using them. And it’s true that a keyboard may not be the sexiest thing in the world, but there they are, fulfilling their function, and you’re going to have to take care of them.
Like any other device, you have trillions of options to choose from. So first, the most important thing is usually its durability, its ergonomics and its price. And on this basis you can opt for some improvements, such as wireless, or maybe with special keys for the Internet or colours to make your life more enjoyable. Do not forget to acquire them or otherwise you will have enough problems to use your computers…
– Mouse
In particular, I must say that I have a real open battlefield with this mouse business. I have the habit of breaking these frequently, which means paying special attention to their durability.
In addition to this, again the dilemma arises of choosing between wireless and wired, modalities both of which accumulate crowds of fans. And don’t forget other factors, such as ergonomics or size, which can be quite variable and make it more or less comfortable to use. And you can even opt for special mice, such as those designed for presentations or use in confined spaces. As you can see, you have a lot of options to choose from!
– Printers
Indeed, paper still exists and there are many companies where printers are still used.
Although we increasingly tend to digitize everything, printers are a common peripheral in most companies. When buying them, you must take into account what will be its use because, unlike other computer peripherals, this is usually more occasional and used to work shared by several computers. Therefore, a forecast of the number of printers you need will be one of the fundamental tasks you must do.
Once you have this clear, you will have to decide the model and its characteristics. Don’t forget that, in the field of printers, there is also a lot to choose from. Many of them include scanners and their qualities vary a lot, from basic equipment to make few prints to industrial printers.
– Other peripherals
Today there are many more peripherals, such as speakers, headphones, touch panels, digital cameras, external hard drives, switches, routers or even virtual reality glasses, among others, but talking about all of them in detail would make this article endless, so we limit ourselves to mentioning them, because now we must deal with a very important thing, called Pandora FMS.
If your company uses a computer infrastructure, you will need to control it, so that it works, as it should, right? Let Pandora FMS help you!
Pandora FMS is flexible monitoring software, capable of monitoring devices, infrastructures, applications, services and business processes.
Do you want to find out how Pandora FMS could help your company? You can send us any query you may have in a very simple way, thanks to the contact form found at the following address: https://pandorafms.com/contact/
Hyperconvergence and its challenges for monitoring
Hyperconvergence, hyperconvergent platforms, hyperconvergent modules, are relatively new terms in the world of data centers.
In addition, each technology that emerges or evolves and succeeds in penetrating the market represents new challenges for monitoring platforms.
Thus, hyperconvergence is another in the list, which includes elements such as the cloud, software-defined networks, edge computing, DevOps, Agile, and so many others.
In this post we invite you to review what hyperconvergence is, what changes it represents for the conformation and management of data centers and what challenges it poses in terms of visibility and monitoring.
About hyperconvergence
Let’s start from the traditional architecture of data centers, which involves the presence of different devices such as servers, storage hardware and network switches.
Each element is provided by different manufacturers and the administrators of the data centers were in charge of integrating and managing them using the facilities provided by each team for these activities.
The Convergence is then presented as the property through which two or more components are grouped in the same device, capable of performing the same function or providing the same service.
This concept, applied to data centers, refers to the grouping into a single component of the elements that make up the center’s platform, such as servers, storage hardware, and network devices.
Since it is a question of the unification of elements coming from different manufacturers, the administrative and support capacities are still supplied by these different manufacturers, without establishing a single platform.
Convergence models then undergo a change with the penetration of virtualization technologies, since beyond the physical grouping there is the possibility of creating virtual units with specific capacities of computation, memory and network.
Then the possibility arises of a new convergence architecture that starts with grouping, but now in function of the hypervisor that sustains the creation of the virtual elements.
It is precisely based on the word hypervisor that the term hyper-convergence is coined, in which both physical and virtual components are combined in the same element, regularly called a module or node.
Thus, modules in hyperconverging architectures are units made up of both physical and virtual elements.
Applying hyperconvergence, administrators should not think about scaling by integrating more computing capacity, new servers, more disks or a new network switch, but should think about adding more and more modules, in a scalability that in theory is unlimited.
Characteristics of hyperconvergence
Three characteristics of hyperconvergent platforms are worth mentioning.
On the one hand is the fact that the integration of the elements is achieved natively, eliminating the need for elements such as SAN switches and disk controllers.
On the other hand, we have that the modules or nodes can work with multiple virtualization platforms, of course from different manufacturers.
Finally, we must mention the administration and support software of these modules; in general, hyperconvergence solutions suppose the existence of single administrator software which will be provided by a single provider.
A single point of administration of all the hyperconvergent elements that make up a data centre or the entire platform of several data centres is then considered.
In addition, this management software brings with it additional capabilities, including replication, backup, disaster recovery, compression, cloud connection, and even monitoring.
Application of hyperconvergence
The penetration of hyperconvergence has been for a few years very considerable, and is expected to grow to represent a market of $17 trillion by 2023, as estimated by Markets and Markets analysts in this report.
https://www.marketsandmarkets.com/PressReleases/hyper-converged-infrastructure.asp
In any case, as we mentioned in an article on data center monitoring, part of the administrators’ job is to evaluate emerging technologies, from advancements in hard drives to the implementation of new architectures.
Therefore, hyperconvergence is one more alternative that managers should evaluate and determine whether their technical advantages are useful to them and whether the supposed economic advantages are attainable for particular cases.
Challenges for monitoring
Hyperconvergence is an interesting simplification in terms of data centre architecture. In hyperconvergent platforms we will have to deal with fewer server models, SAM units, controllers, suppliers, etc.
It also simplifies the scalability scheme, which means that whatever monitoring scheme we define this will not be so affected or challenged with the natural growth of the data center.
But of course we can also think of a negative element and this is, at first glance, the fact that in hyperconvergent platforms the modules become black boxes that could greatly affect our ability to visualize and therefore monitor.
However, as we said in the previous section, hyperconvergence technology providers enrich their offer with administrative software that has monitoring capabilities.
In fact, many offers talk about establishing a scheme of total visibility for all the modules that compose it and of course all the subsystems that compose each module (computation, memory, network, virtualization, application, etc.).
Even if you look at some of the manufacturers you will see that they deal with the issue of monitoring by mentioning their capabilities from physical infrastructure monitoring to application monitoring, including network and storage monitoring.
If we consider that this is true, the real challenge is then posed as an integration challenge between the general purpose monitoring tool like Pandora FMS and the monitoring tools that are acquired with hyperconvergence products.
If you are thinking about starting this integration from, for example, SNMP-based monitoring, understanding the modules as any device, may be interesting technically speaking, but it doesn’t sound very promising in terms of efficiency.
A more encouraging starting point may be the log files. The idea would be to extend the log file monitoring capabilities of our general purpose-monitoring platform, including the log files from the hyperconvergent platform.
If you need to become familiar with the log files and related monitoring, then read this post.
The important point is that most of the hyperconvergence solutions include the handling of logs files with the registry, which should be detailed and transparent, of everything that happens internally in the modules, being able then to establish the sending of the logs files to a collection point from where our monitoring tool can access them.
On the other hand, virtualization is a basic element in hyperconverging platforms, for which most solutions propose a scheme in which any virtualization scheme is viable.
Therefore, in order to integrate the hyperconvergent platform to a general-purpose monitoring scheme, we will rely on the experience we have acquired in monitoring virtual environments.
Here the challenge for the monitoring platform is that it must have a scope as wide as that of the hyperconvergent platform.
In the following link you will be able to obtain more information about Pandora FMS capabilities in virtual platform monitoring.
Now, although the integration through log files and the monitoring of virtual environments are interesting points, at the end of the day the ideal would be the exchange of information between the two tools on the status and performance of the platform.
We do not remain only with the data contributed by the log files or the possibility of extending the monitoring of the virtual environments, but to extract from the administrative tools of the hyperconvergence platform reliable and transparent information on the internal performance of the modules and to integrate this information in our monitoring tool.
If such an exchange includes elements such as alerts, for example, it can undoubtedly be very interesting in terms of efficiency of the entire monitoring platform.
Therefore, organizations that have made efforts to install, configure and tune their monitoring tools such as Pandora FMS should be able to demand this type of integration from their hyperconvergence providers, making this integration and its scope one of the central decision points when choosing a solution among the hyperconvergence solutions market.
To provide the best experiences, we use technologies like cookies to store and/or access device information. Consenting to these technologies will allow us to process data such as browsing behavior or unique IDs on this site. Not consenting or withdrawing consent, may adversely affect certain features and functions.
Functional
Always active
The technical storage or access is strictly necessary for the legitimate purpose of enabling the use of a specific service explicitly requested by the subscriber or user, or for the sole purpose of carrying out the transmission of a communication over an electronic communications network.
Preferences
The technical storage or access is necessary for the legitimate purpose of storing preferences that are not requested by the subscriber or user.
Statistics
The technical storage or access that is used exclusively for statistical purposes.The technical storage or access that is used exclusively for anonymous statistical purposes. Without a subpoena, voluntary compliance on the part of your Internet Service Provider, or additional records from a third party, information stored or retrieved for this purpose alone cannot usually be used to identify you.
Marketing
The technical storage or access is required to create user profiles to send advertising, or to track the user on a website or across several websites for similar marketing purposes.


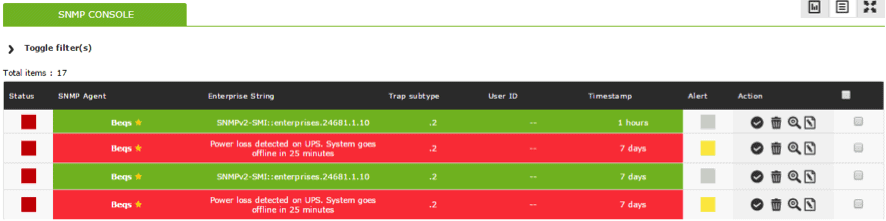
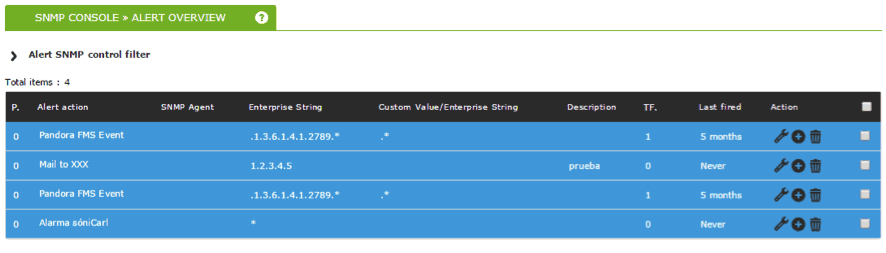

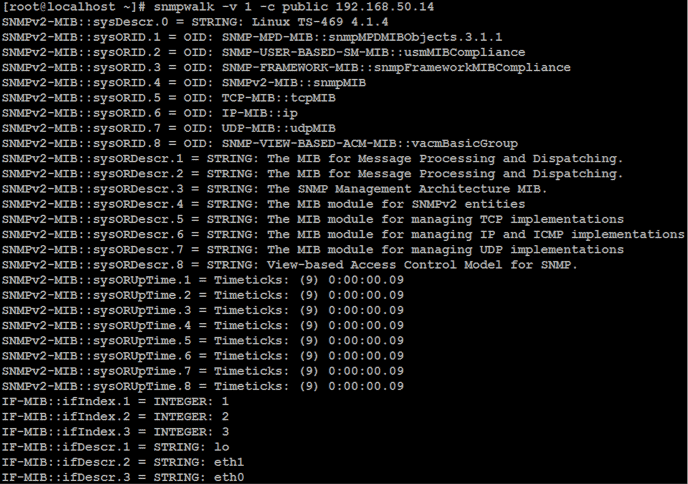

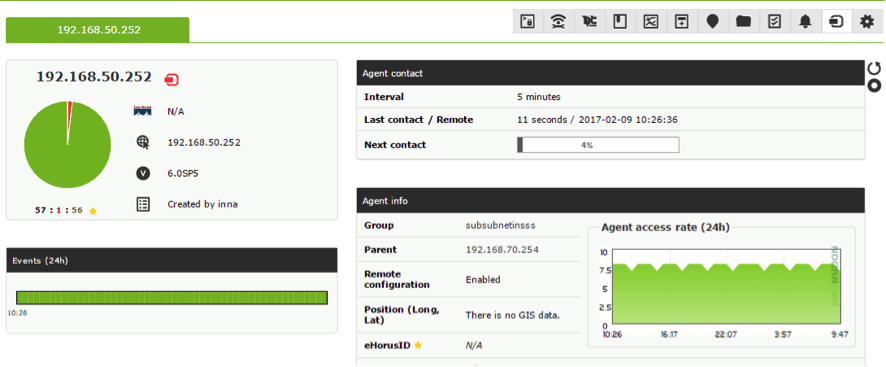
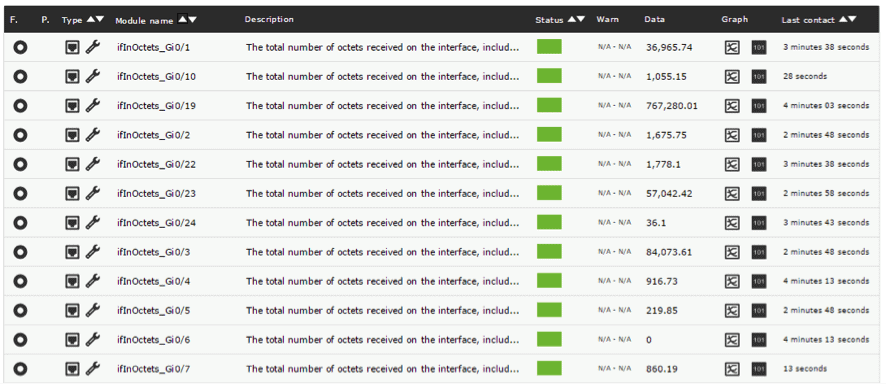


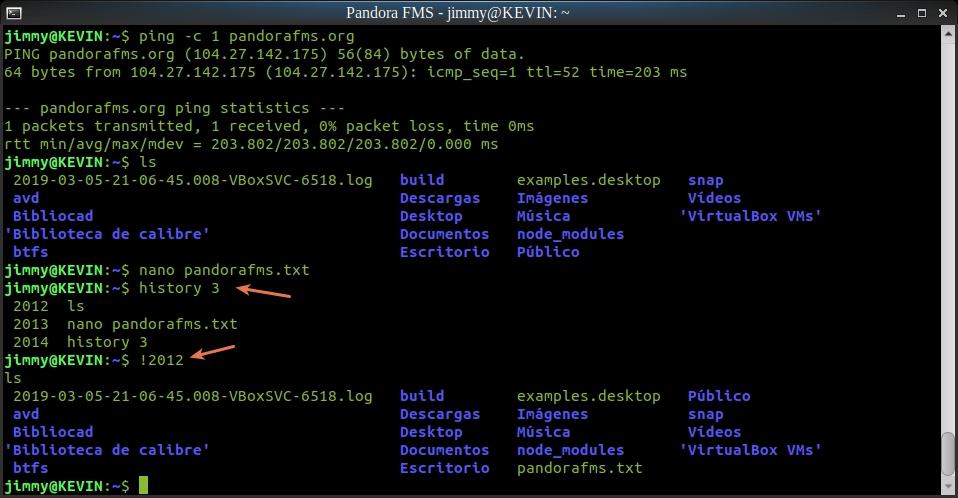

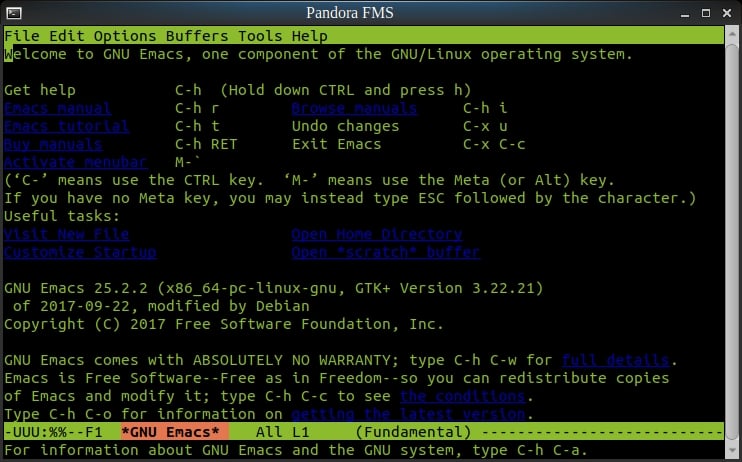


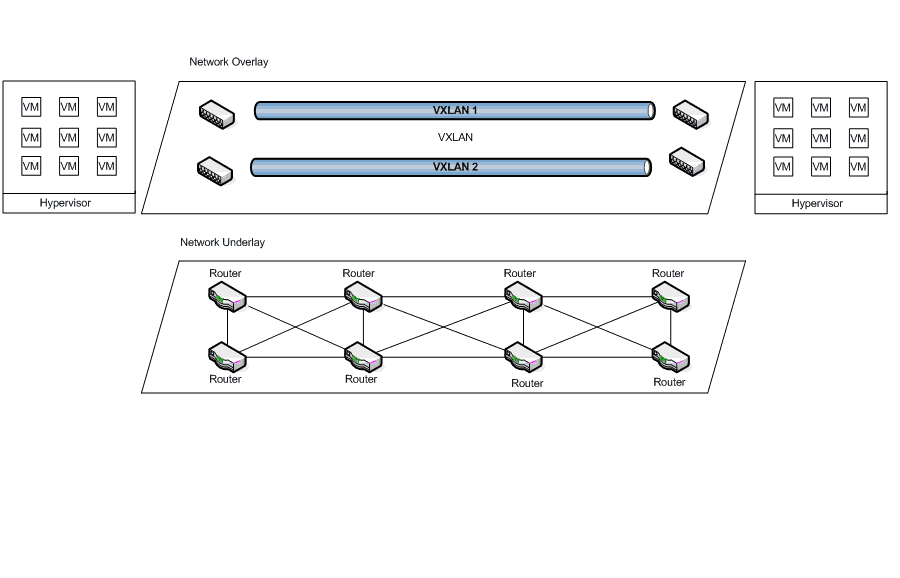
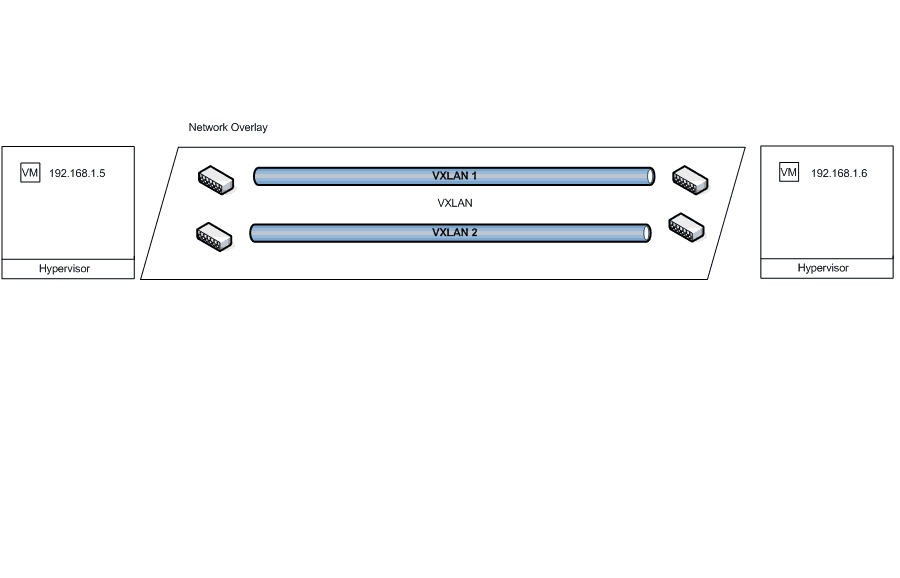
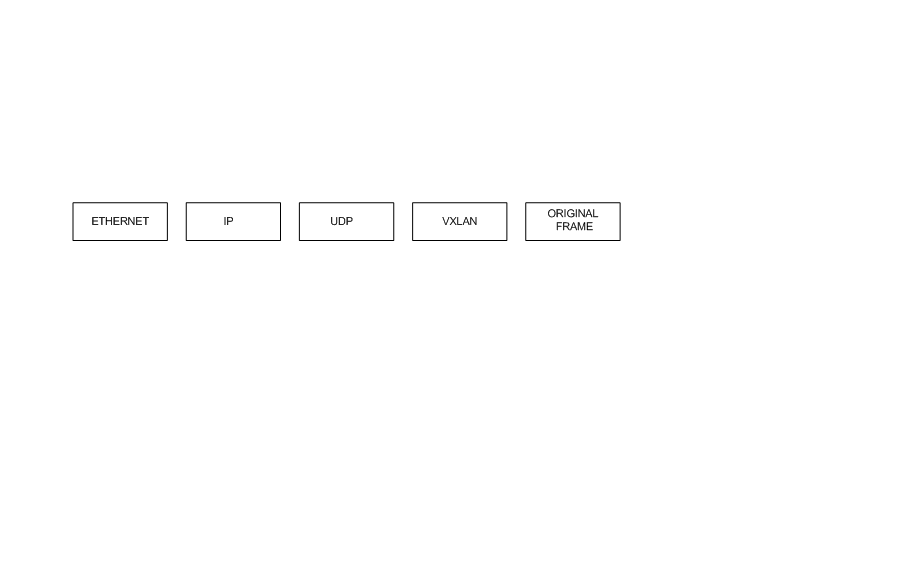


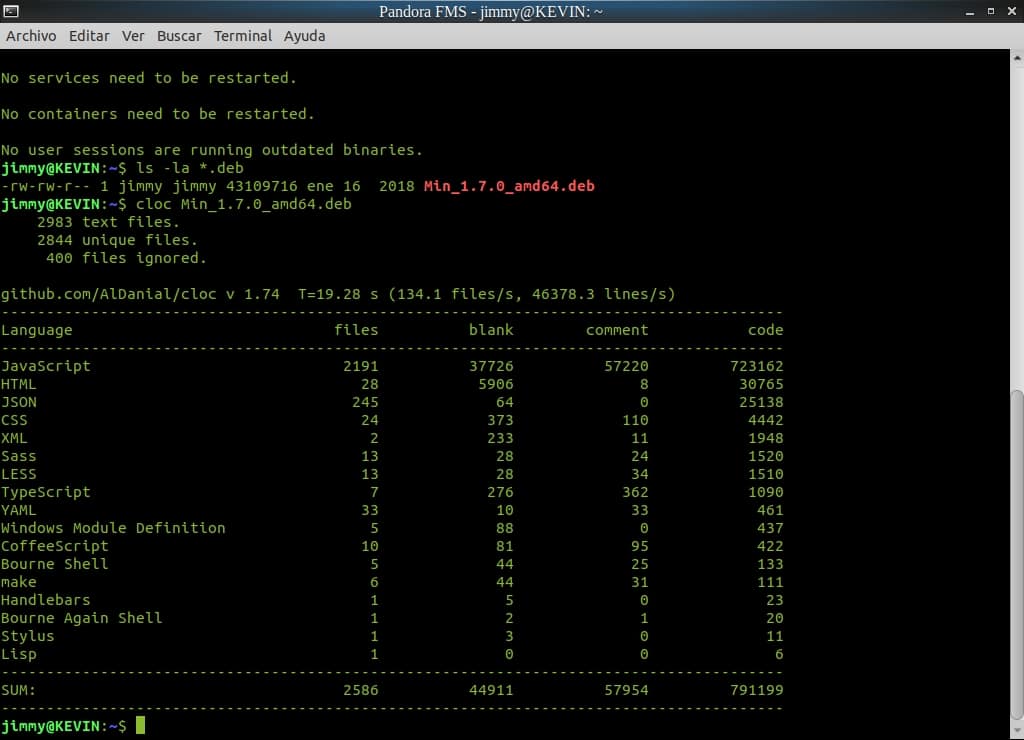
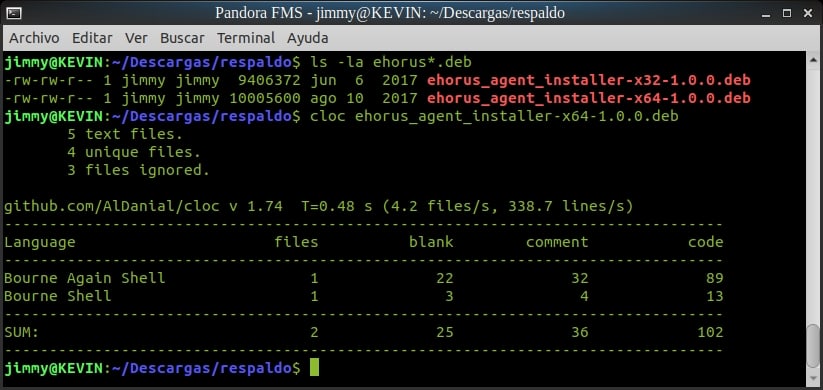
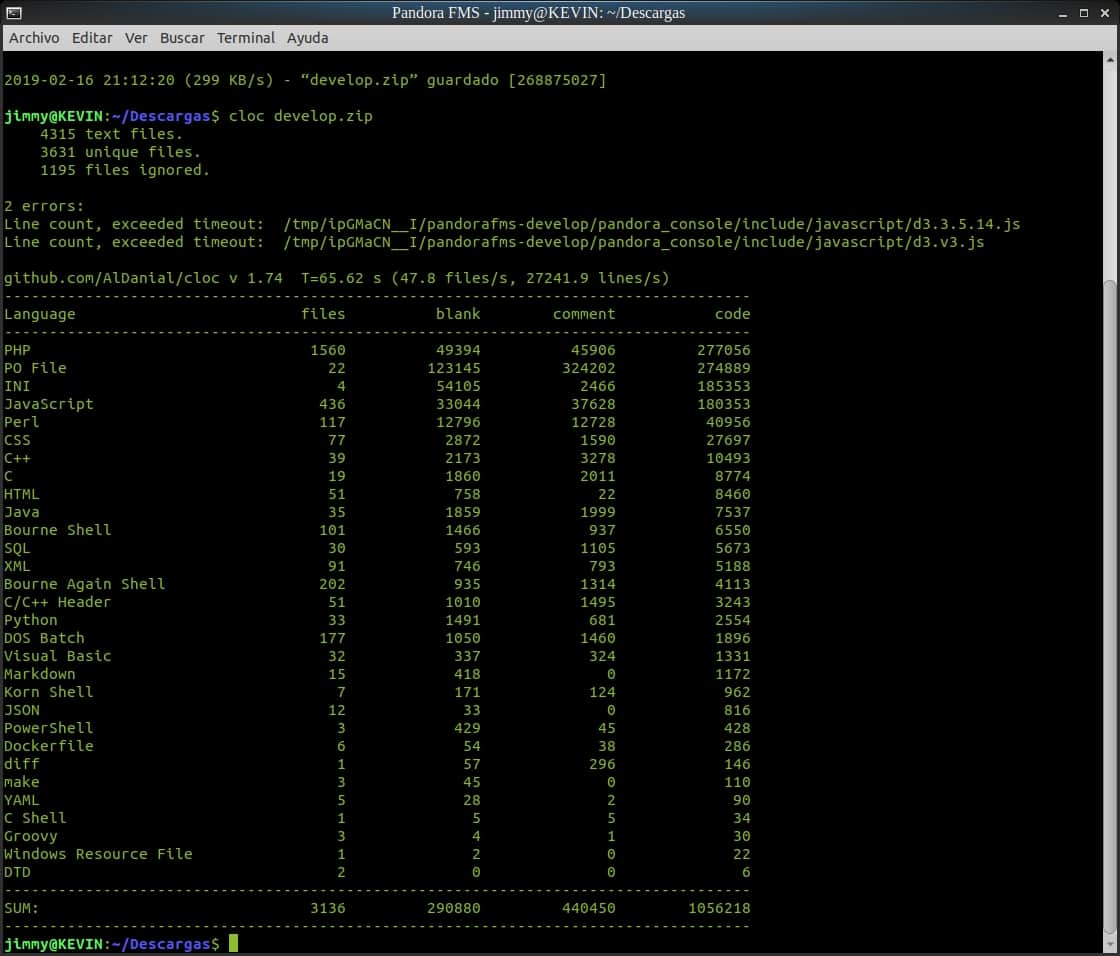
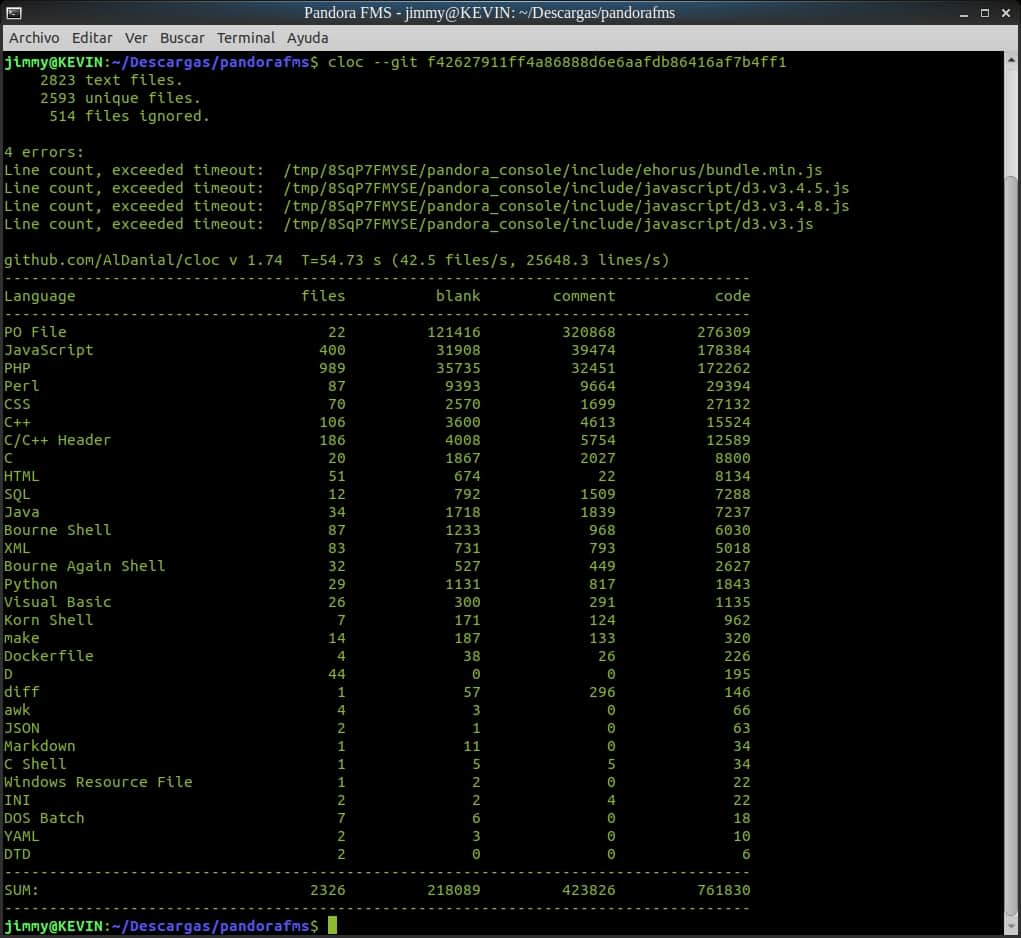


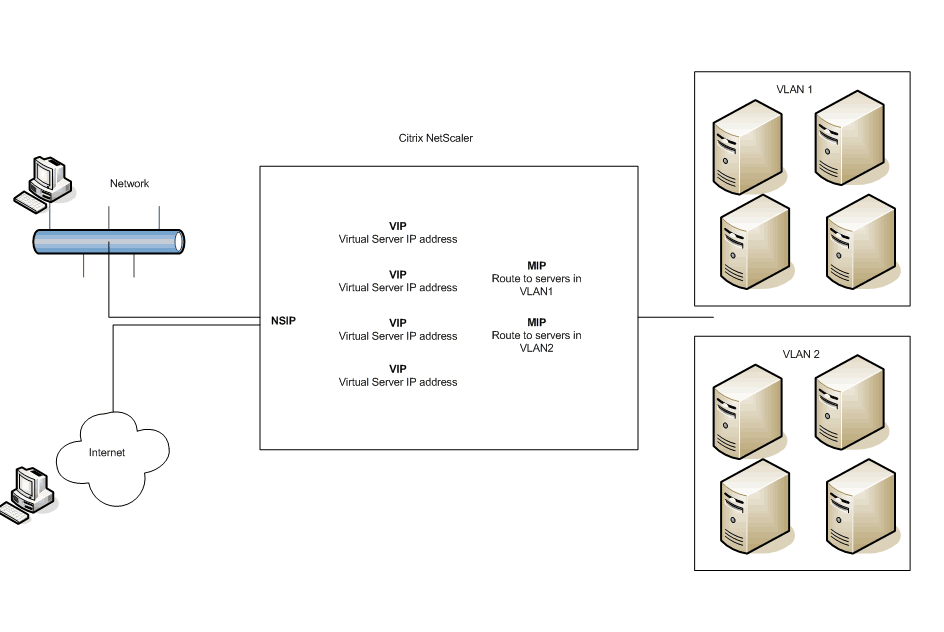


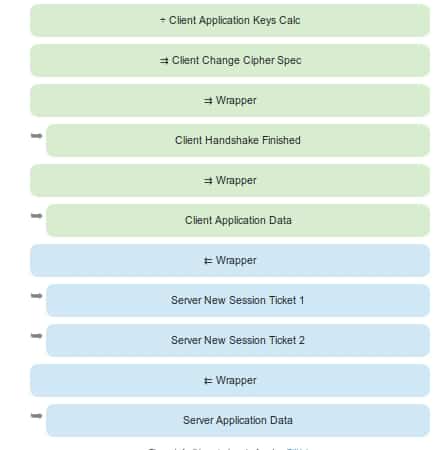
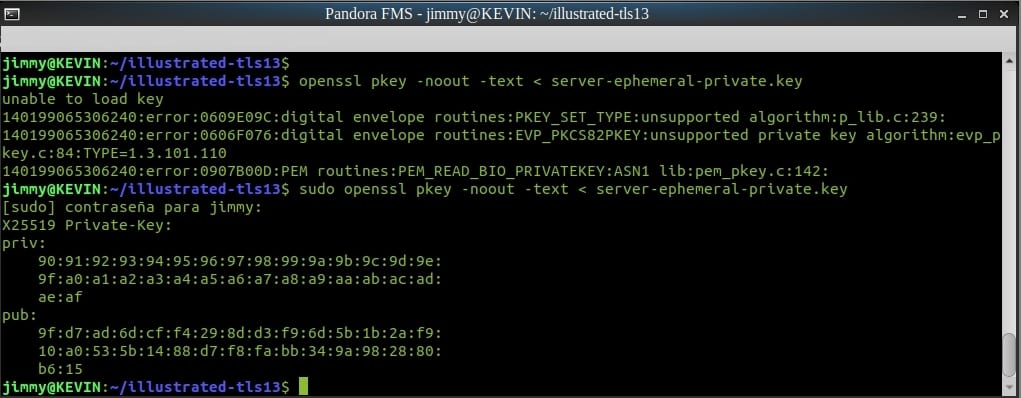
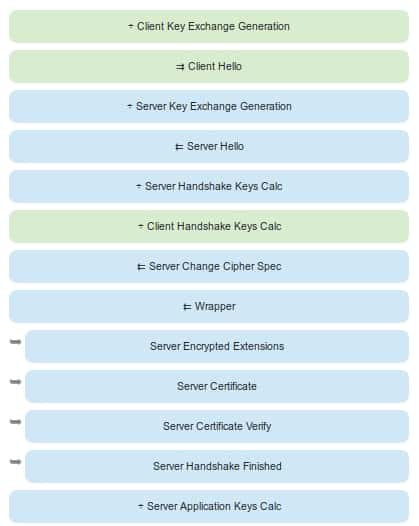


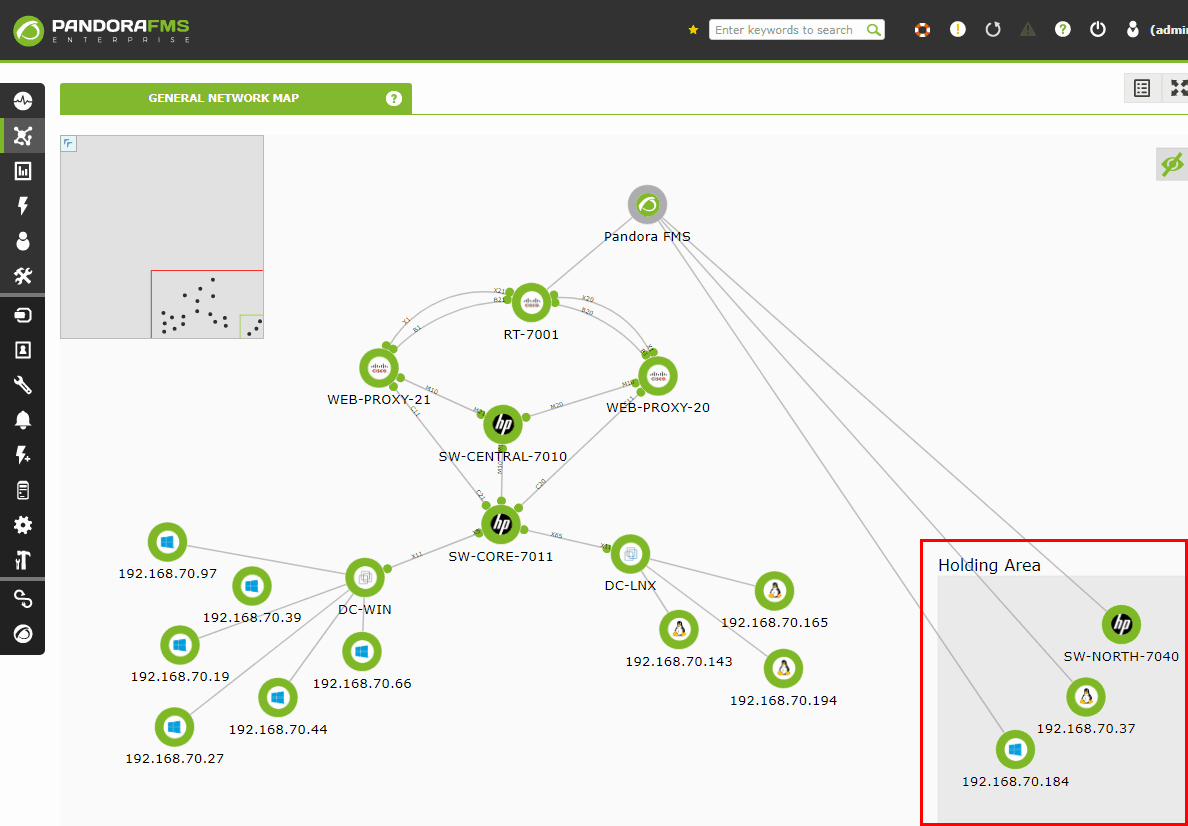
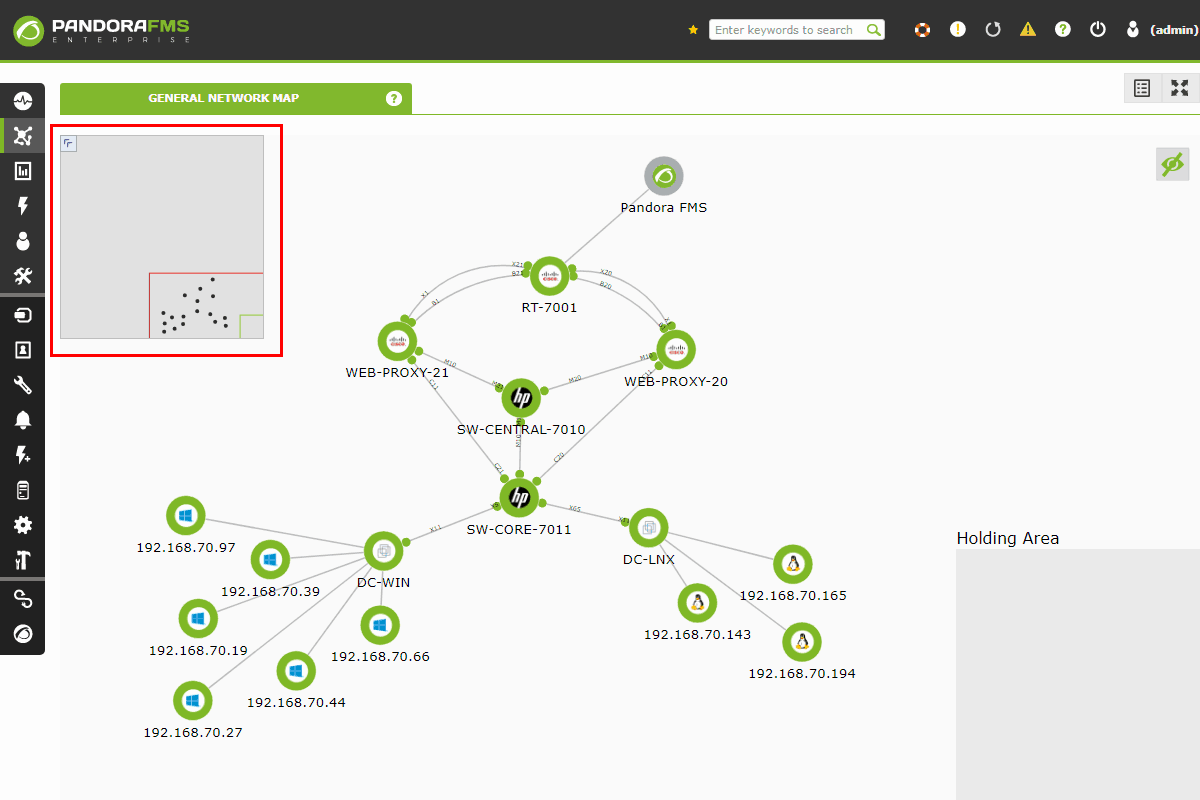


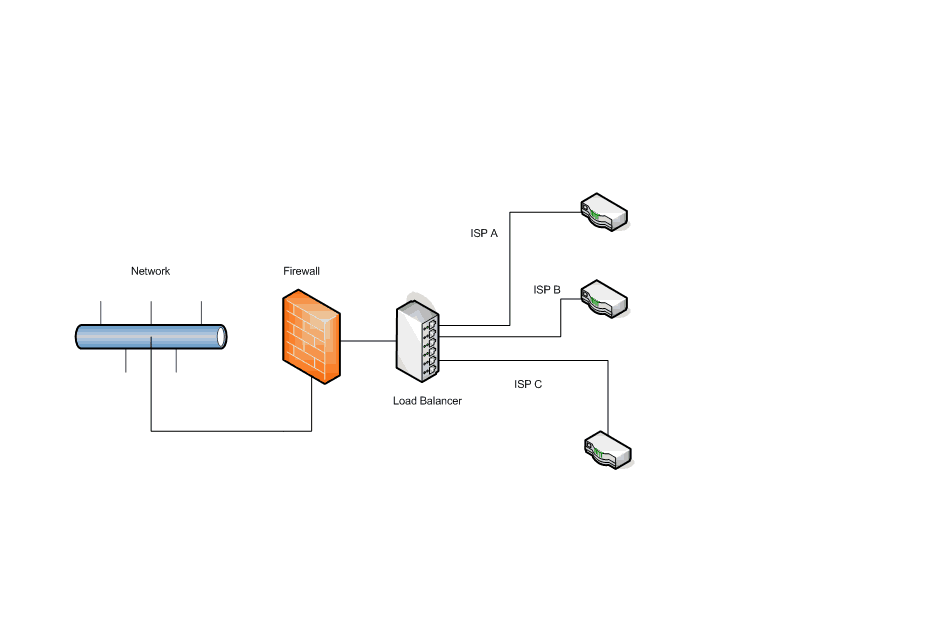


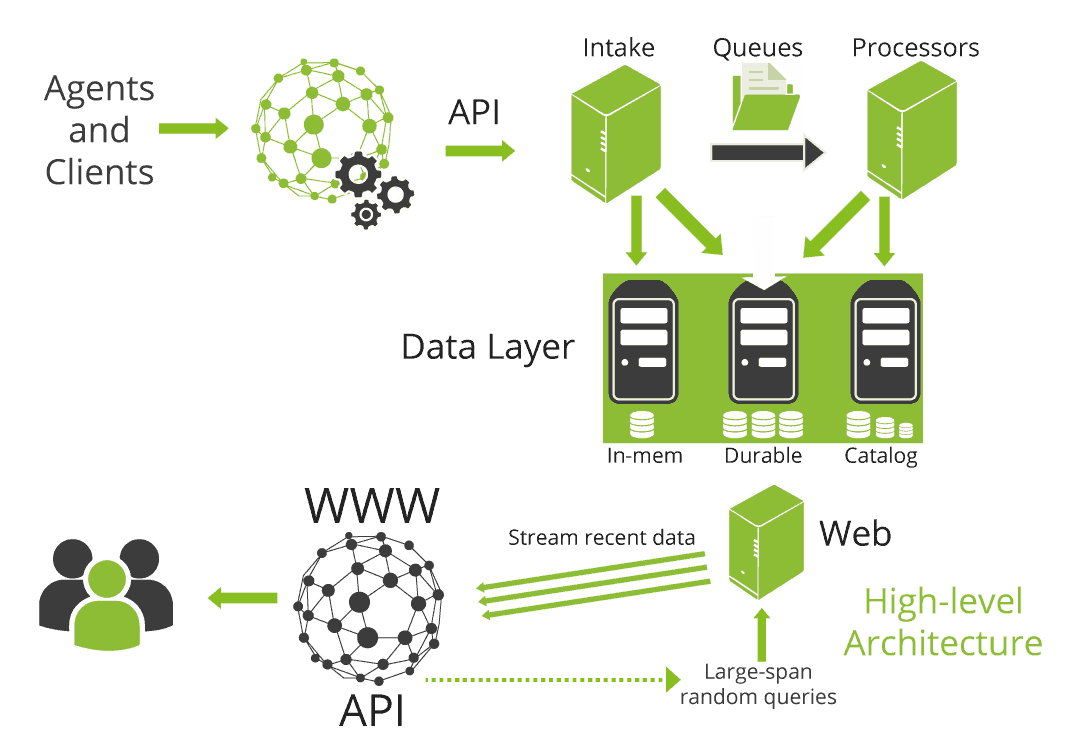


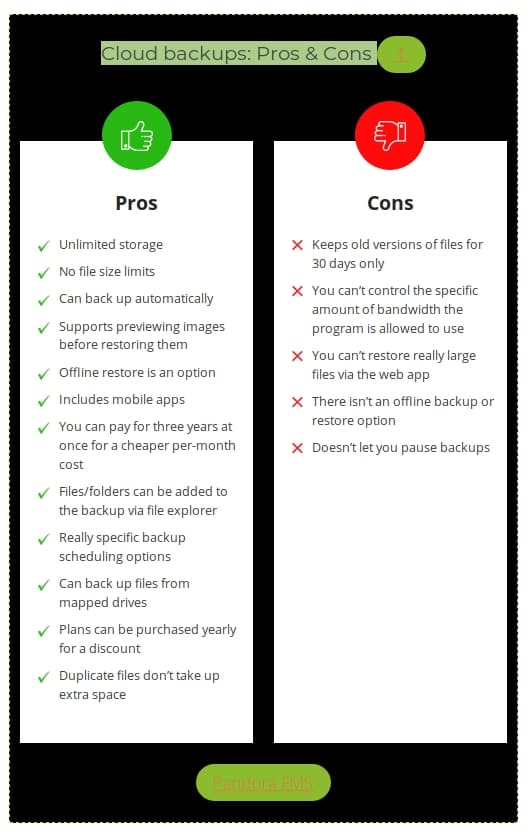


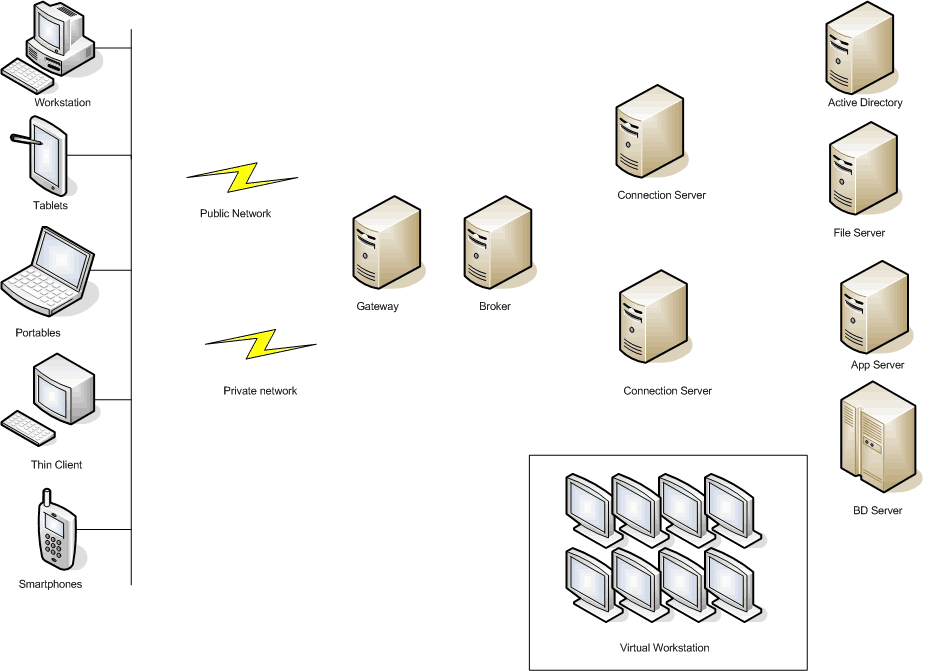


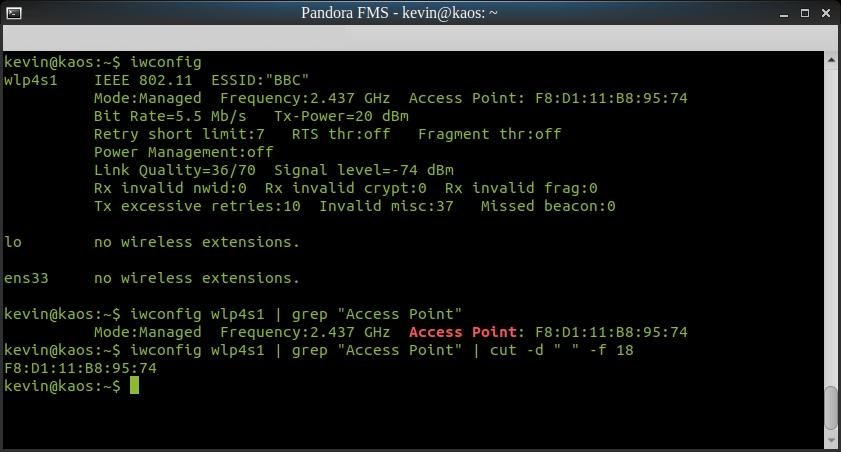

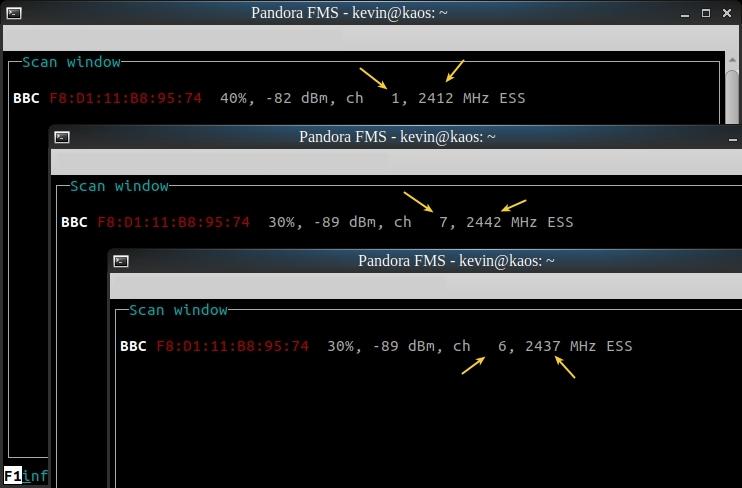
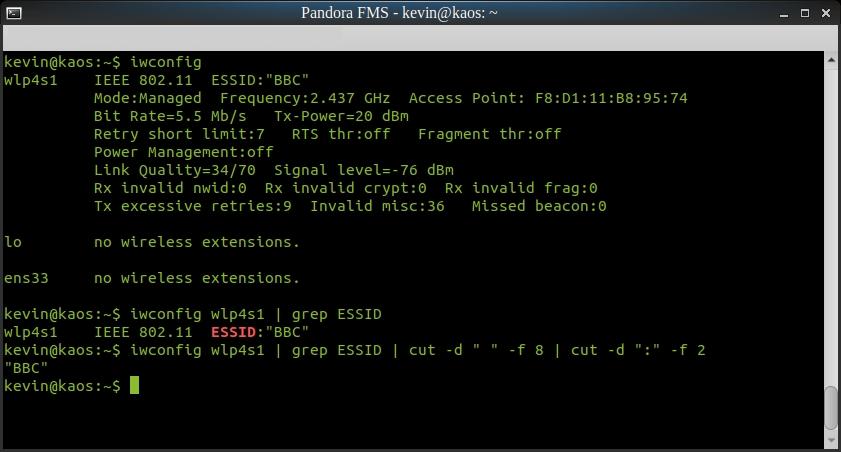


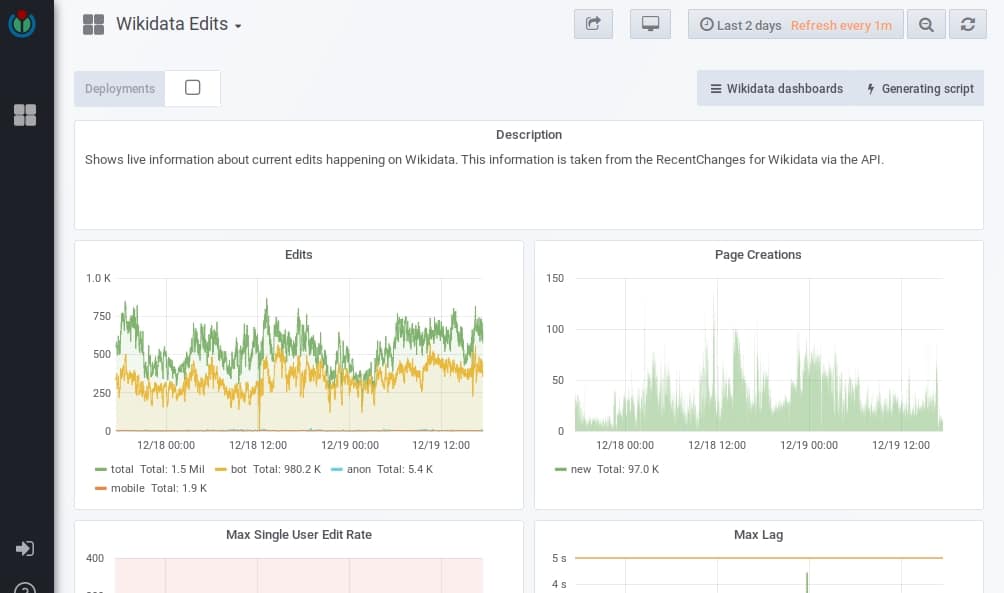
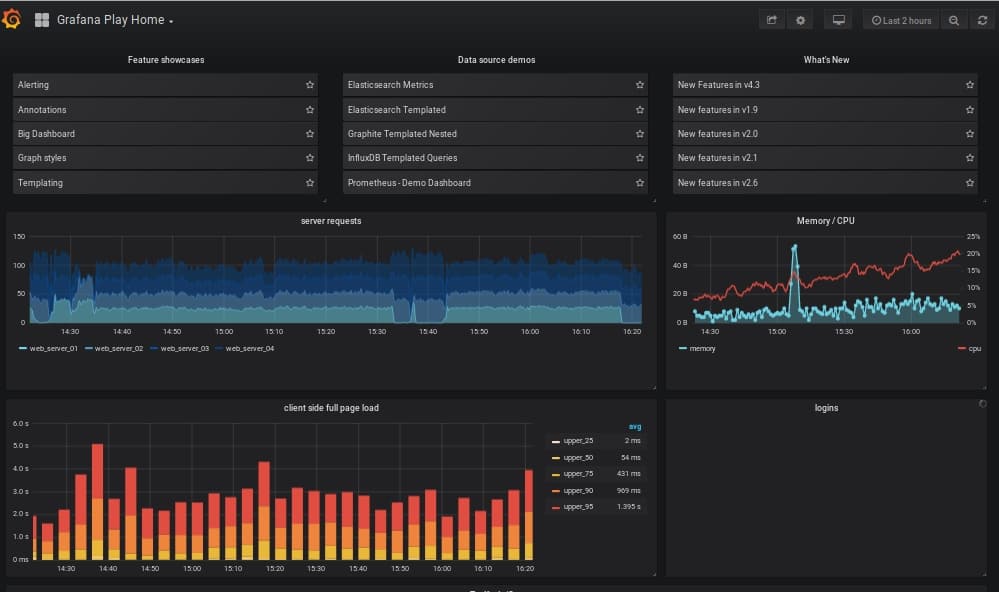
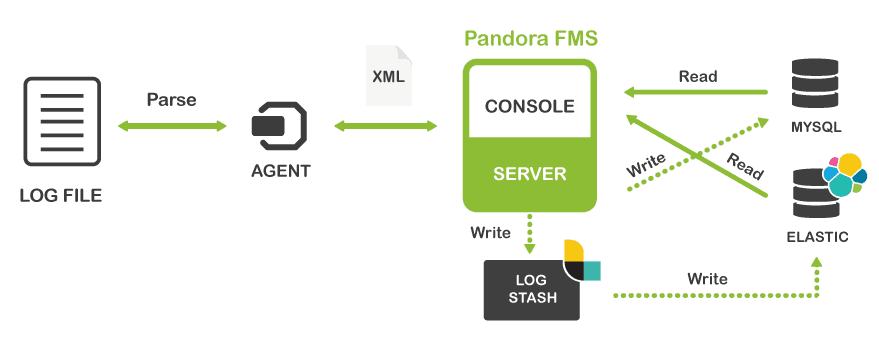 Note: Pandora FMS has a powerful web console and Metaconsole to unify them; it can run in kiosk mode and provides powerful tools associated with monitoring as a whole.
This article about Grafana is just a sample of the extraordinary flexibility of Pandora FMS, and does not signify a public endorsement of the information presented here.
Note: Pandora FMS has a powerful web console and Metaconsole to unify them; it can run in kiosk mode and provides powerful tools associated with monitoring as a whole.
This article about Grafana is just a sample of the extraordinary flexibility of Pandora FMS, and does not signify a public endorsement of the information presented here.