
Mapping and Monitoring: Always together until the end of time
Maps have been related to the management and monitoring activities of IT platforms for a long time.
Years ago, when there were no tools available to generate the graphical vision we call maps, the documentation of the device that made up the platform was usually carried in tables and diagrams where the existence of the components, their characteristics and relationships were recorded.
Tools were then developed to facilitate the creation of network diagrams and maps. These tools were very useful, but they did not make automatic discoveries so all the information had to be entered manually. Even today tools like Microsoft Visio continue to be in frequent use.
Then the network management tools introduced automatic resource discovery facilities, also offering sophisticated editing facilities for the resulting maps.
Also worth mentioning are the tools specialized in business intelligence and data visualization that use, in addition to maps, other types of tools such as graphs, diagrams and infographics. Tools such as Tableau, Qlik and Carto, among others, are popular in this area.
As for the maps in the general purpose monitoring tools, like Pandora FMS, we can say that they are one of the fundamental facilities of these tools.
Maps exist to support and facilitate the work of analysts and administrators, who use monitoring tools for daily monitoring activities and in optimization projects.
In fact, it is assumed that any monitoring tool must include the possibility of network mapping and offer a minimum of editing facilities.
On the other hand, it is common to hear about the advantages offered by other types of maps also related to monitoring, such as so-called application dependency maps or heat maps for wireless networks.
Maps and Context (in mapping and monitoring)
Maps are graphical representations of information on a spatial basis, which immediately gives context to the data being observed.
This contextualization is the key factor that makes it possible to differentiate maps from other information presentation tools such as graphs and info graphics.
For example, if the failure of a server is important to us, because it implies a risk for the optimal performance of the platform, visualizing this situation in a map immediately gives us a context.
In other words, you can tell us in which locality the condition occurs, in which network segment and which are the possible devices, users and applications involved. All this in a merely visual exercise.
Maps and their advantages (in mapping and monitoring)
From here the maps are distinguished by the advantages they offer and their potentiality.
Indeed, mapping advantages are decision factors when choosing one monitoring tool over another.
Here is a non-exhaustive list of the most common advantages:
- Automated discovery: this feature is one of the most basic and also one of the most valued.
The idea is that the monitoring tool, through the creation of maps, could “read” the platform in its entirety and present both physical and virtual elements, as well as their relationships.
Automatic discovery is efficient in that it automates human documentation activities as much as possible.
At this point we also include the fact that the map is constantly attentive to changes and modifications in the platform, so that through constant updates reflects the current situation of the platform.
It’s also interesting to mention the capabilities of maps to show changes over time, i.e. the possibility of having one map before and another map after a change in the platform.
In particular Pandora FMS maps have a waiting area where the nodes that are new in the platform appear, without warning in the maps, which results in a very practical way to be aware of the changes.
In this image we see an example of this way of reflecting the changes:
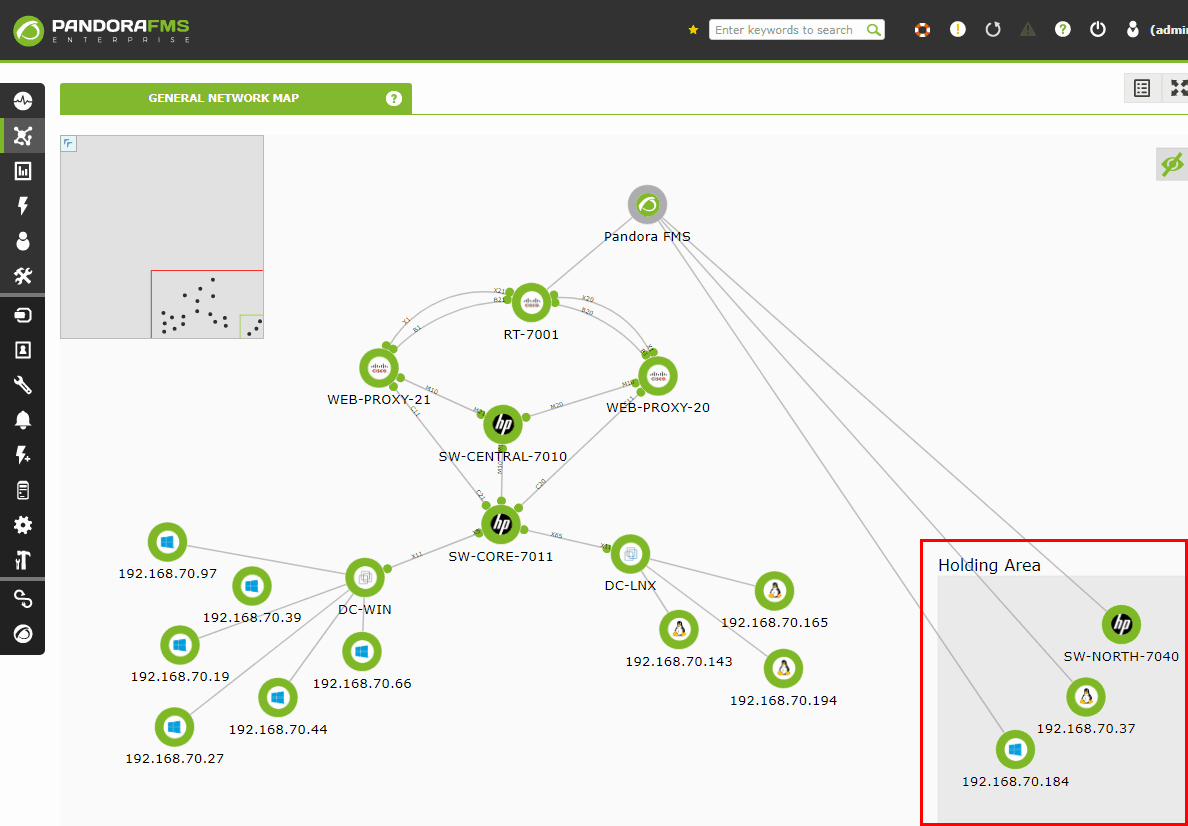
example of a map with new devices in the dock
- Low levels of bandwidth consumption: When a map makes the discovery and automatic updates implies an additional load on the platform.
This additional load is formed by the traffic associated with the protocol(s) used by the map to access device information, e.g. SNMP, WMI, CDP, VMware, Hyper-V, etc.
The idea is that this additional load is minimal to the total traffic of the platform and in no case represents a distorting factor of the performance of the platform.
- Reliability and consistency: Data consistency and a high level of resulting reliability are indispensable characteristics of any map.
The monitoring tool must ensure the consistency of the data that feeds the maps, as well as the information that is included through the map editing facilities.
This ensures that the analysis done using the map as a source of information has the same validity as the analysis performed through any other non-graphic facility. - Flexibility: This includes all the facilities that maps associated with monitoring tools can provide.
- Simplicity in the conformation of the maps; as the possibility of starting from a blank map and adding the real or fictitious devices that are necessary.
- Simplicity in the visualization; perhaps of a very extensive map we are only interested in seeing a portion or working by blocks of devices, reason why it is interesting that the map includes possibilities of approach and grouping.
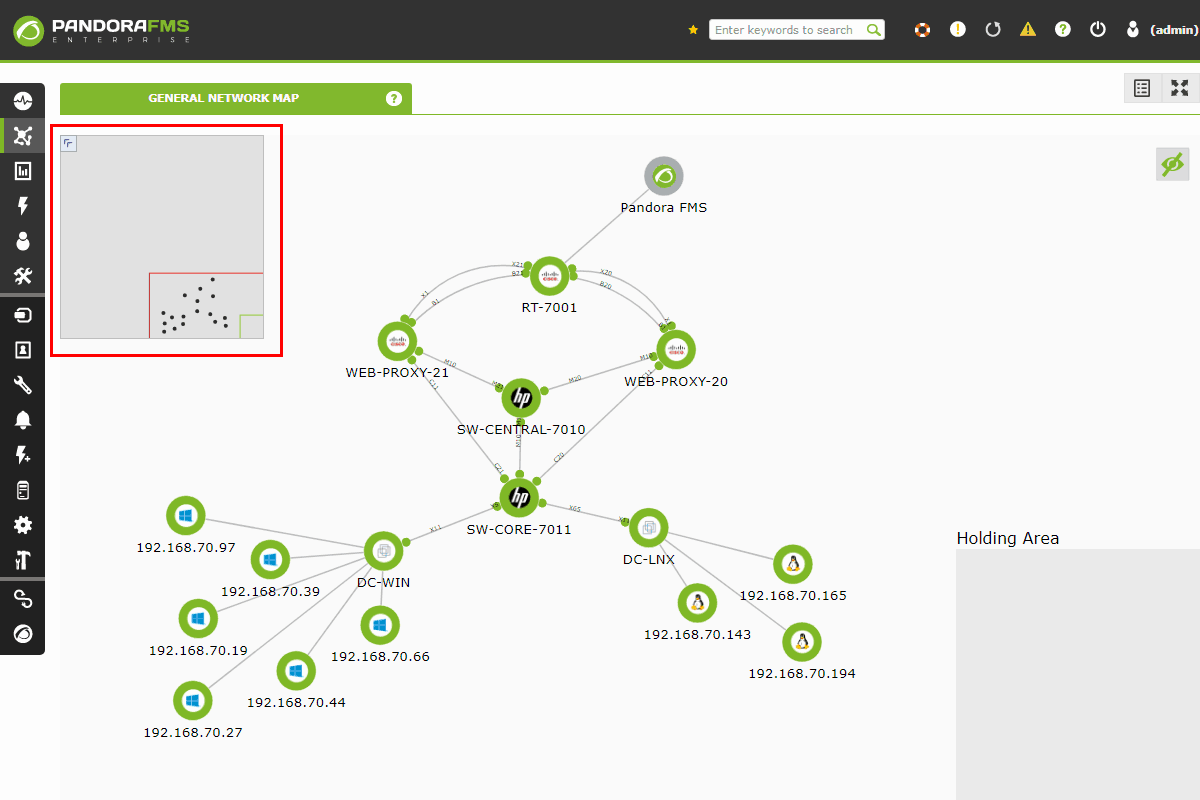
Pandora FMS network maps include a red box that shows the general map section you are working with.

example of a map with the box showing the section of the map being worked on
It is also interesting the facilities that allow us to filter elements within the map by one or more criteria. For example, we could require a network map to see only the routers, or only the SMTP servers, or in a map of application dependencies we might be interested in seeing the WEB servers associated with a particular application or a specific transaction, etc.
- Simplicity to include documentation about the devices on a map; for example including information about the vendor’s contract for that device, its purchase date and whether or not it is covered by a service contract.
We invite you to review the advantages of Pandora FMS network maps in its version 7.
- Export: The idea is that all the information associated with a map can be transferred to other business intelligence tools, for example, which requires simple export processes that include formats such as PDF, PNG, among others.
- Sharing and personalization: The maps must be able to be shared by several users of the monitoring tool and at the same time the tool must offer the possibility that each user creates the maps that are interesting to it according to the inherence of his work or to the case that it is analysing.
It is possible for maps to be treated as objects that have an integral entity and can, for example, be copied, erased or used as templates for more complete maps.
- Scalability: As with any monitoring tool, maps must be able to scale easily given the growth of the platform and the inclusion of new technologies.
Maps and the future (in mapping and monitoring)
Maps will continue to be one of the most important facilities of monitoring tools, so they must adapt to changes in the world of technology.
In fact, different virtualization schemes, software defined networks and the tendency to implement hybrid platforms (proprietary – cloud) are challenges for maps.
It is also expected that the maps will contribute to the analysis that is carried out. We have recently seen an interesting fit with application performance analysis.
Application dependency maps are intended to provide information about the hardware and software components that are part of each of an organization’s applications, making it easier to find the causes of a problem and multi-layered analysis of the performance of the application in question.
In the future we will undoubtedly see efforts from the developers of monitoring tools tending to build up the capabilities of their maps.
For now, we invite you to share how useful you make maps and what you would expect from them in the future.
You can ask for more information about Pandora FMS in this link:
https://pandorafms.com/contact/

Pandora FMS’s editorial team is made up of a group of writers and IT professionals with one thing in common: their passion for computer system monitoring. Pandora FMS’s editorial team is made up of a group of writers and IT professionals with one thing in common: their passion for computer system monitoring.