We’ve spoken before on the blog about the importance of not only backing up your data (and the various Cloud-platforms available to do so) but also about the added importance of monitoring your backup systems. A rock solid system will allow you to find out immediately if there is any problem in your backup generation system, and furthermore, to anticipate issues before they turn into data extinction level events.
Exponential growth of IT systems puts all companies, large or small, at risk of seeing their IT assets, services and, most crucially, data, compromised. Growth such as this far outruns attempts to secure completely your systems, leaving them vulnerable to cybercriminals, so-called “blackhats”, capable of causing problems throughout your IT infrastructure.
Apart from targeted attacks on behalf of malignant hackers, there is also the daily struggle with viruses, trojan horses, and worms, capable of automatic, self-propagating attacks. The recent WannaCry virus, a species of ransomware that has been a thorn in the side of a number of global companies and individuals, is a reminder of what’s out there.
For all these motives, IT security chiefs are obligated to stay on their toes, as are the systems they administrate. To do this, two components are imperative: backups and monitoring. These two safeguards work best when combined, and the present article looks at how to monitor a backup system with Pandora FMS.
We’re taking Bacula as our solution for this case. Bacula is one of the most well-known and powerful OpenSource products on the market. The following tutorial assumes that you are already using Pandora FMS and Bacula, or that you think it could be a good solution for your present back up needs.


Bacula components
Before starting to monitor Bacula, a few words about how it works. The basic concepts are:
- Director: the central server or component that executes the jobs.
- Jobs: tasks, whether carrying out or recovering backups.
- Bacula-fd: daemon file, or client. Systems to be backed up.
- Bacula-sd: storage daemon, or fileserver. The physical location of the backups.
- DataBase: to store metadata on all tasks performed.
With this basic outline in mind, let’s take a look at how to monitor Bacula using Pandora FMS.
Local Monitoring
Firstly, check all the Bacula components are running A-OK monitoring them individually using software agents, i.e. installing a service on the machines to make sure all the Bacula services are running.
The software agent uses commands like the one below:
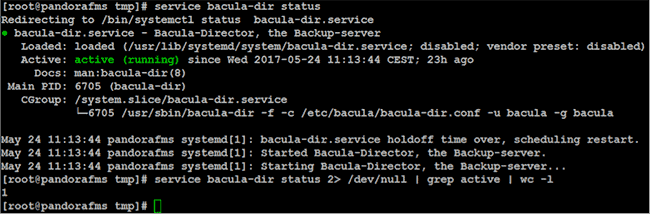
The command will vary slightly, depending on the component being monitored. The local module looks something like this:
module_begin

module_name Bacula director status

module_type generic_proc

module_exec service bacula-dir status 2> /dev/null | grep active | wc –l

module_description Check if bacula-dir service is up and running

module_end
Also included are basic checks to ascertain the machine’s overall status: CPU, memory and disk use. The Pandora FMS console displays the results like this:
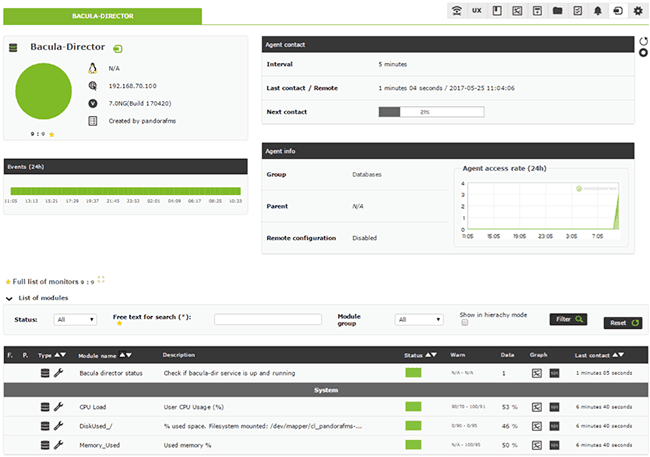
You can monitor the most essential Bacula components like this, and get total control over anything that could affect your backups.
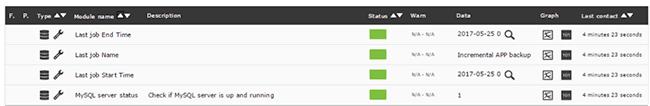
Once you know the status of your machines and services you’re ready to extend your monitoring with the Bacula monitoring plugin. This simple little agent plugin internally monitors the MySQL database, mining the metadata saved from the previous backup tasks for useful nuggets.
With the agent monitoring the MySQL database from inside it’s easy to extend the logic to include a higher number of checks and more granularity, as well as configuring the output to display timers showing hours, days, etc.
Remote monitoring
With a little more Bacula knowledge, it’s possible to set up remote network checks for certain components.
Analyzing how Bacula works you can see that the different components communicate among themselves via specific ports, which we can make use of. Using remote TCP checks launched from your Pandora FMS server you can monitor services and check they are running in each of their corresponding locations:
- bacula-dir: port 9101.
- bacula-fd: port 9102.
- bacula-sd: port 9103.
- MySQL database: port 3306.
Bacula and MySQL use these ports by default, and we’ll also use them in this case, although they can be modified in the corresponding config files.
Pandora FMS’s remote checks come in handy here for checking that all the posts are open and active. Once the modules have been created their configuration looks like this:
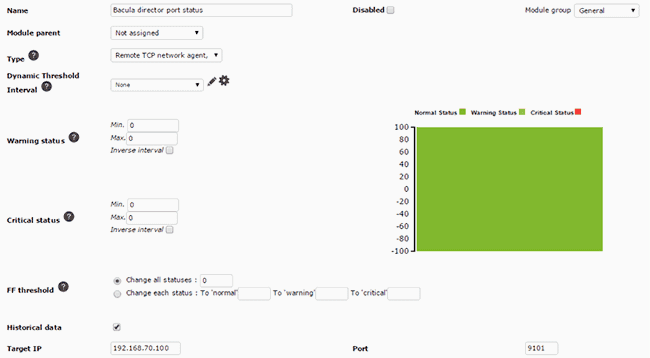
In the previous example we used port 9101, corresponding to the Bacula-director, and we continue in the same way for the other ports, maintaining remote oversight of all running services.
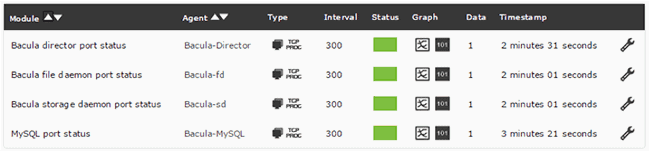
Remote checks look like this on the Pandora FMS console:

Under best practise mandates, the nomenclature used is similar to the default, resulting in simpler filtering and quicker locating of the remote checks to see whether the Bacula services are running correctly:
Another way to remotely monitor Bacula, without having to install agents, is through its web console, where statistics and metrics related to tasks performed by Bacula are displayed.
The management console enables you to get information on automatically generated Bacula reports, using Pandora FMS:
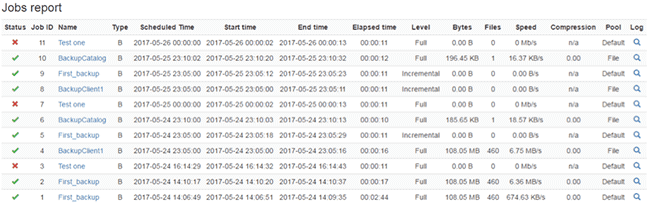
Viewing general backup task data:
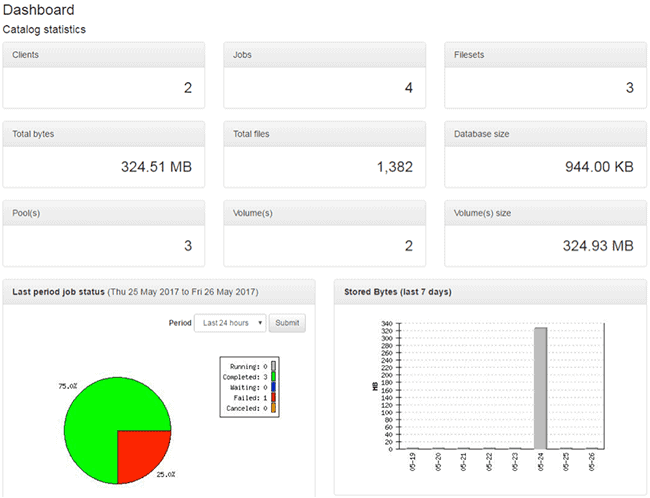
Some examples of the many options that using Pandora FMS web monitoring enables.
Flexibility
Apart from the previously mentioned methods of monitoring, Pandora FMS is known for its flexibility and multiple options, meaning you can adapt your monitoring to your system or company’s needs.
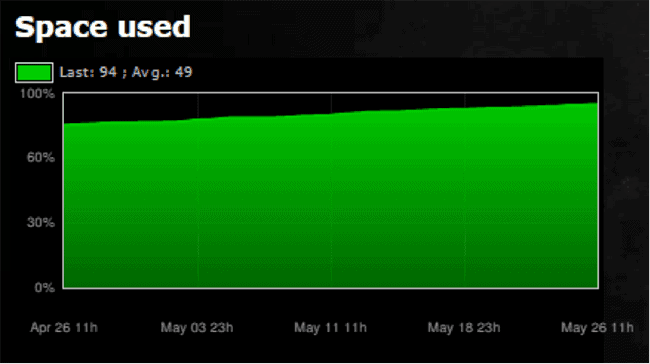
Pandora FMS’s power and flexibility permit many different approaches to monitoring your tech (in this case, backups). Another option could be to monitor logs, searching for execution codes, error registries, warnings, etc. Monitoring the Bacula web console, retrieving all kinds of metrics, monitoring how much space your backups are taking up on your Bacula-sd server, monitoring connections among Bacula services using netstat, and so on.
Pandora FMS gives you complete control and oversight of your backups, graphs and reports to observe if any problems have occurred, how frequently, and the trend over time. Furthermore, with predictive modules you can monitor the filesystem and find out how long it takes to fill up, in order to give you an extra heads up when it comes to taking decisions about whether to increase space or clean up old backups:
About Pandora FMS
Pandora FMS is a flexible monitoring system, capable of monitoring devices, infrastructures, applications, services and business processes.
Of course, one of the things that Pandora FMS can control is the hard disks of your computers.
Would you like to know more about what Pandora FMS can offer you? Discover it by entering here: https://pandorafms.com
If you have more than 100 devices to monitor, you can contact us through the following form: https://pandorafms.com/en/contact/
Also, remember that if your monitoring needs are more limited you have at your disposal the OpenSource version of Pandora FMS. Find more information here: https://pandorafms.org
Do not hesitate to send us your queries. The Pandora FMS team will be happy to assist you!
Do you want to know more about application monitoring?
Pandora FMS Enterprise is capable of monitoring the most popular applications and databases. Click here and find out…

Pandora FMS’s editorial team is made up of a group of writers and IT professionals with one thing in common: their passion for computer system monitoring. Pandora FMS’s editorial team is made up of a group of writers and IT professionals with one thing in common: their passion for computer system monitoring.