by Pandora FMS team | Last updated Apr 29, 2025 | Community, Pandora FMS
Madrid, April 2025 – The monitoring and observability platform Pandora FMS has been recognized in 35 leading reports in the G2 Spring 2025 edition, solidifying its position as one of the most versatile solutions for managing complex IT infrastructures, hybrid environments, and critical operations.
This recognition reflects the trust of thousands of technical professionals who value its performance, scalability, and adaptability across industries such as telecommunications, manufacturing, public administration, and digital services.
Over 270 Mentions and 35 Key Reports
Pandora FMS has been featured in 277 G2 reports, with a standout presence in 35 of the most influential ones, categorized by function, region, business segment, and performance index.
Top Functional Categories:
- Enterprise Monitoring
- Cloud Infrastructure Monitoring
- Server Monitoring
- Log Monitoring
- Application Performance Monitoring (APM)
- Database Monitoring
- IT Alerting
- Remote Monitoring & Management (RMM)
- SIEM (Security Information and Event Management)
Regional and Segment-Based Reports:
- EMEA Regional Grid® Reports
- Small-Business, Mid-Market y Enterprise Grid® Reports
Performance Indexes:
- Usability, Results, Relationship, Implementation, Momentum Grid®
Cybersecurity Focus: 5 Key SIEM Reports
This year, Pandora FMS strengthens its momentum in the cybersecurity space with simultaneous recognition in five key SIEM reports:
- Momentum Grid®
- Enterprise Grid®
- Small-Business Grid®
- EMEA Grid®
- Usability Index for SIEM
This progress reinforces Pandora FMS’s commitment to security-focused monitoring with early threat detection, event correlation, log analysis, and end-to-end visibility, aligned with regulations like NIS2 and DORA, both centered on digital resilience and traceability.
“Thanks to Pandora FMS, we track our construction equipment in real time, including excavators and cranes. It’s been crucial to preventing critical failures.”
— Loring D., Process Engineer
Verified Reviews: High User Satisfaction
User ratings collected on G2 emphasize an outstanding user experience:
- 98% believe the product is headed in the right direction
- 94% highlight the ease of doing business
- 94% say it meets their requirements
Feedback from Verified Users:
“It helps us ensure system uptime and improve incident response from a single console.”
— Henry R., IT Administrator
“What we value most is the customization. We create tailored dashboards and integrate with Slack and Jira with no hassle.”
— Nina S., Mobile Developer
“As an internet provider, we need to ensure the availability of our servers. Pandora FMS covers everything—network, servers, applications, and web services.”
— Christian N., IT Security Supervisor
“A true AIO (All-In-One) software that lets you manage everything from a unified console—with maps, alarms, auto-discovery, and excellent support.”
— Pedro G., Developer
A Modular, Scalable, and Vendor-Neutral Solution
With a modular, cross-platform, and vendor-neutral approach, Pandora FMS adapts to:
- On-premise, cloud, and hybrid environments
- Legacy systems and modern container-based infrastructures
- Monitoring of networks, servers, databases, logs, applications, and business processes
- Integration with ITSM tools, CMDBs, DevOps platforms, and alerting systems
All managed from a single control panel to enhance visibility, reduce incidents, and support better operational decision-making.
“Pandora FMS automates repetitive tasks and enables us to deliver high-quality service in demanding environments.”
— Omar B., Electrical Engineer
Leading Positions in G2® Spring 2025 Reports
With 277 total reports and 167 badges, Pandora FMS has reached an unprecedented level, earning the #1 position in over 25 key reports, outperforming long-established competitors across multiple functional and user experience categories.
Reports Where Pandora FMS Ranks #1:
- Momentum Grid® Reports: APM, Enterprise Monitoring, IT Alerting, Server Monitoring
- Usability Index: Server, Enterprise y Cloud Infrastructure Monitoring, SIEM
- Results Index: SIEM
- Small-Business Grid® Reports: Enterprise Monitoring
- Mid-Market Usability Index: Enterprise Monitoring
- Enterprise Relationship Index: SIEM
Reports Where Pandora FMS Ranks Second or Third:
- Momentum Grid® Report for Cloud Infrastructure Monitoring
- Relationship Index for Database Monitoring
- Usability Index for APM
- Implementation Index for SIEM y Network Monitoring
- Results Index for Cloud Infrastructure Monitoring
- Small-Business Relationship Index for SIEM
These achievements position Pandora FMS as one of the top-rated solutions for technical performance, user experience, scalability, and support.
Spanish Technology with Global Reach
“The G2 results validate our team’s ongoing effort to build a flexible, scalable platform focused on technical users. We continue listening to our customers to evolve alongside them.”
— Kornelia Konstantinova, CMO at Pandora FMS
With over 50,000 active installations in more than 60 countries, Pandora FMS continues to grow as a solid alternative to global vendors, helping organizations of all sizes build more resilient, efficient, and secure infrastructures.
Want to Learn More?
Visit Pandora FMS’s official G2 profile and discover why thousands of users consider it one of the most complete and effective solutions on the market.
Read reviews on G2 →

by Pandora FMS team | Mar 11, 2025 | Pandora FMS, Releases
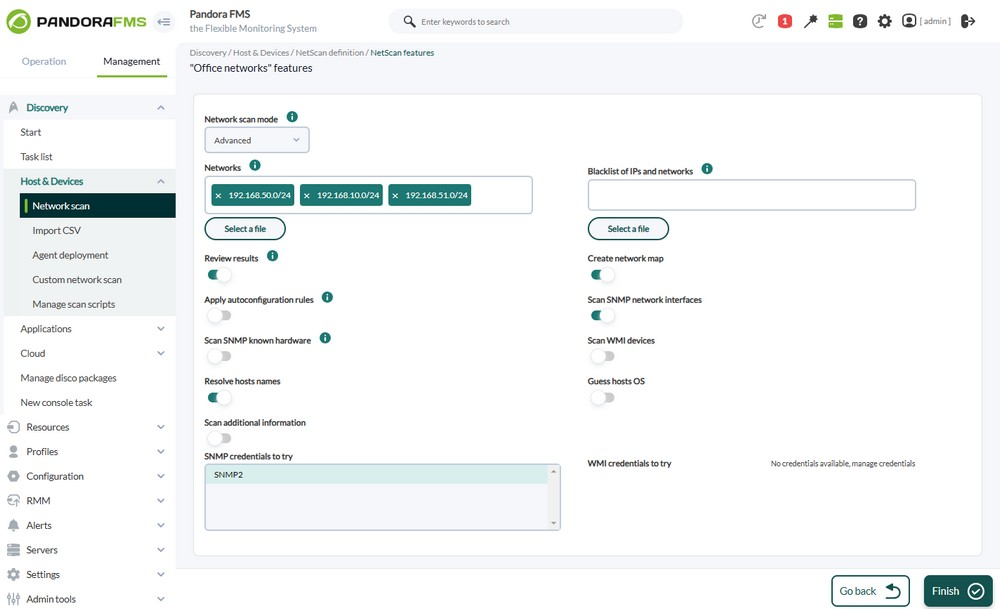
In the recent NG 781 RRR update, Pandora FMS has significantly enhanced its Discovery system with the powerful NetScan feature, making it even easier to automatically detect and comprehensively monitor technological assets in complex networks.
What’s New with NetScan in Discovery?
NetScan enables automatic device discovery in networks, determining their topology, and applying monitoring immediately. This feature may be configured in two modes, tailored to different needs:
- Simple Mode: It automatically detects all networks accessible from Pandora FMS server through traceroute to the Internet (8.8.8.8), a review of the local routing table, and direct scanning of connected networks.
- Advanced Mode: It allows detailed parameter customization such as specific networks (CIDR), exclusion of particular IPs, advanced SNMP scanning, WMI, name resolution, and operating system detection.

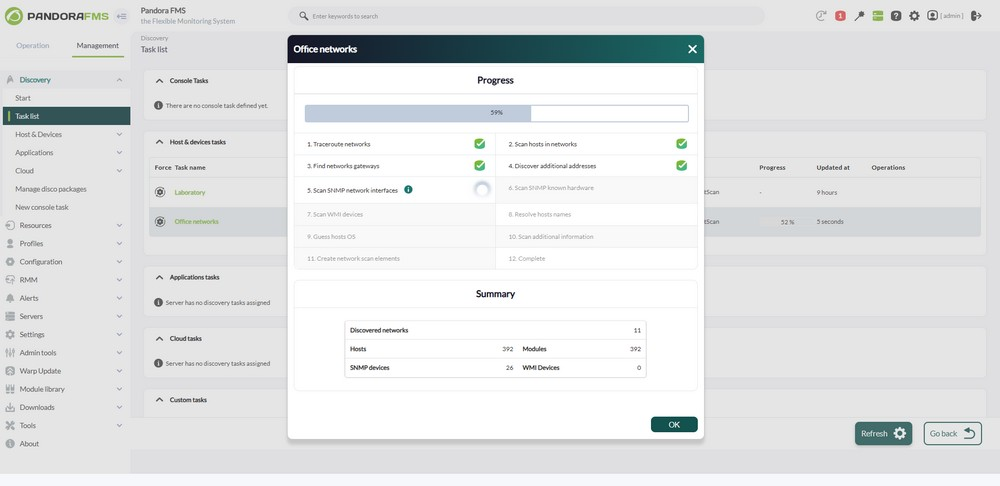
Key Advantages of the Updated Discovery
- Automation and Speed: It significantly reduces the time spent on manual processes.
- Validation and Control: Manually verify which assets are added after the scan.
- Automatic Network Maps: Instantly visualize the topology of discovered assets.
- Advanced Auto-Configuration Rules: Automatically apply specific policies, execute scripts, or trigger custom events based on detected assets.
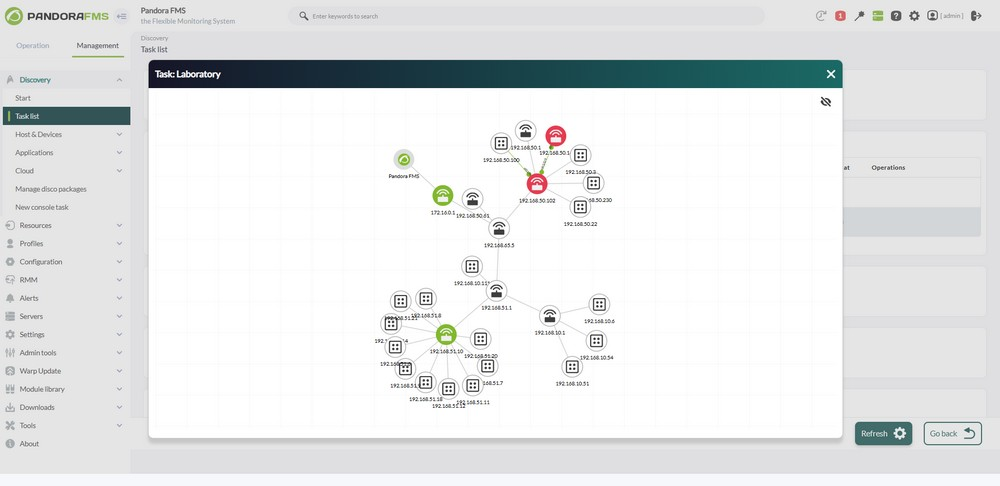
Visual and Functional Improvements in Network Maps
Network maps have been redesigned to offer a better visual experience and navigation:
- Intuitive Grid for Relocation and Organization: It simplifies arranging and managing network elements.
- Clear Visible Boundaries: It enables more precise asset management.
- Dynamic and Optimized Generation: It uses methods like spring 1 and radial dynamic for efficient map creation.
These maps are synchronized with Discovery results, updating automatically with each scan execution.
How to Get the Most Out of It
This version is specially conceived for administrators managing large or dynamic environments, optimizing resources through the automation of initial asset discovery and enabling a more proactive and strategic monitoring approach.
The Discovery update in Pandora FMS NG 781 RRR transforms operational management, significantly boosting efficiency from day one.
Explore all the new features in our full release notes and start optimizing your monitoring today!

by Isaac García | Mar 10, 2025 | Pandora FMS
I have a not-so-secret suspicion that the dream of everyone working with technology is the Enterprise computer from Star Trek. Controlling shields, communications, engines, and everything else from a single place—and with voice commands, no less. “One button to rule them all,” as Sauron might whisper. But until that utopia becomes a reality, at least we can implement a hyperconverged infrastructure (HCI) in our organization’s technology stack.
This hyperconverged infrastructure allows unified management of:
- Computing.
- Networking.
- Storage.
It may not be as exciting as warp drives or interstellar navigation, but the real question is: how do we manage such different aspects in a homogeneous way?
With a common solution in technology: creating an abstraction layer. By introducing an intermediary—a software layer that consolidates all these disparate components through virtualization. The hypervisor, as part of this virtualization, acts as the enabler that allows all these resources to be managed from a single location. A sort of universal translator, another Star Trek dream.
Thus, multiple technologies (hyper)converge into a unified control and management system.
This isn’t just a technological evolution—it’s a paradigm shift: switching from managing individual components to orchestrating a cohesive system, where the infrastructure responds as a whole.
Advantages of a Hyperconverged Infrastructure Over a Traditional One
For those dealing with the heterogeneous chaos of a traditional IT infrastructure, the previous explanation may have sparked a few lightbulbs, highlighting the benefits of such a solution, including:
Simplicity. In both infrastructure and management, meaning there is no need to have in-depth knowledge of each individual component, integrate heterogeneous hardware, or track countless firmware updates. Instead, you only need to understand the software that manages everything.
Let us look at a simple comparison to illustrate this advantage:
|
Traditional Infrastructure
|
HCI
|
|
Fragmented Silos: Physical servers, storage (SAN/NAS), and networks managed by separate teams and tools.
|
Unification: Computing, storage, and networking integrated into standardized nodes managed by software.
|
|
Example: A VMware cluster with NetApp storage and standalone Cisco switches.
|
Example: Nutanix or VMware vSAN, where storage is distributed across local disks within nodes.
|
Scalability. Being able to resize modularly or add and remove features as needed, in a faster and more cost-effective manner. For instance:
|
Traditional Infrastructure
|
HCI
|
|
Adding storage requires expanding the SAN, while scaling computing power involves adding new servers.
And that comes with the risk of overprovisioning, as capacity is purchased “just in case.”
|
Adding standardized nodes increases all resources (CPU, storage, and network) simultaneously.
In this case, we scale on demand, without wasted resources (or their associated extra costs, of course).
|
Efficiency. It enables centralized and simplified management, automation, and reduced hardware usage.
|
Traditional Infrastructure
|
HCI
|
|
Multiple consoles: vSphere for VMs, NetApp OnCommand for storage, Cisco Prime for networking…
|
Unified management: A single interface for provisioning, managing, and monitoring the whole infrastructure.
|
|
Slow response times: Coordinating teams to solve incidents.
|
Native automation: Predefined policies (e.g., auto-repair of nodes).
|
When it comes to choosing an HCI solution, each organization must consider its needs and how the different available options align with them. Some of these options include:
- VMware vSAN. Particularly suited for those already familiar with VMware solutions.
- Nutanix. Ideal for organizations heavily relying on cloud and multi-cloud infrastructures.
- Microsoft Azure Stack HCI. Integrated within Azure Local, catering to the widespread Redmond ecosystem in many organizations.
- HPE SimpliVity. Focused on AI-driven management, a growing trend in these solutions.
However, regardless of the chosen solution, they all share a common challenge…
The Challenge of Monitoring Hyperconverged Infrastructures
The biggest advantage of HCI is that everything is in one place. Its biggest challenge is also that everything is in one place.
No, that was not a typo.
The fact that all critical components are centralized presents a major challenge in monitoring them effectively due to the sheer number of different factors to control.
Everything falls under a single umbrella, but that “everything” is vast, and the sheer volume of information and data can be overwhelming. This is where the concept of metric overload comes into play—when faced with an ocean of indicators, identifying the crucial data points becomes essential, but also incredibly complex.
This is where the critical value of a specialized monitoring system comes in. Much like how HCI simplifies infrastructure management, a tool like Pandora FMS makes it easier to monitor multiple key variables efficiently, ensuring visibility and control over the entire system.
Challenges in HCI Monitoring and Observability
Those working with Hyperconverged Infrastructures (HCI) often encounter common issues due to the nature of the solution, as some critical layers become somewhat more opaque due to integration.
This creates monitoring challenges, such as:
- Lack of visibility into HCI performance. It’s great that everything works in a unified manner, but is it actually performing well? Do we have key performance indicators (KPIs) readily available? Are there automated alerts to notify us immediately when something goes wrong?
- Difficulties in predicting performance degradations. For example, two virtual machines (VMs) competing for storage on the same HCI node can easily degrade the overall infrastructure. But how do we know if this will happen? And more importantly, how can we confirm if this is the actual cause of the performance drop we are experiencing?
- The need to correlate metrics across storage, networking, and virtualization.
- Lack of granular visibility. If we are experiencing latency issues, for instance, how do we determine whether there is a bottleneck in the underlying physical network or a software-related problem?
- The issue of component interdependence. Since a failure in an HCI node simultaneously impacts compute, storage, and networking, it can trigger a domino effect across the entire infrastructure.
- Metric overload. Monitoring not only VMs/containers but also hypervisors, distributed storage pools, East-West internal traffic, or Quality of Service (QoS) policies can quickly overwhelm monitoring systems.
How Does Pandora FMS Help with HCI Monitoring?
Pandora FMS serves as the key to overcoming these challenges because we have experienced them firsthand—and that frustration led us to develop an expert solution. While HCI solutions include built-in monitoring, they often come with common limitations:
- Basic capabilities. Most HCI platforms offer simple monitoring, preconfigured alerts, and limited integrations. These are useful within their own ecosystem, but when external technologies come into play, collaboration becomes impossible.
- Fragmented visibility. Many HCI monitoring tools lack data correlation from other infrastructures. What happens if we cannot avoid that legacy server in the basement—the one nobody knows how it got there, but is still critical and marked with the terrifying sign: “Do not unplug”? Additionally, dashboards remain fragmented in a multi-vendor environment (e.g., Nutanix + Proxmox).
- Limited customization. Many tools fail to provide custom alerts tailored to an organization’s specific operations.
This is where a tool like Pandora FMS, designed for expert monitoring of hyperconverged infrastructures (HCI), provides the ideal solution by enabling:
- Real-time observability. Unified multi-environment metrics, since HCIs rarely exist in isolation. Pandora FMS ensures seamless monitoring across hybrid and multi-cloud environments.
- Virtualization monitoring. Thanks to its native integration with VMware, Proxmox, Nutanix and KVM.
- Storage and network supervision. Tracking latency, availability, and resource usage.
- Anomaly and incident detection. Featuring event correlation and advanced alerts that identify root causes, not just detect symptoms.
- SIEM and log integration. Providing security and event auditability, key for critical industries operating under NIS2 regulations, which require strict compliance and controls. Without proper log unification good luck explaining missing data to an auditor who, for some reason, never blinks.
- Trend analysis and capacity planning. With the implementation of machine learning for optimizing that capability more simple and adequate.
When it comes to something as critical as monitoring hyperconverged infrastructures (HCI), it’s not just about “calling in the specialist”—like Pandora FMS. Its implementation goes even further, as it allows you to centralize all critical information, not only from HCI but also from other key technological elements such as laptops, additional servers or even mobile devices.
This naturally completes the HCI philosophy, because in a way, Pandora FMS enables the hyperconvergence of monitoring itself in a single, unified place.
The long-awaited “One Ring” to monitor them all.
(Pandora FMS does not include a magic ring. Our legal team insists we clarify this.)
Benefits of Using Pandora FMS in HCI Environments
The quality of decisions depends on the quality of the information available to make them. This is one of the key strategic advantages that Pandora FMS provides.
When monitoring Hyperconverged Infrastructures (HCI), this translates into direct benefits such as:
- Faster incident response times.
- Optimized performance and failure prediction.
- Enhanced security through event correlation and suspicious activity monitoring.
- Compatibility with multiple technologies without requiring additional tools.
- Reduced operational costs, through automation and better resource allocation.
- Scalability without impacting operations
And above all, a sense of control, sanity, and peace of mind—because you always know exactly what’s happening.
In an increasingly complex and diverse environment, hyperconverged infrastructures help optimize and simplify. And just like in Inception, the film by Christopher Nolan, we can take one level deeper in this journey toward hyperconvergence—by optimizing and simplifying the monitoring of these infrastructures with Pandora FMS.
Without this, operating efficiently and staying at the forefront of our industry would be impossible.
If you want to learn more about Pandora FMS in Hyperconverged Infrastructures, do not hesitate to contact us, we will prove these words with actions.

by Isaac García | Mar 3, 2025 | Pandora FMS
Endpoints are the primary target of cyberattacks. The most conservative estimates indicate that between 68% and 70% of data breaches begin on these devices. This is why implementing an EDR (Endpoint Detection and Response) solution is crucial to protect them in today’s cyber threat landscape.
An EDR is an advanced security tool installed on the end devices of the technological infrastructure (personal computers, servers, phones…) that monitors their activity in real-time, providing visibility into exactly what is happening on each of these endpoints.
This makes it possible to detect, analyze, and respond to security threats proactively and smartly. In case of an incident, it also allows the response team to have all the necessary information to dig into and solve the issue.
This goes beyond the capabilities of a traditional antivirus, which is normally used to protect some endpoints but falls short in the current security context faced by organizations.
How an EDR Works
The features of an EDR and the level of endpoint security they provide ultimately depend on each manufacturer, but they all rely on three fundamental pillars, which help to understand how they work and the protection they offer:
- Activity monitoring on a steady basis: This includes everything from processes to device connections, collecting data and analyzing it intelligently.
- Threat detection: When the monitoring system detects abnormal behavior, such as lateral movements, malware, phishing attempts, and other malicious actions.
- Automated response to threats: This may involve isolating the compromised device from the rest of the network, blocking suspicious processes, or deleting harmful files.
EDRs differ from traditional antiviruses not only in their detection capabilities (being able to face unknown and sophisticated threats) but also in their response capabilities, such as isolating a device from the network. On the other hand, antivirus usually quarantines or deletes an infected file at best.
For instance, a malicious actor might create a new type of malware conceived to retrieve critical data from an organization, such as credentials or privileged information.
While an antivirus might not recognize malware and allow it to operate unchecked, an EDR can detect malicious file’s activity, such as data leaks. It can then stop the process if it detects an unknown connection and a massive flow of data going to it.
A similar situation could take place if data exfiltration is attempted by a disgruntled employee without any malware involved.
A certain user might try to copy information to an external device. While an antivirus wouldn’t react to this, an EDR could detect the connection of a USB drive or the unusual behavior of a large-volume data transfer, and then take the appropriate action against this suspicious activity.
Differences Between Security Management and Infrastructure Management
To ensure optimal endpoint protection and overall system security, it is key to understand the difference between these two concepts and ensure they are aligned.
Infrastructure management aims to ensure that the technological environment works properly and supports the organization’s goals. However, this objective is compromised if security is not also a key consideration.
On the other hand, security management involves implementing measures and policies to protect the infrastructure, such as integrating SIEM (Security Information and Event Management) and EDR (Endpoint Detection and Response) solutions. However, it is not the same to secure a straw building thrown together haphazardly as it is to protect a well-planned stone castle.
Likewise, an adequately managed technological infrastructure will make the following possible:
- Security management.
- Integrated operation of EDR and SIEM.
- The effectiveness of the blue team, if present.
- Incident response.
Let’s look at an example illustrating the difference between a well-managed infrastructure and an unprotected one.
Imagine an environment with proper network segmentation, strong device access controls, and a consistent patch management policy.
Even if an infrastructure element fails (for instance, a delayed firmware update on an IoT device due to a vulnerability), if that device has been configured with appropriate network and access policies, it will still contribute to overall security. This setup reduces the likelihood that a malicious actor who compromises that endpoint can move laterally to another, more critical part of the network.
Moreover, if this proper infrastructure management is combined with effective security management using an EDR integrated with a SIEM solution, any attempt at unusual lateral movement would be detected, alerted, and mitigated.
Conversely, if that IoT device still uses the default username and password (an all-too-common situation unfortunately) or has unrestricted network access, a malicious actor will have significant opportunities to move through the network to critical systems or compromise the device in other ways, such as spying through a webcam.
Infrastructure Management Approaches to Strengthen Security
Continuing with the previous analogy, how do we build our castle with robust stone and a resilient design?
An effective infrastructure management strategy would involve the following practical approaches:
- Strict update and patching policies: To prevent malware or exploit techniques from taking advantage of vulnerabilities in outdated versions. This includes updating both software and firmware on endpoints.
- Optimal network design: By properly segmenting networks and ensuring that each device has access only to what is strictly necessary for its function—both in terms of data and communication with other devices.
- Implementation of SIEM solutions: To collect data on what is happening within our infrastructure, consolidate that information for the Network Operations Center (NOC) analyze it, and alert on any suspicious activity.
- Log monitoring and analysis policies: To detect anomalies within those logs. Currently, security policies allow companies to meet the highest security standards and certifications, such as ISO 27001 as well as government regulations like the new NIS2, which is being implemented by lots of companies.
With these measures in place, our infrastructure becomes more resilient to attacks while continuing to fulfill its primary purpose: supporting organizational goals and workflows.
There is often talk of having to choose between security and convenience or security and performance, but this is a false dichotomy. Proper infrastructure management supports both security and operability—there is no need to choose between them. While system infrastructures and hybrid environments make it hard to get a unified overview, Pandora FMS unifies data sources and allows centralized management.
How Different EDRs and Antivirus (A/V) Solutions Approach Security
Although we often talk about EDRs and antivirus solutions as two general approaches to endpoint security, not all products are created equal.
Therefore, it is essential to understand the key features of each solution and how they may vary depending on the manufacturer.
|
EDR
|
Antivirus
|
|
Constant activity monitoring on endpoints to detect suspicious behaviors.
|
It scans files and applications looking for known malware brands.
|
|
It uses behavioral analysis to identify unknown threats.
|
It uses file definition databases to identify known malware.
|
|
Some options use predictive AI, such as Pandora FMS, to detect and make decisions.
|
Some manufacturers use heuristics (suspicious behavior predefined rules), an older technology that generates more false positives.
|
|
Sophisticated automated response: it may isolate devices, block suspicious processes and generate advanced alerts (the scope of said response will depend on the features of each manufacturer).
|
Limited automated response to quarantine or infected file deletion.
|
|
Advanced forensics capabilities, logging everything that happened to make audits easier as well as the work of the incident response team.
|
Forensics capabilities limited to logging basic detections.
|
|
Active and reactive protection.
|
Reactive protection based on the definition file.
|
|
High integration capacity with SIEM and the infrastructure in general.
|
Limited integration.
|
This last aspect of SIEM and EDR integration is critical today and the key to security in such a constantly evolving environment.
However, on the other side of the scale, the capabilities of antivirus solutions are much more limited, both in terms of the information they can send to a SIEM and their integration capacity with these systems. Additionally, some antivirus solutions are prone to compatibility issues with the rest of the technological or security infrastructure, leading to conflicts with firewalls or other protection tools.
Advantages and Disadvantages of an EDR Compared to a Traditional Antivirus
The above does not mean that everything is that positive in the case of EDRs, so an impartial analysis should put these advantages on the table, but also the disadvantages and challenges.
Advantages of an EDR Compared to an Antivirus
- Advantages of an EDR Compared to an Antivirus against both known and unknown threats.
- More advanced automated incident response capabilities.
- Enhanced security management through detailed visibility into exactly what is happening on each endpoint.
Disadvantages of an EDR Compared to an Antivirus
- More complex to implement and manage.
- It requires skilled personnel to interpret and respond to incidents, as well as for installation and integration, especially in on-premise solutions.
- Generally higher cost.
Advantages of an Antivirus Compared to an EDR
- Easier and faster to implement.
- Effective against known malware and common threats.
- More affordable than EDRs, and sometimes even free.
Disadvantages of an Antivirus Compared to an EDR
- Insufficient protection in the current cybersecurity landscape, especially for scenarios beyond low-risk individual users.
- It may cause management issues, such as false positives or conflicts with other applications.
- Very limited response capability to security incidents.
Practical Approaches for Endpoint Security in On-Premise Environments
Whether due to legal requirements, such as protecting and managing sensitive data, or due to a strategic technology approach, such as the need for greater control or equipment performance, on-premise solutions are gaining appeal compared to a 100% cloud-based approach.
Therefore, it is important to consider these fundamental strategies for successfully implementing EDR solutions in on-premise environments.
- Analysis and Assessment of Infrastructure Needs. Every truly strategic action, of any kind, begins with this step. It is essential to have a thorough understanding of your network, its critical assets, and the primary threats you face, which will shape a significant part of your specific threat model, differing from that of other organizations.
- Choosing the Right EDR Solution. Based on the conclusions from the previous point and your budget.
- Initiating a Testing Phase. In a controlled environment that allows you to evaluate whether the chosen solution is appropriate.
- Establishing a Gradual Deployment Strategy. Even if tests are successful, it is crucial to proceed gradually to identify and solve any issues and challenges that will inevitably arise.
- Integration with Other Tools. Particularly with SIEM, configuring rules and verifying their effectiveness.
- Setting Up a Robust Monitoring and Auditing Policy. The tool alone is ineffective without a solid process behind it, making it essential to systematize monitoring and control tasks.
- Establishing Contingency Plans. What would happen if everything failed? Security must always consider this question, even when applying best practices, as the probability of unexpected black swan events is never zero. For such scenarios, it is necessary to have a “red button” plan that allows for operation continuation and the restoration of data and infrastructure as quickly as possible.
While the on-premise approach is gaining traction again, nothing is absolute, so a hybrid solution can also be considered.
Therefore, here are the differences between a 100% on-premise implementation, a hybrid one, and a 100% cloud-based solution.
- 100% On-Premise: The security infrastructure is located within the organization’s premises. Its main benefit is complete control over data, devices, and security, as well as potentially better performance and lower latency. However, the challenge is that it is more expensive in terms of economic and human resources. These resources, besides being more numerous, also require higher qualifications and will perform more intensive management tasks. It is worth noting that, often due to ENS or NIS2 requirements, certain pieces of infrastructure must be on-premise.
- Hybrid Implementation: It combines on-premise and cloud elements. The key is to leverage the best of both worlds, for example, by keeping sensitive data locally while managing threat analysis and response in the cloud. A well-planned hybrid approach allows cost reduction and increased flexibility. The biggest challenge is that we will not rely solely on ourselves, as there will be points of failure beyond our control.
- 100% Cloud-Based: Its main benefit is reduced economic and human costs, as well as lower technological complexity, which rests with the cloud provider. The downside is that we place the most critical aspects in the hands of third parties, in whom we must trust. And in case of an incident, we also depend on their response capabilities.
This is no small matter, and the echoes of July 19, 2024, still resonate in every security manager’s mind. On that morning, millions of Windows systems displayed the infamous blue screen of catastrophic failure, caused by a faulty remote update from CrowdStrike, one of the most well-known EDRs.
How Pandora FMS Enhances Endpoint Security
Throughout this journey, we have emphasized that EDR solutions are more advanced but only as effective as the real-time monitoring and threat detection capabilities we have in place.
This is where the next link in the security chain connects: with a flexible monitoring system like Pandora FMS, which complements endpoint security.
How?
- By integrating with Pandora SIEM, which collects and centralizes everything, providing a clear overview of what is happening at all times.
- Through log analysis and audits, which further strengthen endpoint protection. Every company is unique, as are its specific threats. This means that we must have complete visibility into our infrastructure, its unique characteristics, and any suspicious deviations from the norm, which will differ from those of other organizations.
- With advanced security event correlation, to effectively identify anomalies in our specific case and respond appropriately.
- Through seamless integration with network devices and firewalls, ensuring that everything operates smoothly.
- By collecting events from agents on multi-platform endpoints (Windows, macOS or Linux).
As we have seen, for any organization that takes security seriously, using EDR along with a SIEM strategy is essential.
The cyber threat landscape changes frequently and quickly. Attacks are becoming more frequent, and malicious actors are getting more sophisticated. Supported by the emergence of AI, even adversaries with limited technical knowledge can now modify malware to compromise defenses and evade traditional detection systems, such as antivirus solutions. They can even create new malicious programs from scratch.
Therefore, threats that were once exclusive to highly skilled and motivated actors are now within reach of many. This underscores the importance of designing our infrastructure with resilience in mind and integrating security measures capable of anticipating this ever-changing landscape.
Without this approach, we risk facing an increasingly hostile and complex environment unprotected every single day.

by Isaac García | Last updated Feb 26, 2025 | Pandora FMS
The days when an antivirus and common sense were enough to guarantee an organization’s cybersecurity are long gone. Especially if you work in a critical sector. That’s why the NIS2 Directive (2022/2555) of the European Union establishes cybersecurity obligations for these key activities… and the consequences of non-compliance.
These consequences are significant, so let’s analyze the regulation, when it applies, and how to implement it.
What is the NIS2 Directive and What Changes from NIS1?
Increasingly sophisticated malicious actors (state-sponsored or otherwise), the omnipresence of malware, and the proliferation of data breaches make one thing clear:
The European Union must enhance its cybersecurity management in critical sectors, and the NIS1 directive was no longer sufficient.
For that reason, the new NIS2 Directive was approved in November 2022, affecting what are known as essential and important entities. Member states are now implementing it according to the following timeline:
- 16/01/2023. Entry into force.
- 18/10/2024. Repeal of NIS1. Adoption and publication of measures by member states.
- 17/01/2025. National CSIRT (Computer Security Incident Response Team) networks begin operations, and the sanctioning regime is established.
- 17/04/2025. Deadline for compiling the register of essential and important entities. Communication of their number to the Commission and Cooperation Group. Start of evaluations of national cybersecurity strategies (at least every 5 years).
What Changes from NIS1?
- Stricter security requirements.
- Increased compliance control.
- Higher penalties (up to 10 million euros or 2% of revenue for essential entities, and 7 million euros or 1.4% of revenue for important entities).
- Expansion of what is considered an essential or important entity.
This last point is crucial because many organizations that were not covered under NIS1 are now within the scope of NIS2.
Who Is Required to Comply with the NIS2 Directive
The directive generally applies to medium and large companies, whether public or private, that operate in highly critical sectors (as defined in Annex I of the Directive) and other critical sectors (as listed in Annex II).
Therefore, the first factor to consider is the size of the organization:
- A medium-sized company has between 50 and 250 employees and a turnover of up to 50 million euros, or a balance sheet exceeding 43 million euros.
- A large company exceeds these thresholds: more than 250 employees and a turnover or balance sheet of 43 million euros or more.
And which sectors are considered critical and highly critical?
The list is more extensive than that of NIS1, which, for example, classified the energy sector as highly critical. Now, under NIS2, this category has been expanded to include urban heating and hydrogen systems, which were excluded under NIS1.
Annex I establishes that highly critical sectors include:
- Energy
- Transportation
- Healthcare
- Banking
- Drinking and wastewater
- Financial and digital infrastructure (domain providers, cloud services, etc.)
- B2B ICT service management
- Certain public administrations
- Space
Annex II includes as critical sectors:
- Postal and courier services
- Waste management
- Manufacturing, production, and distribution of chemicals and food
- Manufacturing of key products (medical devices, electrical and electronic products, IT equipment, machinery, and transportation)
- Digital service providers (search engines, online marketplaces, and social media providers)
If an organization is medium or large and operates in these sectors, NIS2 should be at the top of its priority list.
Our practical recommendation is to download this guide from INCIBE, which provides a clearer breakdown of these Annexes by activity. That way, you’ll only strain your eyes as much as necessary while navigating the lines of the Directive.
NIS2 Compliance for Small Businesses and Microenterprises
After reviewing the above, the question is clear: “If I am a microenterprise or small business, does this mean I am exempt?”.
The correct answer is the most dreaded one: “It depends.”.
The law states that small businesses and microenterprises that play a key role in society, the economy, or certain types of essential services are also required to comply.
These are considered critical entities (as defined in Article 6 of Directive EU 2022/2557), which provide essential services where “an incident would have significant disruptive effects”. In such cases, even a smaller organization would fall under the directive’s scope.
However, NIS2 itself, in Recital 20, implicitly acknowledges that this definition is complex. For this reason, each EU member state must determine whether a small business is critical and provide it with guidelines and information to ensure compliance.
Practical Recommendation: If there is any suspicion that the above might apply to an organization, no matter how small, it is best to check with INCIBE or a similar agency in the relevant country.
Key Cybersecurity Requirements of NIS2
If an organization is required to comply, the next logical question is: «To what exactly?».
The regulation establishes minimum requirements in Article 21.2. These aim to unify European security standards and cover the entire cybersecurity process: from prevention to incident response, including information system defense, business continuity assurance, and staff awareness and training.
Each EU country must integrate NIS2 into its national laws, and the directive leaves room for interpretation, which creates uncertainty in the daily work of CISOs. This is especially challenging when the directive states that measures must be: proportional to the size, cost, and risk of the activity and take into account the state of the art.
As is always the case with technology, practical guidelines cannot be too specific because, by the time they are written down, they are likely already outdated. Hence the phrase “taking into account the state of the art,” which essentially means staying at the cutting edge of technology.
Moreover, what is considered proportional may be subject to the interpretation of the authority enforcing the regulation. Therefore, it is wise to err on the side of caution with these practical considerations.
System Security According to NIS2
Organizations must demonstrate their capability to defend critical infrastructure, which involves two main aspects.
The first aspect is building a strong infrastructure, essentially a castle with resilient walls, well-managed by the NOC (Network Operations Center), which mainly involves:
- Hardening servers and endpoints, securing each element with best practices.
- Effective access management to those walls, with multi-factor authentication and a strict access and identity policy for both users and devices.
- Encryption systems, backups, redundancies, and other necessary measures for resilience and business continuity as required by NIS2.
The second aspect is that once these robust walls are built, they must be actively defended, which includes:
- Using EDR (Endpoint Detection and Response).
- Implementing Intrusion Detection and Prevention Systems (IPS/IDS) for proper security monitoring.
- Utilizing SIEM (Security Information and Event Management).
Incident Response and Management According to NIS2
This is another key area of the law, requiring:
- Rapid and clear communication of incidents (to the previously mentioned CSIRT) within 24 hours or less from the moment of discovery.
- Proper management of these incidents.
Given the significant penalties imposed by NIS2 for non-compliance in these areas, it is worth exploring this topic in greater depth.
SIEM and IPS/IDS as Key Elements for Complying with the NIS2 Directive
For a critical organization, using SIEM systems and threat detection systems is essential for achieving adequate defense.
When combined with EDRs that protect endpoints, and IDS and IPS that operate at the network and host levels, a system like Pandora SIEM becomes the brain of your security operation, because it:
- Collects logs: From networks, servers, and even the office coffee machine—because someone thought it was a good idea to buy a “smart” one.
- Correlates events: If someone in Bangladesh accesses the server in Barcelona and that “employee” downloads a suspicious file, the SIEM connects the dots and takes action, alerting and mitigating the threat. Pandora’s AI features, for example, make that correlation even more effective.
- Generates automatic reports, so you don’t have to burn your eyes staring at Excel during an audit.
In this way, you ensure that you are always considering “the state of the art” and its ongoing advancements.
Log Collection Requirements Under NIS2
We may excel in security, but the old proverb always holds true: It’s not a question of if an incident will happen, but when it will happen.
The incident response and communication requirements set by NIS2 necessitate proper log collection, storage, and management, which will also be crucial for passing the mandatory reviews and audits.
Yes, Chapter VII (Article 32) is explicit about this, and organizations must be able to pass these audits and reviews—even in the absence of incidents. This means collecting, storing, and easily reviewing logs while ensuring their integrity and authenticity.
For a critical organization, this requires professional tools that make this process seamless.
The temptation to use free applications is strong, but they are insufficient against today’s threats facing key sectors… and they won’t help avoid the auditor raising an eyebrow and reaching for the “non-compliant” stamp.
How Pandora FMS and Pandora SIEM Help Ensure NIS2 Compliance
Anything less than best security practices, supported by advanced tools, is insufficient for a critical organization. It complicates operations and makes legal compliance challenging.
That’s why Pandora SIEM provides:
- Advanced security monitoring with real-time threat detection.
- AI-supported security event correlation, leading the way in best practices and security technology as required by NIS2.
- Audit-ready reporting to demonstrate regulatory compliance during audits and controls.
- Centralized log collection and analysis with long-term retention, enabling clear communication in the event of an incident and easier incident resolution by quickly identifying what happened, how, and where.
NIS2 is Europe’s answer to an increasingly turbulent global cybersecurity landscape. But let’s face it: technology laws often lag behind and can sometimes be ambiguous in scope and interpretation.
This creates nightmares for CISOs and compliance professionals, but the solution is clear: Stay ahead of the legislation.
Lead the way in best practices and tools, so that when the next regulation arrives with its thousand pages of rules, you are already a step ahead—and it doesn’t come crashing down on your head.
This way, you’ll ensure that legal requirements don’t join forces with malicious code to complicate your day-to-day operations.
by Pandora FMS team | Last updated Feb 13, 2025 | ITSM
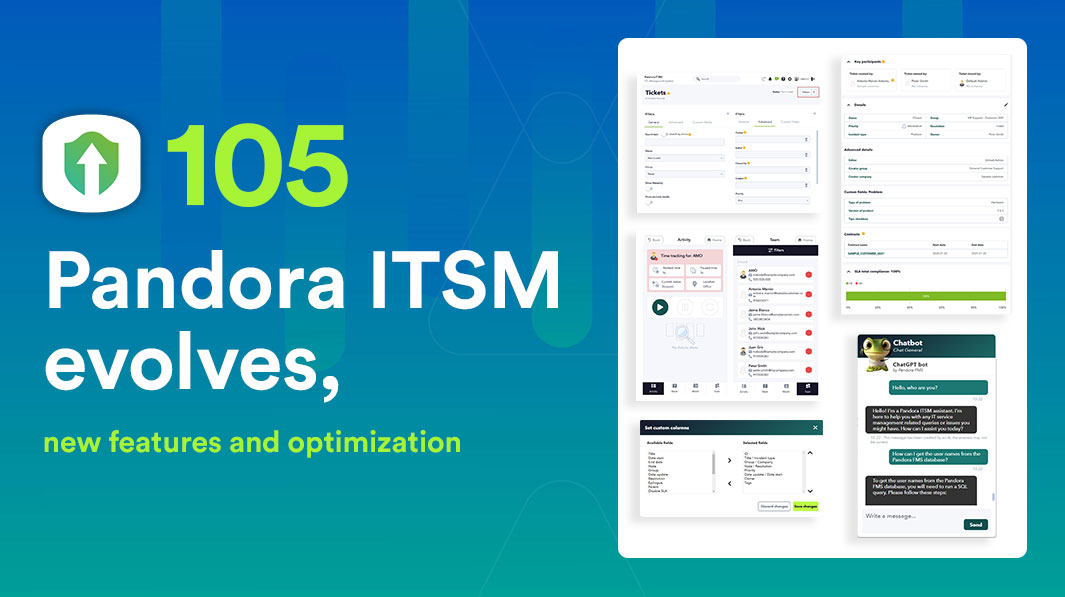
With the new Pandora ITSM version 105, you now have features designed to improve your workflow and optimize ticket and project management.
Key Enhancements in Pandora ITSM 105
New Filtering System
You can now filter and view results more efficiently in Tickets, Users, Project Board, Contracts, and Invoices. This system will expand to more sections in future versions, allowing for greater flexibility in daily management.
Enhanced Ticket View
The layout of fields in tickets has been reorganized to improve visibility and ease of use. Additionally, a new contracts section has been included to streamline access to relevant information, ensuring a better user experience.
Customizable Ticket Design
You can now rearrange, add, or remove fields in the ticket view according to your needs, with real-time editable settings through the new filters. This flexibility allows each team to tailor Pandora ITSM to their specific workflow.
Mobile Timetracker Optimization
The mobile version of the timetracker has been redesigned to be more intuitive and functional. All options available in the web console have been incorporated, ensuring that users can efficiently manage their time anytime and from any device.
ChatGPT Support in Chat
ChatGPT has been integrated into Pandora ITSM’s chat feature, providing quick and accurate responses to technical or support inquiries. This integration enhances user assistance and facilitates real-time issue resolution.
Tags in Tickets and Projects
It is now possible to add tags to tickets and projects, making it easier to categorize and search for relevant information. This feature allows for quicker access to work items and improves internal organization.
New Project Management View
With a visual interface similar to Trello, this new view simplifies task and project management with tags, custom statuses, and greater organizational flexibility. Additionally, it enables easy task movement between columns for more dynamic tracking.
New Workflow for Timetracker
The timetracker workflow has been optimized, allowing the configuration of alerts and automated reminders to improve workday tracking. It is now possible to schedule notifications that warn about work-hour limits or forgotten check-ins.
Improvements in Management and Security
New Licensing System
Starting with this version, clients who update will need to request a new license through the Warp Update > License menu. This change ensures greater security and control over active licenses on the platform.
Database Update
To optimize performance and compatibility, upgrading to Pandora ITSM 105 requires migrating from MySQL 5 to MySQL 8. This update ensures greater stability and performance in data management, improving the overall operation of the platform. Refer to the official documentation for more details.
Other Improvements and Fixes
- A new notification section has been added for super administrators.
- Enhancements in data export and report customization.
- Optimized interface for work unit management.
- Updated integration with third-party systems for better compatibility.
Explore all the new features of Pandora ITSM 105 and optimize your team’s management.
Visit our official Wiki or check the technical documentation for more details on this version.

by Sancho Lerena | Last updated Feb 4, 2025 | Pandora FMS
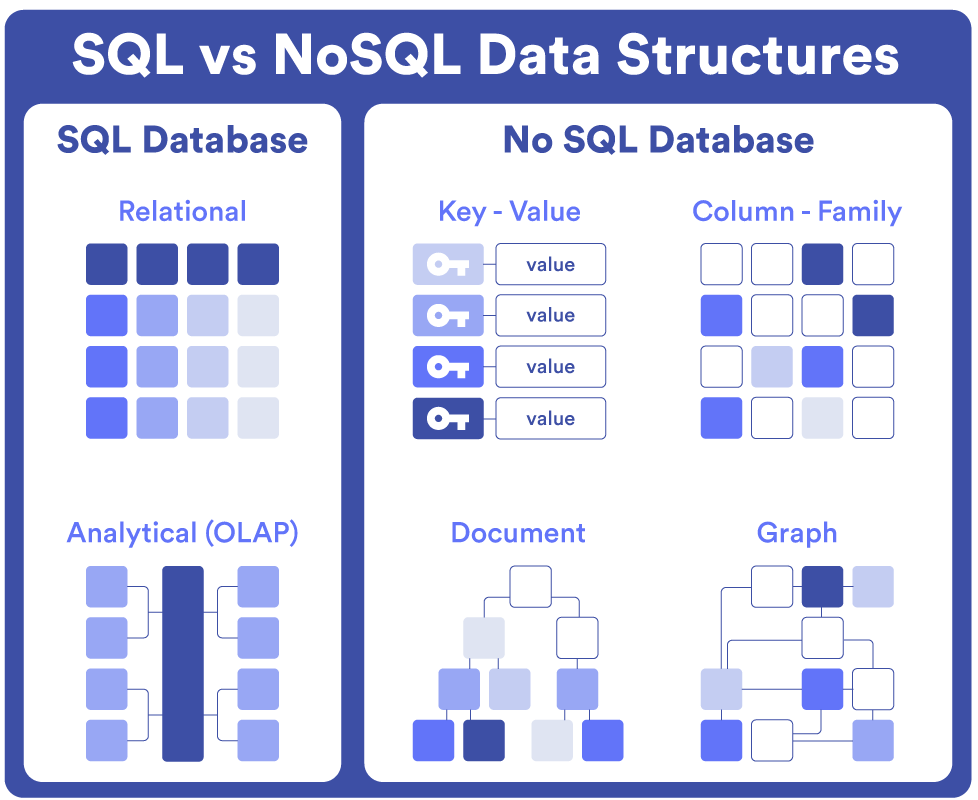
In the world of infrastructure management and enterprise software, the choice between on-premise and SaaS (Software as a Service) solutions has become a strategic decision for every organization, influencing key areas such as security, flexibility and operational costs.
Both models offer different approaches to software implementation and usage. While SaaS stands out for its accessibility and ease of adoption, the on-premise model provides absolute control over data and infrastructure, making it particularly relevant in industries where security and regulatory compliance are top priorities.
In this article, we analyze the advantages and disadvantages of each model, discussing practical use cases and offering strategic advice to help organizations make informed decisions. Regardless of your needs, understanding these approaches will enable you to optimize your infrastructure management effectively.
What Is the On-Premise Model?
The term “on-premise” refers to a model in which software is installed and operated on an organization’s local servers. Instead of relying on an external provider for hosting and application management, the company purchases a perpetual license and maintains full control over its infrastructure and data. This means that all resources required to operate the system—hardware, storage, network, and IT staff—are under the direct control of the organization.
For example, a financial sector company may choose an on-premise model to ensure that its sensitive data remains entirely within its domain and complies with strict local regulations.
In the field of infrastructure management software, this model is common in tools such as:
- ITIM (IT Infrastructure Management): Monitoring and optimizing critical infrastructures, such as servers and networks.
- ITOM (IT Operations Management): Automating and managing operational tasks in complex IT environments.
- SIEM (Security Information and Event Management): Enabling security monitoring and analysis.
- ITSM (IT Service Management): Managing IT services.
- CMDB (Configuration Management Database): Documenting assets and their relationships with services.
The on-premise model provides a custom and controlled experience, which many companies consider essential, especially in industries where security and regulatory compliance are critical.
What Is the SaaS Model?
The SaaS (Software as a Service) model is based on cloud-hosted applications provided as a service by external vendors. This approach is especially beneficial for companies with distributed teams or those needing to scale quickly, as it allows access to tools from anywhere with an internet connection and the ability to adjust capacity in real time according to needs.
Instead of installing the software locally, companies access it via the Internet through a monthly or annual subscription. This model is common in tools such as:
- RMM (Remote Monitoring and Management): Remote management of devices.
- APM (Application Performance Management): Optimizing application performance.
- ESM (Enterprise Service Management): Extending ITSM capabilities across the organization.
SaaS has gained popularity due to advantages such as:
- Ease of implementation: Enables quick deployment, eliminating the need for complex initial configurations.
- Lower upfront costs: Offers a low initial investment compared to on-premise solutions, with predictable recurring fees.
- Immediate and ubiquitous access: Users can access the software from any location and device with an Internet connection.
However, this model also has limitations that must be considered:
- Vendor dependency: Service interruptions or unilateral changes to contract terms may impact business operations.
- Data security risks: Sensitive information could be exposed due to security breaches or unauthorized access on the provider’s servers.
Despite its benefits, the SaaS model is not always the best choice for organizations that prioritize data sovereignty or require high levels of customization.
Criteria Comparison: On-Premise vs. SaaS
|
Criteria
|
On-Premise
|
SaaS
|
|
Initial Implementation
|
Requires time for local installation and configuration.
|
Quick implementation and immediate access via the cloud.
|
|
Costs
|
High initial investment but predictable in the long run.
|
Low initial costs, but recurring fees that may vary.
|
|
Security
|
Full control over infrastructure and data.
|
Risk of data exposure due to reliance on an external provider.
|
|
Flexibility
|
Complete customization and integration with legacy systems.
|
Limited to the provider’s standard capabilities.
|
|
Vendor Dependency
|
Low, as the organization has full control.
|
High, including support and service continuity.
|
|
Updates
|
The company decides when and how to apply updates.
|
Automatic, but they may be disruptive.
|
|
Scalability
|
Internal control over infrastructure, scaling as needed.
|
Immediate scalability, but subject to provider limitations.
|
|
Regulatory Compliance
|
Ensures data sovereignty and facilitates legal compliance.
|
May be challenging to meet local or industry-specific regulations.
|
|
Performance
|
Minimal latency impact when operating on internal networks.
|
Dependent on the quality of the internet connection.
|
Real Cases: The Hidden Risks of SaaS
Although the SaaS model offers significant benefits, it also presents risks that can severely impact an organization’s operations if proper precautions are not taken. Below are five real cases illustrating the most common challenges associated with this model:
- Critical vendor dependency:
A large retail company experienced a multi-day outage due to a massive failure in its SaaS provider’s servers. The lack of local data backups and an internal contingency system brought operations to a standstill, resulting in multimillion-dollar losses.
- Unexpected pricing policy changes:
A tech startup saw a sudden 40% increase in its SaaS provider’s fees without prior notice. Due to its deep integration with the tool, it was unable to migrate quickly, directly impacting its profit margins.
- Data loss due to provider shutdown:
A small business relying on a niche SaaS solution lost all its data when the provider abruptly ceased operations. Without an external backup plan, the losses were irreparable.
- Exposure to security attacks:
An educational institution suffered a cyberattack that compromised sensitive information stored on the SaaS provider’s servers. This incident led to legal and regulatory issues that damaged its reputation.
- Integration limitations:
A manufacturing company had to invest in costly adaptations to integrate its local ERP system with a SaaS tool that was not natively compatible with its legacy systems.
These examples highlight the importance of conducting a thorough analysis before adopting SaaS solutions. Evaluating factors such as vendor dependency, data security, and compatibility with existing infrastructure is crucial. Additionally, implementing mitigation strategies like local backups and risk assessments can significantly reduce the impact of these challenges.
Why the On-Premise Model Remains Relevant in the 21st Century
In an era dominated by cloud solutions, the on-premise model has evolved to remain a strategic option, particularly for organizations that value data sovereignty, security and complete control over their operations. Below is a detailed analysis of the key advantages of the on-premise model, supported by real-world cases that illustrate its relevance.
Full Control Over Data
With an on-premise model, organizations maintain absolute control over their information, preventing data from being transferred to third parties or stored in locations beyond their reach. This autonomy enhances security and ensures that, in the event of disruptions or disasters, local backups enable a complete and rapid recovery, minimizing any operational impact.
A notable example is Basecamp, which decided to return to local models after facing issues with SaaS solutions. Their decision was driven by concerns over data security and the need for total operational control.
Similarly, Dropbox migrated much of its infrastructure from the public cloud to its own data centers in 2016. This transition not only improved operational efficiency but also strengthened its technological sovereignty by managing critical resources internally. These strategies demonstrate how the on-premise model can be a vital tool for organizations that prioritize the protection of sensitive data.
Advanced Customization and Flexibility
The on-premise model offers a unique level of customization, allowing organizations to tailor their systems entirely to their specific needs. From technical configurations to deep integrations with legacy systems, this approach is ideal for companies with complex operational processes or unique requirements.
A relevant example is Airbus, which chose on-premise solutions to manage its critical IT infrastructure. This decision enabled the company to integrate its legacy aerospace production systems, ensuring operational continuity and optimizing processes without the constraints imposed by SaaS solutions. This level of customization makes on-premise a key tool for industries that require solutions tailored to their operational reality.
Technological Sovereignty
By operating with an on-premise model, companies eliminate dependence on external providers and gain the freedom to define their own technological strategies. This includes controlling update schedules, adjusting configurations according to their needs, and avoiding the risks associated with unilateral changes in policies or pricing.
For instance, in 2016, Dropbox launched the “Magic Pocket” project, migrating a significant portion of its infrastructure from the public cloud to its own data centers. This move not only reduced operational costs but also granted the company absolute control over its critical systems and data. This level of technological independence is essential for businesses that prioritize long-term stability and security.
Guaranteed Regulatory Compliance
In sectors such as banking, healthcare, and government, regulations often require that data remain within national borders or comply with specific security measures. The on-premise model provides a clear advantage by allowing organizations to manage their data within local infrastructures, ensuring complete control over storage, access, and protection.
For public administrations, regulatory compliance is not only a legal obligation but also a matter of trust and sovereignty. This model enables governments and public agencies to ensure that sensitive information, such as citizen data or tax records, is not transferred to third parties or hosted outside the country, minimizing legal and strategic risks.
As a result, many public institutions have chosen to implement on-premise solutions, prioritizing information security and rigorously complying with local and international regulations.
Predictable Long-Term Costs
The on-premise model requires a high initial investment in infrastructure and licenses, but it offers financial predictability that many businesses consider essential. Unlike the SaaS model, which relies on recurring payments and is subject to sudden price changes, the on-premise approach eliminates these variable costs and allows organizations to maintain direct control over operational expenses.
According to an article from Xataka, an increasing number of companies are repatriating their infrastructure from the cloud to on-premise environments due to unexpected and uncontrolled cloud service costs. This phenomenon, known as “cloud repatriation,” highlights the need for many organizations to regain financial and strategic control over their technology systems.
Additionally, a Forbes analysis explains that while cloud services may appear more cost-effective initially, operating expenses tend to increase over time, especially for organizations with intensive workloads. In contrast, the on-premise model enables businesses to plan their technology investments more precisely, without being influenced by external factors that may impact their budgets.
For example, industries such as banking and healthcare, which have stringent regulatory and operational requirements, have found the on-premise model to be a more sustainable solution. These sectors have migrated from the cloud to local infrastructures to avoid cost fluctuations and ensure regulatory compliance. A Leobit study supports this trend, emphasizing that many organizations find the return on investment (ROI) of on-premise solutions superior to cloud solutions when evaluated over a period of more than four years.
Finally, it’s crucial to note that the decision between SaaS and on-premise should not be based solely on annual or monthly cost comparisons. A medium- to long-term strategic analysis shows that on-premise solutions are often significantly more cost-effective for companies seeking financial stability and full control over their technology assets.
Higher Performance in Internal Networks
On-premise solutions, operating directly on a company’s local infrastructure, offer significant advantages in terms of performance, particularly in reducing latency and dependence on an Internet connection. By working on local networks, these solutions ensure faster response times and more consistent performance compared to cloud-based applications.
A notable example mentioned in Puppet is the case of companies like Basecamp, which decided to repatriate their infrastructure from the public cloud to on-premise data centers. This move allowed them to regain control over their infrastructure, enhance security, and reduce vulnerabilities while implementing customized measures to comply with local regulations.
Additionally, according to a report by EETimes, 83% of CIOs plan to repatriate workloads to local infrastructures in 2024. The main reasons for this trend include performance control, reduced operational costs, and improved security for critical data.
An analysis by The New Stack also highlights how companies in sectors such as finance and telecommunications are reevaluating exclusive cloud usage, favoring a hybrid or fully on-premise approach to optimize the performance of critical applications and reduce latency in their operations.
These examples reflect a growing trend toward workload repatriation, where companies seek to balance the advantages of the cloud with the need for total control and greater operational efficiency that on-premise solutions provide.
Compliance with Specific Regulations (Sovereignty and Local Regulations)
On-premise solutions offer significant advantages in terms of regulatory compliance, especially in industries where regulations require that data remain within national borders. This approach allows companies to ensure that sensitive information is not transferred to foreign servers, minimizing legal and strategic risks—an essential factor in sectors such as banking, healthcare and public administration.
A Capgemini analysis indicates that many organizations have chosen to repatriate their data from cloud environments to local infrastructures to comply with strict sovereignty regulations. This move has enabled them to implement more specific and customized measures that ensure the protection of sensitive data against vulnerabilities inherent in shared cloud environments.
In this context, the use of on-premise Security Information and Event Management (SIEM) systems has proven to be a crucial solution for meeting regulatory requirements and ensuring data sovereignty. For example, tools like Pandora SIEM not only offer a highly customizable and reliable platform but also allow data to remain within the company’s infrastructure, ensuring security and regulatory compliance.
Similarly, solutions such as OpenText ArcSight™ Enterprise Security Manager stand out for their ability to facilitate compliance with local regulations while maintaining absolute control over critical information.
These examples underscore how on-premise solutions are essential for companies operating in regulated sectors, providing them with the necessary tools to ensure strict regulatory compliance. Additionally, they reinforce the operational autonomy of organizations, ensuring that sensitive data remains under their direct control.
Custom Scalability
On-premise solutions allow companies to exercise complete control over their technological infrastructure, offering scalability tailored to their specific needs. This level of customization eliminates the limitations often imposed by SaaS providers, giving organizations the flexibility to adjust their resources as their operations evolve.
A well-known industry example is Spotify, which, after migrating to AWS in 2011, decided in 2018 to repatriate some of its streaming services to its own data centers. This move enabled them to regain greater control over the scalability of their systems, ensuring both service quality and operational cost optimization.
Security
On-premise solutions stand out by allowing companies to fully manage the security of their systems, providing absolute control over their technological infrastructure. This approach enables the implementation of customized security controls specifically designed to protect sensitive data, which is crucial in industries with strict security and privacy regulations, such as finance, healthcare, government, and defense.
In response to security incidents in cloud environments, many companies have chosen to migrate to on-premise solutions. This transition has allowed them to strengthen the protection of critical data, implementing tailored security measures that surpass the limitations of shared cloud environments.
Seamless Integration with Legacy Systems
On-premise solutions are particularly well-suited for companies that rely on legacy systems, as they allow for deeper and more controlled integration with existing technological infrastructures. This approach not only facilitates operational continuity but also optimizes the use of prior technology investments, ensuring that current systems can evolve without disruptions or incompatibilities.
By operating in an environment fully managed by the organization, the on-premise model provides the flexibility needed to adapt solutions to the specific requirements of legacy systems. This is essential for companies with critical processes that depend on established technologies and need to minimize risks associated with complex migrations or compatibility failures.
Final Reflections on Software Ownership
The on-premise model grants companies full ownership of software licenses, a crucial advantage for avoiding the risks associated with external control that characterizes SaaS models. This approach is especially valuable in environments where stability and long-term predictability are essential for business operations.
Full Control Over Licenses
Once acquired, an on-premise software license is not subject to unexpected price adjustments imposed by external providers. This control allows companies to plan their technology investments without surprises, ensuring greater financial and operational stability.
Unexpected Price Changes
SaaS models give providers the ability to unilaterally modify pricing, which can negatively impact a company’s operating costs. Additionally, these adjustments are often accompanied by mandatory updates that may not always be relevant or necessary for the customer.
A notable example occurred in 2020, when Adobe increased subscription prices for Creative Cloud, sparking complaints among business users who relied on these tools. Many companies, including small design firms, opted for perpetual software versions or alternative solutions that they could manage internally to avoid these additional costs.
Service Discontinuation
Another risk associated with the SaaS model is the potential discontinuation of service by the provider, which could disrupt critical operations. Companies that rely on these tools are subject to the strategic decisions of providers, putting the continuity of their processes at risk.
For example, in 2019, Google decided to discontinue Google Cloud Print, leaving many organizations without a suitable solution for printing in complex enterprise environments. In response, several of these companies migrated to on-premise solutions, ensuring continuity and full control over their operations.
(Supposed) Advantages of the SaaS Model Over On-Premise
Immediate Access and Global Availability
SaaS allows users to access the solution from anywhere at any time, requiring only an internet connection. This is ideal for organizations with distributed teams or mobility needs.
That is simply not true: While SaaS facilitates access, on-premise solutions can also provide remote access through configurations such as VPNs or secure portals. Moreover, these options are often more secure, as the traffic is controlled and protected by the company’s internal infrastructure, rather than relying on general security measures implemented by a third-party provider.
Low Initial Costs
SaaS does not require a large initial investment in hardware or perpetual licenses, as it is based on a recurring fee. This makes adoption easier for companies with limited budgets.
Caution! An on-premise model does not always mean high initial costs. Companies can reuse existing infrastructure and start with licenses scaled to their current needs. Additionally, trial periods and initial versions of on-premise solutions are often just as accessible as SaaS. In the long run, recurring SaaS costs can far exceed the initial investment in on-premise solutions.
Fast Implementation
SaaS solutions are ready to use almost immediately, without the need for lengthy installation or configuration processes on local servers.
Be careful! While SaaS implementations are often fast, they frequently require “onboarding” processes that involve external consulting and specific adjustments, adding hidden costs and extra time. On the other hand, well-planned on-premise systems can be configured quickly and offer the advantage of being fully adapted to local environments from the start.
Easy Scalability
SaaS makes it simple to increase or decrease capacity based on business needs, paying only for what is used. This allows companies to handle demand spikes without acquiring additional infrastructure.
Keep in mind that many SaaS systems are designed for a specific range of customers, primarily small and medium-sized businesses (SMBs), and may not scale effectively for large enterprises. In contrast, on-premise solutions enable controlled and optimized scalability, free from the technical or commercial limitations imposed by an external provider.
Automatic Updates
Software updates and enhancements are implemented automatically, ensuring that users always have access to the latest version without interruptions or additional costs.
While this is a relevant advantage, on-premise solutions can also include vendor-managed updates through comprehensive support contracts. The key difference is that with on-premise, the company decides when to implement updates, avoiding unwanted disruptions that often occur with automatic SaaS updates.
Reduced IT Workload
Infrastructure management, system maintenance, and technical issue resolution are the provider’s responsibility, freeing up internal IT resources.
Just like the previous point, an on-premise support contract can cover infrastructure management and maintenance, allowing the internal team to focus on other tasks. The key difference is autonomy: with on-premise, the company retains full control over its systems and decisions.
Easier Integration
Many SaaS solutions are designed to integrate quickly with other tools through APIs, simplifying interoperability in complex environments.
However, SaaS integrations are often limited to standard and widely used solutions, excluding proprietary systems or specific technologies that are not prioritized by SaaS developers. On-premise solutions, on the other hand, allow for deep and customized integrations with legacy systems, making them better suited to the unique needs of each company.
Built-in Backup and Disaster Recovery
Most SaaS providers include advanced backup and disaster recovery solutions as part of the service, eliminating the need for internal management of these tasks.
However, this depends entirely on the provider, as data security is fully in their hands. This can be problematic since the provider’s liability is usually limited to the subscription fee paid, which does not reflect the true value of a company’s data. Additionally, many SaaS providers restrict the ability to perform full data backups, effectively tying businesses to the provider’s ecosystem.
Cost Predictability
Subscription models allow for predictable operating expenses, with fixed monthly or annual fees that simplify financial planning.
However, perpetual on-premise licenses also offer cost predictability, as support costs remain stable and updates are optional. In contrast, SaaS providers can unilaterally change their pricing and policies, leaving businesses without viable alternatives.
When calculating costs over four years, it’s nearly impossible to do so accurately with SaaS solutions (as most providers will only offer projections for up to three years). Meanwhile, on-premise projects commonly establish financial plans spanning 10 years, ensuring long-term stability.
Access to Advanced Technologies
SaaS platforms often adopt emerging technologies quickly, such as artificial intelligence or advanced analytics, ensuring that businesses have access to innovations without making additional investments.
While emerging technologies are appealing, SaaS environments tend to focus on the latest trends, often neglecting more mature and well-established technologies that many businesses still rely on. This can lead to compatibility issues and a lack of support for existing systems.
Conclusion
The SaaS model offers clear advantages in terms of accessibility, low initial costs, and reduced maintenance, but these benefits often come with significant limitations. On-premise solutions provide greater control, security, and flexibility, which can outperform SaaS in many scenarios, especially when customization, deep integration, and data sovereignty are critical factors.
Fortunately, with Pandora FMS, you do not have to choose—we offer both SaaS and On-Premise models. Which one do you prefer?
Contact us to find out more.

by Pandora FMS team | Last updated Jan 29, 2025 | Pandora FMS
Grafana is an open source platform for real-time data display and monitoring. One of its functions is the creation of interactive and customizable dashboards that make metric analysis from several sources, such as databases, monitoring systems and cloud platforms.
Its flexibility and compatibility with multiple data providers make it an essential tool for observability and decision making in IT environments.
What advantages does it offer for your infrastructure?
- Real-time monitoring of metrics and logs.
- Support for multiple data sources, such as Prometheus, InfluxDB, MySQL, AWS CloudWatch, and more.
- Customizable alerts and notifications for a proactive response.
- Intuitive and highly customizable interface for effective visual analysis.
- Scalability and extensibility through custom plugins and boards.
Grafana is perfect for organizations looking to improve the visibility of their systems, optimize monitoring, and make data-driven decision making easier.
Grafana integration with Pandora FMS
Grafana has an integration in Pandora FMS, which allows to merge both monitoring platforms. In order to use this integration, only a few minimum prerequisites are necessary:
- API extension loaded in Pandora.
- Access from Grafana to Pandora machine from which you will receive the data and which has the API Extension loaded.
- Enable the plugin ID in the Grafana configuration file.
These configurations can be done quickly by following the steps below:
1. Add Pandora FMS Extension
First of all, start in your Pandora FMS console the extension that will allow you to obtain the data to be represented in Grafana dashboards.
To that end, just download the ZIP package that you may find in your library and upload it to Pandora FMS console from the menu: Admin tools > Extension manager > Extension uploader:
It is important not to check the “Upload enterprise extension” option.
In short, these steps basically locate the contents of the ZIP file in the extensions directory of Pandora FMS console, which will lead to the directory being created:
/var/www/html/pandora_console/extensions/grafana
If, as in this case, the installation is based on a Pandora FMS ISO, it will also be necessary to modify a configuration parameter of the Apache server.
Just edit the file /etc/httpd/conf/httpd.conf, and set the parameter “AllowOverride none” as “AllowOverride All”, within the directives of the block ‘’ since that is where Pandora FMS console is located. Therefore, it should be this way:
Also add a parameter in the PHP settings. Add the following line at the end of the file /etc/php.ini: serialize_precision = -1
And for these changes to go into effect, the Apache service must be restarted:
2. Loading Pandora FMS plugin for Grafana
Upload the ZIP file to the Grafana server with all the plugin files and place it in the path “/var/lib/grafana/plugins”. Unzip the file on this path with the “unzip” command and restart the Grafana service to load it:
3. Configuring Pandora FMS as data source for Grafana dashboards
Add the following lines to the end of the Grafana configuration file (/etc/grafana/grafana.ini):
After this change is applied, the Grafana service must be restarted using the following command: service grafana-server restart
At this point, what you have to do is configure the plugin uploaded in Grafana so that it connects to the extension loaded in Pandora FMS and allows you to use its data in Grafana dashboards.
Access the “Configuration > Datasources” menu in Grafana and click on the “Add datasource” button:
You will see different plugins that you may configure, and at the bottom of the list, you will see the plugin that you just loaded for Pandora FMS. Click on it:
This will take you to a form where you only need to fill out 3 fields for the connection with the Pandora FMS extension:
- URL to the extension, which according to the suggestion we will see will be (by default) “http://x.x.x.x/pandora_console/extensions/grafana”, where “xxxx” is the IP address or DNS name to your Pandora FMS console.
- Pandora FMS user, which will allow you to obtain data for Grafana dashboards. This user must have at least agent read permissions (AR) and can only obtain data from those agents on which it has permissions.
- Pandora FMS user password.
With these fields completed, you may click on “Save & Test ” to verify the operation of your new data source:
What happens if it does not work properly?
In configuration you might see different errors, such as:
- HTTP Error Bad Gateway → If Grafana could not connect to Pandora FMS or if the indicated IP address was incorrect.
- HTTP Error Not Found → If the indicated URL was not correct, for example because Pandora FMS extension was not correctly loaded or just because of an error when typing in the URL in the form.
- Datasource connection error: Unauthorized → If the user and/or password indicated were not correct or if the user did not have the minimum agent read permissions (AR).
Create your first Dashboard in Grafana
First, go to the “Create > Dashboard” menu, and in the board that will appear, click “Add query”:
This will take you to a form where to choose your “Pandora FMS” data source in the “Query” drop-down. This will make the bottom of the form change and you will see a query to choose a module from which to display the data on the board:
- Label: It will allow you to specify the tag that you wish for the data represented for this query to have.
- Group: It is used to filter the agent about which to represent data. A group must be chosen.
- Agent: It is used to filter the module about which to represent data. Some agent must be indicated.
- Module: It is used to specify exactly the module about which to represent data.
- TIP: It is a field that will allow to indicate whether the data to be represented will be compacted or not. If unchecked, the data will be compacted, which will result in easier-to-interpret and faster-loading graphs, although the data sample will not be the actual one but rather an average.
And once done, there you have your Pandora FMS data in Grafana.
You may include more than one query in the same board, which allows you to compare data from different modules:
And you may also add more boards within the same Grafana dashboard, so that you have all the necessary information on the same screen.
Create your first alarm in Grafana
You may create an alert from the “Alert” menu, in the dashboard display (once the Dashboard is saved).
In this menu, adjust a few rules to configure your alert:
1 . Set the name of the alert rule.
2. Define the query and the alert condition.
3. Establish alert evaluation behavior.
4. Add notes.
5. Set up notifications.
Once the alert is configured and saved, you may see it in the dashboard:

by Pandora FMS team | Last updated Jan 27, 2025 | Pandora FMS
GLPI is a free IT Service Management (ITSM) solution that allows you to manage assets, incidents and requests within an organization. It works as an incident tracking and service desk system, optimizing technical support and technological resources.
It also includes hardware and software inventory, contracts and licenses, offering a centralized view of the whole infrastructure. Its intuitive web interface and customization options ensure flexibility and scalability for businesses of any size.
What does it bring to your company?
- IT asset management.
- Follow-up and troubleshooting.
- Technical support optimization.
- Scalability: adaptable to companies of any size.
GLPI is ideal for organizations looking to improve the management of their technology resources, automate processes and optimize IT service management.
All the advantages of GLPI together with Pandora FMS
GLPI has an integration in Pandora FMS that some customers are already enjoying.
With it you may automate ticket creation, for which you may use a plugin that you may find in the library . This plugin allows integrating Pandora alerting of ticket creation in your GLPI environment through the rest API available to the service.
Each time an alert is executed and triggers the plugin, it opens a ticket in GLPI with information about the module that triggered the alert: agent, module data, IP address, timestamp and description of the module, with a title for the ticket, category, assignment group and priority, which may vary depending on the alert action.
Running the plugin with its parameters, in a configurable time interval, allows you to automate the whole process of creating a ticket that would normally be performed by a user. It is necessary to use credentials to authenticate with your environment (username and password or a token, which must be generated beforehand). The plugin configuration allows you to specify a title, description, priority, category, group, type of query. In addition, it will check whether there is already a ticket created with these features so that in case it is already created, it is only necessary to add its corresponding follow-up.
The plugin makes use of a parameter called “–recovery” that sets two different paths in its execution. If used, the plugin will check the status of the specified ticket and if it is not closed add a comment on it, if it is closed, it will not do anything else. If it is not used, the performance will be the same, but it will change if the ticket is closed or does not exist. If closed, it will create a new ticket. If it does not exist, it will create the ticket if there is a computer with the same name as the agent specified with the “–agent_name” parameter.
The plugin does not need additional dependencies for its use, since these are already incorporated. But it is necessary for in the GLPI environment to have rest api enabled, since the plugin makes use of it for ticket creation.
For that, access, in your GLPI environment, Setup → General
The “Enable Rest API” option must be enabled.
From that menu you may also enable whether you want to be able to authenticate with credentials, with tokens or both.
Once done, it will be possible to use the plugin, for that, it will be necessary to configure an alert command. By creating alert commands, you may specify and automate ticket creation.
This can be done from the alerts menu, in commands:
Enter a name, group, and the command, using as values for the parameters the macro _fieldx _, where x is the number of the parameter (they do not distinguish any order, each macro just needs to have a different number).
Once configured, you may configure the macro value below in the description fields.

by Olivia Díaz | Last updated Jan 29, 2025 | Pandora FMS
Any IT strategist must keep in mind the business goal, so that their technology initiatives are aimed at delivering, rather than services and infrastructure, the added value of reliability and optimal performance that makes them achieve business goals and be more competitive. Read on to understand what KPIs are and how they help us with proper business management.
Definition of KPIs
According to Techopedia, un KPI (Key performance indicators) can be anything that an organization identifies as an important factor for the business. Under the principle that “if something is not measured, it is not improved”, a KPI measures results and, from there, if something deserves your attention, take actions to correct, improve and optimize. If your company is in retail, a KPI can be delivery times; in other companies, the sales close rate can be an extremely important KPI.
This means that even though KPI is a business-oriented term, IT strategists need to know what they are and what they are used for in business intelligence.
Examples of KPIs
Importance of KPIs in Business Management
KPIs help us measure progress, identify potential problems, and make decisions. To that end, KPIs must be defined according to a business management framework, with these features:
- Be quantitatively and qualitatively measurable.
- Have a goal related to the business.
- Identify and solve variables in the organization.
To define IT KPIs, first you must understand business goals to align them with the business; then you may define business and type KPIs (financial, operational, sales, IT, etc.). With this, KPIs are written and monitored in real time and periodically.
How tools like Pandora FMS transform real-time KPI monitoring
Being able to measure the business with indicators ensures visibility on business performance, seeking to achieve objectives to be met and even exceeded. With Pandora FMS, it is possible to define custom dashboards with graphs and summaries, for monitoring KPIs in real time.
Example: User Experience (UX) Monitoring
Information centralization allows you to get the same display, streamlining communication and collaboration in your IT team. We invite you to learn about a success story in logistics by applying KPIs, by clicking on this link.
What are KPIs?
Understanding what KPIs are allows you to define them and know how to interpret them for the success of a functional area of the organization and their contribution to the overall success of the organization.
Concept of KPIs as measurable indicators
KPIs are the measures that have been selected to have visibility on organizational performance and are the basis for decision-making aimed at obtaining the expected results. KPIs are monitored and presented on dashboards to understand progress or alerts on an implemented strategy.
Difference between KPIs and general metrics
Even though KPIs and metrics measure performance, there are differences in their concept: KPIs are quantifiable measures to measure performance or progress on key goals for the organization and work as measurable benchmarks for long-term objectives. While metrics are quantifiable measures, they are used for specific business processes at operational level and in the short term.
Relationship between KPIs and the control panels offered by Pandora FMS
In Pandora FMS, from a single platform, you may have graphical interfaces that show KPIs in a visual, intuitive and organized way. You may display real-time data, analyze trends, make informed decisions, and take timely action. Each dashboard may be customized with charts, tables, and other visuals that represent KPIs. That allows KPIs to provide the essential metrics, while dashboards are an accessible and understandable way to visualize and analyze those metrics.
Pandora FMS Dashboard
Types of most common KPIs
One thing we recommend is to consider the best practices of each industry, as they help you identify the possible KPIs applicable to your organization, based on available data and constant monitoring. Some of the most common KPIs are:
- Financial:
- In sales, customer acquisition cost (CAC) measures the total cost of acquiring a new customer, including all expenses related to marketing and sales initiatives.
- The profit margin is used to measure the amount of profit a company makes for each weight earned. This KPI reveals the amount of profit a business may retrieve from its total sales.
- Cash flow evaluates the company’s ability to generate liquidity, which in turn reflects that it can pay the debts closest to expiration and also allows it to have a sufficient cash margin for possible defaults.
- Operations:
- The supply cycle time evaluates the average time from the generation of a purchase order to product reception.
- Inventory turnover rate measures the number of times inventory is renewed in a defined period.
- From IT:
- Network uptime refers to the amount of time an IT infrastructure is operational and accessible. It is one of the most critical for IT management, as it has a direct impact on business productivity and efficiency.
- Response time is what it takes for an IT team to respond to an incident, from the moment it is reported until it is identified and solved.
How Pandora FMS allows you to configure alerts and see these KPIs in a single dashboard
Pandora FMS platform is conceived to be able to configure alerts and display KPIs in the same dashboard efficiently and intuitively. To do so, the following steps should be followed:
-
alertswill be triggered. This may include incorrect values of a module, specific events, or
SNMP
.
- Choose actions: Configures the actions that will be performed when an alert is triggered, such as sending an email, running a script, or logging an event.
- Create commands: Defines the commands that will be run on Pandora FMS server when alerts are triggered. You may use macros to customize the parameters of these commands.
- Assign groups: Define which commands are assigned to specific alert groups.
Once done, widgets (which are GUI elements, graphical user interface, or a small application that can display information and/or interact with the user) are added to the dashboard to display the KPIs you wish to monitor. You may include charts, tables, and other visuals. After adding them, widgets are customized to display the specific data you need, adjusting formatting, time intervals, and other parameters. Also, the dashboard is configured to be updated in real time, allowing KPI remote and continuous monitoring.
How to select the right KPIs
For KPIs to be effective, those that are truly aligned with the organization’s objectives must be appropriately selected. For that, implement KPIs that follow the same line as the company’s goals and strategic objectives.
As we said before, KPIs must add value to the organization, so it is important to know the strategic objectives and goals of your company (or the objectives of a strategic project) in order to define which KPIs make sense, since they must reflect progress towards that goal and its objectives. For example, if you have a manufacturing and distribution company, you should consider the KPIs we mentioned before, such as supply cycle time, inventory turnover rate, as well as production efficiency (percentage of productive time on the production line), total operating costs, delivery fulfillment, among others.
Practical example: selecting KPIs in a managed environment with Pandora FMS
The company Conferma, a provider of virtual payment technology in 193 countries, gives us an example of a selection of KPIs managed with Pandora FMS. For this company, the Confirmation Liquidation Platform (PLC) is fundamental, since it is the engine of reconciliation and liquidation. Monitoring was inefficient and time-consuming, considering multiple database servers, firewalls, load stabilizers, hardware security modules, virtual platforms, and web servers. Real-time display of data and processes was also required. By implementing Pandora FMS, it was possible to have tailor-made software and key database information to define the KPIs and dashboard to inform employees about the current performance metrics of the Conferma business platform, in addition to real-time automation of key performance statistics.
Tools to monitor and analyze KPIs
In management indicator monitoring, business intelligence and artificial intelligence turn out to be powerful tools to streamline the display and analysis of KPI performance, in addition to being able to automate corrective and even preventive tasks, which in sum makes the work of the IT team more efficient and quicker.
Importance of automation and display in KPI management
When leveraging automation for KPI management, data collection and analysis saves valuable time and avoids human error, and real-time insights are always critical in the up-to-date performance view. Automation also contributes to consistency through standardized and clear processes for everyone.
As for display, charts and dashboards are intuitive and clear knowledge material for everyone. Collaboration and communication are streamlined when we all have the same version of what is happening, allowing us to work in a more synchronized and effective way; and, of course, decision-making is done in a timely manner and is based on consistent and reliable information.
Pandora FMS-specific features
Pandora FMS has the capabilities to support your team in real-time display and monitoring of KPIs, such as:
- Custom dashboard setup is a Pandora FMS feature that allows each user to build their own monitoring page. You may add more than one page, and in there you may add monitoring maps, graphs and status summaries, among other elements.
- Remote and real-time monitoring, from the same platform, provides a detailed and updated real-time inventory of servers, network hardware, installed software packages, users, routers, etc. In addition, it offers real-time graphics for troubleshooting and performance monitoring. Also, APIs and remote monitoring are of great value for analyzing the state of the infrastructure and networks for a better response from your team.
- Custom and detailed report generation to evaluate performance, and even from different areas, such as support, time management and projects. Custom reports can also be created with SQL queries. In addition, reports may be presented in different formats, such as HTML or PDF, and then automatically emailed to your customers.
Example of Pandora FMS report on SLA
Practical example of KPIs and their impact
To be clear about the impact of adopting KPIs, what better than a case study of implementing KPIs in a company that uses Pandora FMS:
At Salvesen Logística, logistics operator for food manufacturers and distributors. A tool was required that not only measured technical indicators such as performance, CPU, memory, etc., but also intelligence based on User Experience and business indicators. A probe programmed to simulate user behavior was implemented and every few minutes transactions are made on probes scheduled to emulate user behavior, at the same time transactions are made on the main global IT services for Salvesen customers. This comprehensive monitoring of key KPIs (such as order management, receptions, dispatches) allows you to maintain the expected service levels, in addition to being able to anticipate possible problems before they take place.
Obtained results: Reduced response times and improved SLAs. With Pandora FMS, transactional monitoring of the business has been implemented, reproducing the full cycle through which a message goes by, from when it leaves the customer, until it reaches our mailbox (Office 365, EDI, AS2, FTP, etc.). Pandora FMS has also been integrated with Salvesen’s WMS (Warehouse Management Service) and TMS (Transport Management System) platforms.
The main benefits have been:
- Early alarms and proactivity management: detection of all service levels before it affects operations, allowing early reaction to tackle the issue, along with an automatic communication system with the employees or customers using template-based alarms (via email or SMS).
- SLA management for comprehensive quality control of Salvesen Global IT Services. An executive report may be created for the management committee and senior management of the company. Also, SLA management allows you to have the information to be able to negotiate a contract renewal with a supplier.
- Reduction of the operational load, saving 24% in the operational load of the IT area that previously had to do specific health checks, being able to focus on improvements in products and services for customers.
Conclusion
Business areas are clear about their initiatives and will be influencing decisions about IT initiatives that are aligned with the organization’s goal. You and your team must clearly define the IT KPIs that add value to the company, relying on tools with real-time information and in an intuitive way, in addition to taking advantage of business intelligence capabilities and automation that ensure the timely response of your team.
We invite you to rely on Pandora FMS to optimize monitoring, analysis and decision-making based on KPIs, by:
- Automatic data collection from multiple sources, such as servers, applications and networks.
- Alert and notification management, configuring automatic alerts to receive notifications in real time when problems or significant changes in KPIs are detected.
- APIs to integrate business processes and automate configuration, notification and process management.
Reach out to our team of consultants to help you define KPIs and intuitive dashboard you and your team require.

by Pandora FMS team | Last updated Jan 10, 2025 | Pandora FMS
If Spotify can do its annual wrap-up, so can we! It is true that you will not discover your musical evolution this 2024, but you will be able to check all the advantages that one more year are added to the Pandora FMS portfolio and thereby improve your business operations.
2024 has been a transformational year for Pandora FMS, marked by significant advances and a clear focus on our customers’ global needs. We have strengthened our position as a leader in monitoring and observability, expanding our offering with key functionalities that integrate security into IT management.
One of the most important milestones this year was the launch of Pandora SIEM, a solution that enables organizations to integrate cybersecurity into their daily monitoring strategy, proactively detecting and mitigating threats. This development reinforces our commitment to providing tools that go beyond traditional monitoring, helping our customers manage complex environments with complete confidence.
Pandora SIEM allows you to centrally visualize threats, identify those that are most critical, and ensure they are addressed by the right people. This streamlined approach simplifies threat management and safeguards your infrastructure.
We have also continued to improve our remote management solution (RMM), which is key for distributed environments, optimizing the monitoring and control of critical infrastructures. This tool adopts a global infrastructure visibility approach and establishes a preventive instead of being merely a reactive maintenance model, for example by automating tasks, which ultimately contributes to greater security and SLA compliance. This effort is reflected in the four new versions of ITSM released this year, each designed to respond to the changing demands of our users and ensure maximum flexibility in managing their systems. In addition, the integration of Pandora ITSM with Pandora FMS allows our users to unify ticket management from the Pandora FMS console.
Our results speak for themselves: more than 2,000 tickets managed with a remarkably positive satisfaction rate, and a total of 1,700 tickets under development processed, reflecting the continuous work of our team to perfect our solutions. Each new release has been made possible by a fully optimized development process, which this year has been radically transformed to achieve even higher performance.
Throughout the year, we also strengthened our international presence, standing out as a leading solution in more than 30 key categories on platforms such as G2, where we obtained an average rating of 4.5/5. Our commitment to innovation and flexibility has been recognized by customers in markets around the world, from large corporations to medium-sized companies, who value our ability to adapt to multiple technology needs.
Looking ahead to 2025, we are poised to continue to innovate and expand our capabilities. Our goal is clear: to provide even more robust solutions and remain the trusted technology partner for organizations in any industry, anywhere in the world. To this end, we intend to continue adding functionalities to Pandora SIEM, such as filters or advanced reports; as well as internal auditing to Pandora RMM. We will also continue to explore the limits of monitoring, including user activity monitoring.

by Pandora FMS team | Last updated Jan 29, 2025 | Pandora FMS
What are SMART goals and why are they important in IT?
Whether in personal or professional life, goals always set a direction for where you wish to go, in addition to defining the guidelines with which to reach that desired end. In addition, awareness and motivation are generated about the actions that are carried out, which allows us to focus our energies and efforts. It is also important to consider that, in order to achieve the goals, a clear path is needed on how to get there, since, without clear goals, it is like shooting into the air blindly and very likely to generate frustration. Hence, defining objectives is to improve the productivity of your IT team, with communication and motivation. To structure the objectives, the S.M.A.R.T. Methodology is recommended, which refers to the acronym of Specific (Specific), Measurable (Measurable), Achievable (Achievable), Relevant (Relevant) and Time-based (Time Defined or Temporary).
As we will see later, creating SMART objectives in IT involves defining five aspects that help to concentrate and re-evaluate initiatives as necessary. These consider that clear and measurable objectives will help you plan objectives and implement improvements in IT project management, promoting planned and predictive monitoring, IT management and the productivity of your employees to generate a resilient and reliable technology infrastructure and services, which guarantee a better experience for users and the organization as a whole.
Breakdown of SMART Goals into IT Projects
If you do not consider all the SMART aspects, you may be setting goals for monitoring and optimizing IT systems and resources, but not effectively defining them in a plan to achieve them. That is why you must be clear about each of these five aspects, which we summarize below:
- Specific: Here we refer to the goal being clearly articulated, so that everyone on your team understands it and is in tune. You must define what will be achieved and what actions must be taken to achieve that goal. Objectives should be detailed to the extent necessary for key IT components, such as server and network availability percentages. You may ask yourself questions such as the following: for what purpose? and, what do you wish to achieve?
- Measurable: Objectives must be quantifiable in order to track progress. You need to define what data will be used to measure the goal and establish a collection method. In this case, you must define the KPIs or metrics, such as those you defined in the management of SLA, SLI or SLO, in order to track progress towards the desired objectives. The questions you may ask yourself could be: what indicators or factors tell us if we are achieving it?
- Achievable: Any goal must be realistic in order to maintain the enthusiasm to try to achieve it. You may need to set goals in stages, to go from step to step and not try to climb a one-jump ladder. Keep in mind that you should avoid overloading IT and human resources. If the goal is not feasible at the moment, you may need to increase resources first to have a chance to succeed. You may first need to set a SMART goal on obtaining the resources before defining another goal. Questions you might want to ask yourself include: What does it take to achieve this, and do you have the resources to do so?
- Relevant: Objectives must be aligned with the strategic and operational needs of the company. What we mean is that you do nott set goals just as an exercise. One way to determine whether the goal is relevant is to define the key benefit to the organization, such as improving customer service, accelerating disaster recovery, etc. The corresponding questions are: does it contribute to the organization’s goal?, who does it impact?, why is it important?
- Time-bound: Goals should have a deadline to maintain focus and productivity. That is because a goal without a deadline does not do much to identify whether the attempt was successful or failed. We also mean that, from success or lack of it, you may set new goals. That is why it is important to set deadlines on goals. The questions you can ask yourself are: what is the deadline to achieve it? Or are there dates for some stages of the project?
To be clearer about how to apply this methodology, we will see below some examples of SMART objectives, taking into account each of their elements.
Practical Examples of SMART Goals in IT
Here are some examples of SMART goals in IT management to know how to define and write them, considering their five elements in a table to make it clearer:
- SMART goal to improve server response time.
|
Specific
|
Measurable
|
Achievable
|
Relevant
|
Time-bound
|
|
Reduce the response time of web servers
|
Decrease the average response time from 500 ms to 200 ms.
|
Improve server and content delivery network (CDN) configuration.
|
Improve user experience and increase customer satisfaction.
|
Achieve a reduction in server response time within 6 months.
|
|
How to draft it:
Reduce the response time of web servers from 500 ms to 200 ms, through improvements in server configuration and in the content distribution network, in order to create a better user and customer experience within 6 months.
|
- SMART goal to reduce downtime of critical applications.
|
Specific
|
Measurable
|
Achievable
|
Relevant
|
Time-bound
|
|
Reduce downtime of critical applications.
|
Reduce downtime from 5 hours per month to less than 1 hour per month.
|
Implement a 24/7 monitoring system, perform regular preventive maintenance and set up a quick incident response protocol.
|
Ensure continuous availability of critical applications to maintain productivity and customer satisfaction.
|
Achieve reduced downtime of critical applications within 3 months.
|
|
How to draft it:
Reduce critical application downtime from 5 hours to less than 1 hour per month by implementing system and application monitoring on a 24/7 basis, regular preventive maintenance, and quick incident response protocols to ensure availability, productivity, and customer satisfaction within 3 months.
|
- SMART goal for optimizing network capacity in distributed environments.
|
Specific
|
Measurable
|
Achievable
|
Relevant
|
Time-bound
|
|
Optimize network capacity in distributed environments.
|
Increase network capacity by 30% and reduce latency by 20%.
|
Implement load balancing technologies, improve network infrastructure and use advanced monitoring tools.
|
Ensure optimal performance and high availability of services in distributed environments.
|
Achieve network capacity improvements within 4 months.
|
|
How to draft it:
Optimize network capacity in distributed environments in 4 months, by increasing network capacity by 30% and reducing latency by 20%, implementing load balancing technologies (such as content distribution network, adoption of MPLS, traffic prioritization), improvements in the network infrastructure and the use of advanced monitoring tools, to ensure optimal performance and high availability of services in distributed environments.
|
Benefits of SMART Goals
When you have set SMART goals, you may get clear benefits for yourself and your IT management team:
- Improvements in communication through clarity about what you wish to achieve and how to achieve it.
- When measured, it can be improved, without subjectivity. Progress can be monitored, in addition to establishing accountability mechanisms and even incentives.
- Increase in confidence and frustration prevention thanks to the achievable nature of the goals.
- Commitment of the team to achieve goals within a defined time frame, generating a sense of prioritization and responsibility.
And something very important is the relevance of the objectives, seeking that they are always aligned with the goals of the organization, generating a positive and tangible impact for the business.
Disadvantages or, Rather, Considerations about SMART Goals
You always have to see the other side of the coin to avoid some frustration when implementing a methodology. Therefore, we recommend that you consider the following:
- Avoid the lack of flexibility. There may be limitations for specific aspects that prevent you from exploring options outside the methodology. You must be able to adapt to changing conditions. It is perfectly fine to readjust goals.
- Excessive focus on results. It is true that SMART goals focus on the final results. This may lead to frustration if immediate success is not achieved. Focus on learning along the way.
- Not using intuition. Although SMART goals are written in order to maintain a plan, do not neglect intuition. Trust what your instincts and experience can complement what you have written down in your SMART goals.
And there are not only SMART goals but also SMARTER ones
Evaluation and Review have been added to the SMART elements, becoming S.M.A.R.T.E.R. goals , where E.R. refer to:
- Evaluation: Goals must be periodically evaluated on their progress in order to be able to make the necessary adjustments.
- Review: Goals need to be continually reviewed to ensure they remain relevant and achievable, especially when we know business conditions are changing and therefore IT initiatives need to be synchronized to those needs.
As you may see, by incorporating evaluation and review into SMART goals, we seek to ensure continuous evaluation and adaptation, while maintaining focus and long-term improvements.
Conclusion: How SMART goals improve IT projects
Adopting the SMART goals methodology helps optimize IT monitoring projects, as it allows IT staff to look towards the same objectives, improving communication about what and how they want to achieve in an objective, measurable and reliable way, in addition to establishing a joint commitment. The ultimate goal of this type of objective is to generate a relevant impact for the business and its customers.
Pandora FMS recommends approaching its consultants to find out how to carry out the SMART objectives based on a comprehensive and intuitive solution for system monitoring and observability, as well as those of each of their components and their services. For example, Pandora FMS has the capabilities to detect the factors that impact user experience.

by Olivia Díaz | Oct 18, 2024 | Pandora FMS
Introduction to MPLS and its Relevance in Business Networks
What is MPLS?
In the IT infrastructure serving increasingly digitized enterprises, the criticality of network quality of service is more than evident to ensure connectivity to everyone at any time. System and network administrators need to understand which technology enables efficient, reliable, and lowest latency data transmission between IT applications and services. That’s why we’re introducing the MPLS method (Multiprotocol Label Switching), which refers to “switching” or multiprotocol label switching (circuit-switched networks and packet-switched networks). That is because MPLS integrates network link information (bandwidth, latency, network usage) with IP (Internet ProtocolInternet Protocol) within a particular system (an ISP, Internet Service Provider) to simplify and improve IP packet exchange. Unlike traditional, IP-based networks, MPLS uses a tag system to manage traffic on the network more quickly and effectively.
Importance of MPLS in Network Infrastructures for Businesses Seeking to Reduce Latency and Improve Reliability
For a comprehensive resilient connectivity strategy, the value of MPLS lies in the ability to assist operators in the proper management of network resources, from tags, to divert and route traffic flexibly and according to business needs, achieving greater speed and reducing latency, while avoiding link failures, network congestion and bottleneck generation.
Advantages of MPLS for IT Infrastructures
As we have seen, the primary goal of MPLS is to significantly simplify routing and improve overall network performance.
Among its advantages, there are the following:
- Improvement in Quality of Service (QoS)
From a QoS perspective, ISPs help manage different types of data flows based on priority and service plan. For example, there are different needs for a business area with a premium service plan or that receives a large amount of streaming (or high-bandwidth) multimedia content, and may experience latency in the network service. When entering packets into an MPLS network, Label Edge Routers (LER) assign a label or identifier that contains information based on the routing table input (i.e. destination, bandwidth, latency, and other metrics) and references the IP header field (source IP address), the socket number information and the differentiated service. Each core router uses tags to determine the most efficient path to its destination. That is, switching is being performed based on labels and their priority, so that data packets move throughout the network accurately and quickly. It should be noted that QoS metrics include parameters such as bandwidth, delay, jitter, packet loss, availability, and reliability, which reflect network features and performance, as well as traffic. What’s relevant about this is that MPLS supports QoS mechanisms that prioritize critical traffic, ensuring that high-priority applications benefit from bandwidth optimization and low latency.
- SLA Compliance in Distributed Networks
In service management, compliance with the commitments set out in a Service Level Agreement (SLA) must be monitored. By using MPLS, it is possible to ensure network performance by enabling the creation of dedicated paths for data packets. This ensures that network performance metrics (latency, jitter, and packet loss) are implemented consistently. MPLS networks are also designed with redundancy and failover capabilities, which improve network reliability and uptime. The sum of this ensures that network operability remains operational and meets the availability targets specified in the SLAs.
- Bandwidth Usage Efficiency and Traffic Prioritization
MPLS networks provide strong tools for monitoring and managing network performance, as tags are used to route packets through the network. Each package is assigned a label that states its path and priority. Compared to traditional routing, MPLS is more efficient as it allows traffic engineering to be implemented, helping network operators optimize data flow through the network. By controlling the paths that data packets take, MPLS can avoid congestion and ensure that high-priority traffic is delivered efficiently. MPLS also allows adopting (CoS, Class of service), which is a parameter used in data and voice protocols, critical for many business applications. This is because MPLS helps to classify and manage traffic based on predefined classes of service, according to their criticality and the level of service required. For that reason, service providers may address issues more proactively with MPLS and even easily scale to accommodate growing network demands without compromising network performance.
MPLS vs. emerging technologies such as SD-WAN
When it comes to network management, as experts say, the choice between MPLS, SD-WAN, and emerging technologies should be based on the specific needs and context of the organization.
Comparison between MPLS and SD-WAN
To be able to compare these methods, we must first consider that software-defined wide area networks (SD-WAN) use virtualization technology to apply the advantages of software-defined networks, unlike traditional networks, which are hardware-based and router-centric to direct traffic across a wide area network (WAN). SD-WAN leverages network connectivity to improve application performance, accelerate productivity, and simplify network management. Typically, SD-WAN devices are usually connected to multiple network links to ensure resilience to a potential outage or degradation of service from a provider’s network. What you do have to keep in mind is that SD-WAN is not necessarily subject to compliance and service levels (SLAs).
On the other hand, MPLS, as we explained before, sends packets on predetermined network routes, avoiding connection to the public Internet and providing a greater guarantee of reliability and performance for the corporate WAN service. In addition, MPLS Service Level Agreements (SLAs) ensure a certain level of performance and uptime. Therefore, MPLS is a recommended method for organizations that need high reliability, low latency and Quality of Service (QoS) for critical applications, although its implementation cost is higher and less flexible than SD-WAN. This is because MPLS requires dedicated circuits between each location, which has its science and can take considerable time to add or remove locations from the network.
To clarify the differences, we added this table:
|
SD-WAN
|
MPLS
|
|
Offers a more predictable cost model with fixed pricing.
|
The cost is usually based on bandwidth usage.
|
|
It delivers good performance by leveraging multiple transport links and smart traffic management.
|
It offers increased reliability and performance, particularly for latency-sensitive applications such as VoIP and video conferencing.
|
|
It can be easily integrated with cloud-based applications and services, which can be ideal for quickly-expanding organizations or for those that have a distributed workforce.
|
Dedicated circuits are required between network destinations, so making changes is not as agile and can take your time and cost to make.
|
|
It offers advanced security features (example: encryption and micro-segmentation) that may enhance network security and protect against cyber threats.
|
It generally relies on physical security measures, such as private circuits and dedicated lines to protect network traffic.
|
|
Potentially lower reliability than MPLS, particularly for latency sensitive applications.
|
High reliability, especially for applications that are highly sensitive to latency and performance.
|
How SD-WAN and MPLS can complement each other
Now that we are clear about the difference between SD-WAN and MPLS, we must also consider that both methods do not compete with each other, but can be complemented by the following:
- Profitability: SD-WAN can leverage lower-cost broadband Internet connections together with MPLS, reducing overall network costs while maintaining high network performance for critical applications.
- Network Performance: MPLS provides reliable, low-latency connections for mission-critical applications, while SD-WAN can route less critical traffic over broadband or other available connections. Both methods together optimizes bandwidth usage.
- Redundancy and reliability: Combining MPLS and SD-WAN offers greater redundancy. If an MPLS link fails, SD-WAN can automatically redirect traffic through alternate paths. This ensures steady connectivity.
- Scalability: By means of SD-WAN, your team can simplify the onboarding of new sites and connections. With MPLS you may manage high priority traffic, leaving the rest to be managed with SD-WAN. With that, you will be implementing scalability and flexibility to adapt to business needs.
- Security: Using SD-WAN, your IT and security employees can take advantage of the fact that it is common for it to include integrated security features (encryption and firewalls) that can complement the MPLS security strategy, as you would be adding an additional protection layer.
Also, MPLS combined with emerging technologies such as Artificial Intelligence, can offer significant improvements in network management and optimization by optimizing network traffic, detecting anomalies, automating tasks to manage networks, among others.
As you can see, your team can leverage the strengths of both methods and emerging technologies to achieve a more efficient, reliable, and cost-effective network.
How Pandora FMS monitors MPLS networks
Pandora FMS features to monitor MPLS network traffic
Pandora FMS is a flexible and scalable monitoring solution that offers multiple specific features to monitor MPLS (Multiprotocol Label Switching) networks. The main features that make this monitoring available are detailed below:
- Bandwidth and Traffic Monitoring:
- SNMP (Simple Network Management Protocol): Pandora FMS uses SNMP to collect real-time data on bandwidth usage and traffic from MPLS network interfaces.
- NetFlow and sFlow: These technologies allow detailed analysis of traffic flow, identifying patterns and possible bottlenecks in the MPLS network.
- Latency and Packet Loss Monitoring:
- Ping and Traceroute Tests: Pandora FMS runs these tests periodically to measure latency and detect packet loss on MPLS paths.
- Round-Trip Time Monitoring: Continuous evaluation of the time it takes for packages to travel from the source to the destination and vice versa.
- Service Level Agreements (SLA) Management:
- Custom Alerts: Alert configuration based on compliance with the SLAs defined for the MPLS network, ensuring that any deviation is detected and managed immediately.
- Compliance Reports: Generation of detailed reports that show the degree of compliance with SLAs, rendering informed decision making easier.
- Display and Dashboards:
- Custom Dashboards: Pandora FMS allows you to create specific dashboards for MPLS networks, showing key metrics such as bandwidth usage, latency, and packet loss.
- Interactive Network Maps: Graphic display of the MPLS network topology, facilitating quick identification of critical points and potential problems.
- Integration with Network Management Tools:
- APIs and Webhooks: Integration with other management and automation tools, allowing fast and coordinated responses to incidents in MPLS networks.
- Compatibility with Security Protocols: It ensures that monitoring is performed securely, protecting sensitive data on the MPLS network.
Examples of how to ensure Quality of Service and SLA optimization
Ensuring Quality of Service (QoS) and optimizing SLAs is critical to maintain efficient and reliable MPLS networks. Pandora FMS offers several features that make this process easier:
- Traffic Priority:
- Traffic Classification: By using defined rules, Pandora FMS can identify and prioritize critical traffic types (such as VoIP or real-time applications) over less latency-sensitive ones.
- Bandwidth Allocation: Dynamic adjustment of the bandwidth allocated to different types of traffic to ensure that priority applications always have the necessary resources.
- Proactive SLA Monitoring:
- Real-Time Alerts: Setting up alerts to notify the IT team when SLA indicators (such as availability or response time) fall below agreed levels.
- Trend Analysis: Evaluation of history data to identify trends that may affect future SLAs, allowing for preventive adjustments in MPLS network configuration.
- Path Optimization:
- Traffic and Performance Analysis: By using data collected by Pandora FMS, sub-optimal paths may be identified and MPLS routing reconfigured to improve overall network performance.
- Load Distribution: Equal distribution of traffic between different MPLS routes to avoid overloads and improve bandwidth usage efficiency.
- SLA Detailed Reports:
- Custom Reports: Creation of reports showing compliance with SLAs at specific intervals, providing a clear view of MPLS network performance.
- Incident Analysis: Documentation of incidents that affected SLAs, making the identification of root causes and the implementation of corrective measures easier.
Use cases of MPLS featuring Pandora FMS
Pandora FMS (Flexible Monitoring System) can be effectively used with MPLS in multiple scenarios to improve network monitoring and management:
- Centralized System Monitoring: Pandora FMS can monitor multiple sites connected through MPLS from a central location. That is because from devices, data can be collected automatically from remote sources (for example, Telemetry) and then transmitted to a central location (in Pandora FMS panel) where they are analyzed for system and network monitoring and control. In business ecosystems, telemetry is critical to managing and managing IT infrastructure. This configuration enables comprehensive monitoring of network performance, ensuring that all MPLS links work optimally.
- Performance Tracking: By integrating with MPLS, Pandora FMS can track network performance metrics such as latency, jitter, and packet loss. This helps maintain Quality of Service (QoS) and ensure that critical applications receive the necessary bandwidth.
- Fault detection and resolution: Pandora FMS detects faults in MPLS networks and generates alerts in real time. This allows your team to identify and solve issues quickly and efficiently, minimizing downtime and maintaining network reliability.
- Traffic Analysis: With Pandora FMS, you may analyze patterns in MPLS link traffic. This helps analyze bandwidth usage, prevent bottlenecks, and optimize traffic flow.
- Scalability: Pandora FMS, from a single console, offers the ability to monitor MPLS networks at large scale, especially for organizations with very extensive and complex network infrastructures.
- Implementation of monitoring solutions and detection of security problems: Pandora FMS can monitor the security aspects of MPLS networks, ensuring that it remains safe and, in the event of a potential threat, issues are quickly identified and addressed.
Conclusion
Without a doubt, those in charge of networks must design a true management strategy, relying on emerging methodologies and technologies to meet the need for efficient, reliable data transmission with the lowest possible latency, while avoiding link failures, network congestion and bottleneck generation. MPLS is a methodology, that, when combined with Pandora FMS, can help your team implement mechanisms to prioritize critical traffic for high-priority applications, which demand optimal bandwidth and low latency. Additionally, the advantages of MPLS can be combined with those of SD-WAN to address potential issues more proactively and even scale flexibly to fit business needs.
That is, with Pandora FMS the three main advantages of MPLS in network monitoring are promoted:
- Quality of Service Improvement. MPLS supports QoS mechanisms to prioritize critical traffic. Pandora FMS can identify and prioritize critical traffic types over less latency-sensitive ones. From a console, you may measure bandwidth and network consumption in real time to ensure Quality of Service.
- SLA Compliance in Distributed Networks. Dedicated paths for data packets can be created using MPLS. This ensures that network performance metrics (latency, jitter, and packet loss) are implemented consistently. With Pandora FMS you may configure alerts to notify IT staff when any SLA indicator is below the agreed levels.
- Bandwidth Usage Efficiency and Traffic Prioritization. Compared to traditional routing, MPLS is more efficient because it can control and prioritize routes for data packets. Pandora FMS can help you identify sub-optimal paths and reconfigure MPLS routing to improve overall network performance.
I invite you to experience using Pandora FMS. Access a full-featured trial license at: Pandora FMS free trial.
Or if you already have Pandora FMS, visit our version and update system on our website→

by Ahinóam Rodríguez | Last updated Aug 21, 2024 | Pandora FMS
Subnetting is the process of dividing a network into several smaller, independent subnets. Each subnet is a portion of the core network that follows a specific logic. We know the definition of the use of subnets in local networks that we could use in our company, y, since the benefits of using subnetting are several:
- Increase of network performance: The amount of data traffic on a network with subnets is reduced, as traffic can be directed only to the necessary subnet. This also decreases broadcast traffic (packets that are sent to all devices on the network), being able to send them only to specific subnets.
- Improved network security: Subnets may be isolated from each other, making it easier to establish boundaries between different network segments by means of a firewall.
- Ease of network management: Having multiple subnets increases flexibility in network management compared to working with a single network.
Process for creating subnets
Before you start creating subnets, it is important to know three key concepts:
- Original IP Address: This is the base IP address from which you will start to create the necessary subnets. IPv4 addresses are divided into classes (A, B, C, D and E). In LAN networks, Class A (10.0.0.0 – 10.255.255.255), Class B (172.16.0.0 – 172.31.255.255), or Class C (192.168.0.0 – 192.168.255.255) addresses are generally used.
- Subnet Mask: It indicates which part of the IP address corresponds to the network and subnet number and which part corresponds to hosts. In addition, it also tells devices to identify whether a host is within a local subnet or comes from a remote network.
- Broadcast address: It is the highest address of a subnet and allows simultaneous traffic between all nodes of a subnet. A packet sent to the broadcast address will be sent to all subnet devices.
Once these concepts are clear, you may begin to calculate the subnets.
- Choosing the source IP address: The choice of this source IP for a local network will usually be class A, B or C and will depend on the number of hosts you need on your network. For the example, we will use the class C address 192.168.1.0/24.
- Determining the number of subnets: You need to decide how many subnets you wish or need to create. The more subnets, the fewer IP addresses will be available to hosts. In our example we will create 4 subnets.
- Subnet Mask Calculation: Starting from the IP 192.168.1.0/24, where /24 indicates that we use 24 bits for the subnet, which leaves 8 bits for the hosts. This translates to binary as:
11111111.11111111.11111111.00000000
subnet bits (24) host bits (8)
- Borrowing bits for subnets: To create subnets, take bits from those available for hosts. The formula to calculate how many bits you need is:
2^n >= N
Where N is the number of subnets (4 in our example) and n is the number of bits needed. Here, n equals 2, since: 2^2 >= 4
- New Subnet Mask: By taking 2 bits from hosts, the new subnet mask will be:
11111111.11111111.11111111.11000000
subnet bits (26) / host bits (6)
This translates to /26 or 255.255.255.192.
- Assigning source IP addresses for each subnet: Using the two borrowed bits, you get the following combinations:
192.168.1.0/26
192.168.1.64/26
192.168.1.128/26
192.168.1.192/26
- Calculating IPs for each subnet: For each subnet, calculate the first and last usable IP address and broadcast address:
- Subnet 192.168.1.0/26:
- First IP: 192.168.1.1
- Last IP: 192.168.1.62
- Broadcast address: 192.168.1.63
- Subnet 192.168.1.64/26:
- First IP: 192.168.1.65
- Last IP: 192.168.1.126
- Broadcast address: 192.168.1.127
- Subnet 192.168.1.128/26:
- First IP: 192.168.1.129
- Last IP: 192.168.1.190
- Broadcast address: 192.168.1.191
- Subnet 192.168.1.192/26:
- First IP: 192.168.1.193
- Last IP: 192.168.1.254
- Broadcast address: 192.168.1.255
Summarizing in a table:
|
Subnet
|
First IP
|
Last IP
|
Main IP
|
Broadcast IP
|
|
192.168.1.0/26
|
192.168.1.1
|
192.168.1.62
|
192.168.1.0
|
192.168.1.63
|
|
192.168.1.64/26
|
192.168.1.65
|
192.168.1.126
|
192.168.1.64
|
192.168.1.127
|
|
192.168.1.128/26
|
192.168.1.129
|
192.168.1.190
|
192.168.1.128
|
192.168.1.191
|
|
192.168.1.192/26
|
192.168.1.193
|
192.168.1.254
|
192.168.1.192
|
192.168.1.255
|
To make the task of performing these calculations easier, there are online calculators such as this one.
Subnet-to-subnet communication
Although subnets may be part of the same local network, let us not forget that now each subnet is a different network. A router is required for devices on different subnets to communicate. The router will determine whether the traffic is local or remote using the subnet mask.
Each subnet connects to a router interface, which is assigned an IP from those available for hosts. This address will be the default gateway that we will set on the computers in that subnet. All computers must have the same subnet mask (255.255.255.192 in our example).
IPv6 Subnets
Creating IPv6 subnets is different and often less complex than IPv4 ones. In IPv6 there is no need to set aside addresses for a network or broadcast address. Considering that IPv4 sets aside addresses for the main network and the broadcast address in each subnet, these two concepts do not exist in IPv6.
Creating an IPv6 Subnet
An IPv6 Unicast address has 128 bits in hexadecimal format. These 128 bits are divided into the following elements:
- Global Routing Prefix: The first 48 bits indicate the portion of the network assigned by the service provider to a client.
- Subnet ID: The next 16 bits after the global routing prefix are used to identify the different subnets.
- Interface ID: The last 64 bits are the equivalent of the host bits of an IPv4 address. This allows each subnet to support up to 18 quintillion host addresses per subnet.
To create IPv6 subnets, just incrementally increase the subnet ID:
Example:
- Global routing prefix: 2001:0db8:000b::/48
- Subnets:
- 2001:0db8:000b:0001::/64
- 2001:0db8:000b:0002::/64
- 2001:0db8:000b:0003::/64
- 2001:0db8:000b:0004::/64
- 2001:0db8:000b:0005::/64
- 2001:0db8:000b:0006::/64
- 2001:0db8:000b:0007::/64
Point-to-point networks
A point-to-point network is a particular type of network that directly communicates between two nodes, making communication between them easier, since each data channel is used to communicate only between those two devices.
Point-to-point subnets
A point-to-point subnet is a type of subnet with a /31 mask, which leaves only two addresses available to hosts. A broadcast IP is not needed in this type of configuration, as there is only communication between two computers.
These types of networks are usually used more in WAN than in LAN, and have the particularities that they are very easy to configure and at low cost, but they are not scalable nor their performance is the best, since all devices may work as client and server in a single link.
Subnet disadvantages and limitations
Although subnets provide several advantages, they also have limitations:
- Network design complexity: The initial design and configuration may be challenging, and it is necessary to maintain a clear outline of the whole network for proper maintenance.
- Waste of IP addresses: Each subnet needs to set aside two IPs (primary address and broadcast address) that cannot be assigned to devices. In addition, if subnets are isolated and all have the same size, unused addresses in one subnet cannot be used in another.
- Appropriate router required: A router capable of handling the infrastructure is required, increasing complexity in routing tables.
Despite these limitations, the benefits of subnetting often outweigh the disadvantages, making it a common practice for many companies to improve the performance and security of their networks.
What do the different parts of an IP address mean?
This section focuses on IPv4 addresses, which are presented as four decimal numbers separated by periods, such as 203.0.113.112. (IPv6 addresses are longer and use letters and numbers.)
Each IP address has two parts. The first part indicates to which network the address belongs. The second part specifies the device on that network. However, the length of the “first part” changes depending on the network class.
Networks are classified into different classes, labeled A through E. Class A networks can connect millions of devices. Class B and class C networks are progressively smaller. (Class D and Class E networks are not commonly used).
Network Class Breakdown
- Class A Network: Everything that goes before the first point indicates the network, and everything that goes after specifies the device on that network. If you use 203.0.113.112 as an example, the network is indicated with “203” and the device with “0.113.112.”
- Class B Network: Everything that goes before the second point indicates the network. If you use 203.0.113.112 again as an example, the network is indicated with “203.0” and the device within that network with “113.112.”
- Class C Network: In class C networks, everything that goes before the third point indicates the network. If you use the same example, “203.0.113” indicates the class C network, and “112” indicates the device.
Importance of subnets
Building IP addresses makes it relatively easy for Internet routers to find the right network to direct data to. However, on a Class A network, for example, there may be millions of devices connected, and the data may take time to find the right device. That is why subnets are useful: subnets limit the IP address for use within a range of devices.
Since an IP address is limited to indicating the network and address of the device, IP addresses cannot be used to indicate which subnet an IP packet should go to. Routers on a network use something known as a subnet mask to classify data into subnets.
What is a subnet mask?
A subnet mask is like an IP address, but only for internal use within a network. Routers use subnet masks to direct data packets to the right place. Subnet masks are not indicated within data packets traversing the Internet: those packets only indicate the destination IP address, which a router will match to a subnet.
Subnet Mask Example
Suppose an IP packet is addressed to the IP address 192.0.2.15. This IP address is a class C network, so the network is identified with “192.0.2” (or technically, 192.0.2.0/24). Network routers forward the packet to a server on the network indicated by “192.0.2.”
Once the packet reaches that network, a router on the network queries its routing table. It performs binary mathematical operations with its subnet mask of 255.255.255.0, sees the address of the device “15” (the rest of the IP address indicates the network) and calculates which subnet the packet should go to. It forwards the packet to the router or switch responsible for delivering the packets on that subnet, and the packet arrives at IP address 192.0.2.15.
In short, a subnet mask helps routers classify and route traffic efficiently within a large network, thereby improving network performance and organization.
Conclusion
Subnetting is a kay technique for dividing large networks into more manageable subnets, thereby improving network performance, security, and management. Although the process can be complex, online tools and calculators can make it significantly easier. Understanding and effectively applying subnetting is essential for any network administrator.

by Olivia Díaz | Last updated Aug 5, 2024 | Pandora FMS
The infrastructure must be “invisible” to the user, but visible to IT strategists to ensure the performance and service levels required by the business, where observability (as part of SRE or site reliability engineering) is essential to understand the internal state of a system based on its external results. For effective observability, there are four key pillars: metrics, events, logs, and traces, which are summarized in the acronym MELT
Next, define each of these pillars.
Metrics
What are Metrics?
They are numerical measures, usually periodic, that provide information about the state of a system and performance.
Examples of useful metrics
Response times, error rates, CPU usage, memory consumption, and network performance.
Advantages of using metrics
Metrics allow IT and security teams to track key performance indicators (KPIs) to detect trends or anomalies in system performance.
Events
What are Events?
They are discrete events or facts within a system, which can range from the creation of a module to the login of a user in the console. The event describes the problem, source (agent), and creation.
Event examples in systems
User actions (user login attempts), HTTP responses, changes in system status, or other notable incidents.
How events provide context
Events are often captured as structured data, including attributes such as timestamp, event type, and associated metadata, providing greater elements and information to the IT team to understand system performance and detect patterns or anomalies.
Logs
What are logs?
They are detailed records of events and actions that take place in a system. Also these collected data provide a chronological view of system activity, offering more elements for troubleshooting and debugging, understanding user behavior, and tracking system changes. Logs can contain information such as error messages, stack traces, user interactions, notifications about system changes.
Common log formats
Usually, logs use plain format files, either in ASCII type character encodings or stored in text form. The best known formats are Microsoft IIS3.0, NCSA, O’Reilly or W3SVC. In addition, there are special formats such as ELF (Extended Log Format) and CLF (Common Log Format).
Importance of centralizing logs
Log centralization ensures a complete and more contextualized system view at any time. This allows you to proactively spot problems and potential problems, as well as take action before they become bigger problems. Also this centralization allows to have the essential elements for audits and regulatory compliance, since compliance with policies and regulations on safety can be demonstrated.
Traces
What are Traces?
Traces provide a detailed view of the request flow through a distributed system. This is because they capture the path of a request as it goes through multiple services or components, including the time at each step. That way, traces help to understand dependencies and potential performance bottlenecks, especially in a complex system. Also traces allow to analyze how system architecture can be optimized to improve overall performance and, consequently, the end user experience.
Examples of traces in distributed systems
- The interval or span is a timed, named operation that represents a portion of the workflow. For example, intervals may include data queries, browser interactions, calls to other services, etc.
- Transactions may consist of multiple ranges and represent a complete end-to-end request that travels across multiple services in a distributed system.
- The unique identifiers for each, in order to track the path of the request through different services. This helps visualize and analyze the path and duration of the request.
- Spreading trace context involves passing trace context between services.
- Trace display to show the request flow through the system, which helps identify failures or performance bottlenecks.
Also, traces provide detailed data for developers to perform root cause analysis and with that information address issues related to latency, errors, and dependencies.
Challenges in trace instrumentation
Trace instrumentation can be difficult basically because of two factors:
- Each component of a request must be modified to transmit trace data.
- Many applications rely on libraries or frameworks that use open source, so they may require additional instrumentation.
Implementing MELT in Distributed Systems
Adopting observability through MELT involves Telemetry; that is, automatic data collection and transmission from remote sources to a centralized location for monitoring and analysis. From the data collected, the principles of telemetry (analyze, visualize and alert) must be applied to build resilient and reliable systems.
Telemetry Data Collection
Data is the basis of MELT, in which there are three fundamental principles of telemetry:
- Analyzing the collected data allows obtaining important information, relying on statistical techniques, machine learning algorithms and data mining methods to identify patterns, anomalies and correlations. By analyzing metrics, events, logs, and traces, IT teams can uncover performance issues, detect security threats, and understand system performance.
- Viewing data makes it accessible and understandable to stakeholders. Effective visualization techniques are the dashboards, charts, and graphs that represent the data clearly and concisely. In a single view, you and your team can monitor system health, identify trends, and communicate findings effectively.
- Alerting is a critical aspect of observability. When alerts are set up based on predefined thresholds or anomaly detection algorithms, IT teams can proactively identify and respond to issues. Alerts can be triggered based on metrics that exceed certain limits, events that indicate system failures, or specific patterns in logs or traces.
Aggregate Data Management
Implementing MELT involves handling a large amount of data from different sources such as application logs, system logs, network traffic, services and third-party infrastructure. All of this data should be found in a single place and aggregated in the most simplified form to observe system performance, detect irregularities and their source, as well as recognize potential problems. Hence, aggregate data management based on a defined organization, storage capacity, and adequate analysis is required to obtain valuable insights.
Aggregating data is particularly useful for logs, which make up the bulk of the telemetry data collected. Logs can also be aggregated with other data sources to provide supplemental insights into application performance and user behavior.
Importance of MELT in observability
MELT offers a comprehensive approach to observability, with insights into system health, performance, and behavior, from which IT teams can efficiently detect, diagnose, and solve issues.
System Reliability and Performance Improvements
Embracing observability supports the goals of SRE:
- Reduce the work associated with incident management, particularly around cause analysis, by improving uptime and Mean Time To Repair (MTTR).
- Provide a platform to monitor and adapt according to goals in service levels or service level contracts and their indicators (see What are SLAs, SLOs, and SLIs?). It also provides the elements for a possible solution when goals are not met.
- Ease the burden on the IT team when dealing with large amounts of data, reducing exhaustion or overalerting. This also leads to boosting productivity, innovation and value delivery.
- Support cross-functional and autonomous computers. Better collaboration with DevOps teams is achieved.
Creating an observability culture
Metrics are the starting point for observability, so a culture of observability must be created where proper collection and analysis are the basis for informed and careful decision-making, in addition to providing the elements to anticipate events and even plan the capacity of the infrastructure that supports the digitization of the business and the best experience of end users.
Tools and techniques for implementing MELT
- Application Performance Monitoring (APM): APM is used to monitor, detect, and diagnose performance problems in distributed systems. It provides system-wide visibility by collecting data from all applications and charting data flows between components.
- Analysis AIOps: These are tools that use artificial intelligence and ML to optimize system performance and recognize potential problems.
- Automated Root Cause Analysis: AI automatically identifies the root cause of a problem, helping to quickly detect and address potential problems and optimize system performance.
Benefits of Implementing MELT
System reliability and performance requires observability, which must be based on the implementation of MELT, with data on metrics, events, logs, and traces. All of this information must be analyzed and actionable to proactively address issues, optimize performance, and achieve a satisfactory experience for users and end customers.
Pandora FMS: A Comprehensive Solution for MELT
Pandora FMS is the complete monitoring solution for full observability, as its platform allows data to be centralized to obtain an integrated and contextualized view, with information to analyze large volumes of data from multiple sources. In a single view, it is possible to see the status and trends in system performance, in addition to generating smart alerts efficiently. It also generates information that can be shared with customers or suppliers to meet the standards and goals of services and system performance. To implement MELT:
- Pandora FMS unifies https://pandorafms.com/en/it-topics/it-system-monitoring/ regardless of the operating model and infrastructures (physical or SaaS, PaaS or IaaS).
- With Pandora FMS, you may collect and store all kinds of logs (including Windows events) to be able to search and configure alerts. Logs are stored in non-SQL storage that allows you to keep data from multiple sources for quite some time, supporting compliance and audit efforts. Expanding on this topic, we invite you to read the Infrastructure Logs document, the key to solving new compliance, security and business related questions.
- Pandora FMS offers custom dashboard layouts to display real-time data and multi-year history data. Reports on availability calculations, SLA reports (monthly, weekly or daily), histograms, graphs, capacity planning reports, event reports, inventories and component configuration, among others, can be predefined.
- With Pandora FMS, you may monitor traffic in real time, getting a clear view of the volume of requests and transactions. This tool allows you to identify usage patterns, detect unexpected spikes, and plan capacity effectively.
- With the premise that it is much more effective to visually show the source of a failure than simply receiving hundreds of events per second. Pandora FMS offers the value of its service monitoring, which allows you to filter all information and show only what is critical for making appropriate decisions.

by Pandora FMS team | Last updated Sep 5, 2024 | Pandora FMS
In a business world increasingly oriented towards efficiency and mobility, network management becomes a critical factor for success. Cisco Meraki stands as an undisputed leader thanks to its ability to offer a fully cloud-based technology, allowing companies of any size to manage their network devices remotely and centrally. This platform not only ensures the security and scalability required in enterprise environments, but also optimizes network performance by adapting the available bandwidth to the demands of the devices. However, to take full advantage of Cisco Meraki and ensure optimal infrastructure performance, proper monitoring becomes essential. In this context, Pandora FMS emerges as an end-to-end solution that allows adding a customized monitoring layer to the Cisco Meraki platform, facilitating early problem detection, performance analysis and scalability planning. Next, we will explore in detail why the combination of Cisco Meraki and Pandora FMS is the ideal choice for companies looking for efficient and proactive management of their network.
The great advantage of Cisco Meraki, which has made it stand out as a leader in its sector, is that it allows companies, regardless of the size of their network infrastructure, to offer 100% cloud-based technology. Of course, this allows you to manage devices from multiple locations remotely through a centralized tool, which has an API through which you may query through Pandora FMS, to add the whole monitoring of the environment in an easily and quickly, through plugins already designed for this function.
Why to Choose Cisco Meraki?
It is worth mentioning that the great advantage of Cisco Meraki is the technology of its cloud-based platform, which is widespread among companies of all sizes, and which includes the following advantages:
- Security: It offers malware protection, state-of-the-art firewalls, and data encryption. The standards comply with PCI level 1 regulations.
- Scalability: Cisco Meraki integration can be done both for one site and for thousands of devices distributed at different points. In addition, once deployed from the beginning, tools are offered to make the growth of the environment as efficient as possible.
- Performance: It provides network administrators with optimal performance by adapting the available bandwidth to the devices available.
Why monitor Cisco Meraki?
- Network Troubleshooting: It includes equipment malfunction or network overflow through traffic analysis tools.
- Environment Performance Analysis: Equipment that appears to be working properly but is actually flapping at its ports or a network interface whose speed is not enough to meet bandwidth needs can be as disruptive to your infrastructure as a device that is downright down.
- Infrastructure Scalability Scheduling: Are you sure that your devices are enough to meet the needs of your network? Monitoring the environment is key both to find out if it is necessary to add more devices, and to know whether there are lots of them for your real traffic.
Why choose Pandora FMS to monitor Cisco Meraki?
Let’s face it, Meraki’s own Cloud already includes infrastructure monitoring tools such as dashboards. So why should you worry about monitoring your Cloud devices with external software like Pandora FMS?
Here are just a few of the advantages you would enjoy by adding Cloud devices to Pandora FMS:
- Fully Custom Alerting Settings: Defining an alert when a problem is detected in a sensor (module) in Pandora FMS goes beyond notifying you by email or other notification tools, such as SMS or Telegram, the number of times and in the period of time you need. This section also includes the possibility of performing custom actions, such as trying to reboot a device automatically, writing on log files, opening an incident ticket on a ticketing platform…
- Custom Infrastructure Definition: Differentiating between groups of agents, agents and modules is fully definable depending on how you want to define computer division in your infrastructure.
- Stored Event History: Any status change and alert triggering from your sensors generates an event that is stored in a history that can be checked to perform a problem analysis in your network.
- Creating custom services, reports and visual consoles: Pandora FMS services allow you to assign importance to the different computers through a weighting system, visual consoles allow you to build your whole network infrastructure through icons that may change color according to device status in real time. Reports can be configured to prepare a summary of availability of a equipment or a network interface in an estimated time… these are just some examples of the analysis that you may get by storing your device data in Pandora FMS.
- Ease of integration between platforms: We have a plugin with which to add the devices within the Meraki Cloud with a simple execution. It is also possible to customize the modules you wish to add if you have direct access to the equipment using the SNMP protocol.
Pandora FMS Modules for Cisco Meraki
A Pandora FMS module is an information entity that stores data from a numeric or alphanumeric individual check (CPU. RAM, traffic, etc.). That is, if in a switch you wish to monitor its general CPU, and the operating state and input and output traffic of two of its interfaces, you will need to create 7 modules: one for the general CPU, two for the operating state of the two interfaces, two for the input traffic of the two interfaces and two for the output traffic of the two interfaces.
Modules are stored in dummy entities called agents. Generally, each agent represents a different device.
Finally, an agent always belongs to a group. Groups are sets that contain agents and are used to filter and control visibility and permissions.
By knowing these terms, we can get to know the structure of devices and checks that are automatically created in Pandora FMS with the execution of the “pandora_meraki” plugin that we have to add to our monitoring the information that can be retrieved from the cloud.
Meraki device agents and modules created using plugins
We have an official PandoraFMS plugin that will hugely improve the task of adding devices from the Meraki Cloud to your monitoring.
The plugin documentation can be found at the following link.
It is a server plugin (it must be located on the machine where PandoraFMS server is located), which must be indicated through parameters the URL of your Cloud, the organization ID of the company and the name of the group to add the agents that will be created through the plugin. With a simple execution, agents will be created for each appliance, switch and wireless device within a Network that matches the name of the group indicated by the parameter.
The modules created will be the following:
- For each appliance device:
- Device status
- Operational status of its interfaces
- Performance percentage
- For each switch device:
- Device status
- Operational status of its enabled interfaces
- Inbound traffic from its enabled interfaces
- Outbound traffic from its enabled interfaces
- For each wireless device:
Meraki device agents and modules created through SNMP checks
If it is necessary to add an extra module to those created by the plugin and there is connectivity between Pandora FMS server and the Meraki network devices, it is also possible to add monitoring through SNMP check polling network modules.
SNMP version 1, 2 or 3 protocol must be activated in the configuration of the Meraki devices and a network server module must be created for each check that is needed, as in any other network device.
This video explains how to create these types of modules.
Conclusions
Delving into more extensive monitoring than that offered by Meraki’s own Cloud-native systems is necessary to detect medium/long-term problems such as network saturation and perform a performance and scalability analysis. And it is downright essential for the configuration of a custom and immediate alert and the automation of tasks such as ticket creation.
To delve into it, it is necessary to have a system specifically oriented to monitoring and that offers the integration of this system with the devices added to the Cloud.
Pandora FMS allows, not only all this ease of integration and analysis tools for the Meraki Cloud, but also in the same environment it is possible to add the whole monitoring of the rest of the company’s areas and devices, such as servers, or the addition of metrics from other manufacturers.

by Olivia Díaz | Last updated Jul 26, 2024 | Pandora FMS
What are the Four Golden Signs?
In the IT Topic “IT System Monitoring: advanced solutions for total visibility and security”, in which we present how advanced solutions for IT system monitoring optimize performance, improve security and reduce alert noise with AI and machine learning. We also mentioned that there are four golden signals that IT systems monitoring should focus on. The term “golden signals” was introduced by Google in 2014 in its book Site Reliability Engineering: How Google Runs Production Systems,where Site Reliability Engineering (SRE) is a discipline used by IT and software engineering teams to proactively create and maintain more reliable services. The four golden signs are also defined:
- Latency: This metric is the time that elapses between a system receiving a request and subsequently sending a response. You might think of it as a unique “average” latency metric, or perhaps an established “average” latency that can be used to guide SLAs. But, as a golden signal we want to observe the latency over a period of time, which can be displayed as a histogram of frequency distribution. For instance:
This histogram shows the latency of 1000 requests made to a service with an expected response time of less than 80 milliseconds (ms). Each histogram section groups requests according to the amount of time they take to complete, from 0 ms to 150 ms in increments of five.
- Traffic: It refers to the demand in the system. For example, a system might have an average of 100 requests HTTPS per second; but averages can be misleading. Average trends can be observed for problems or averages over time. Also, traffic may increase at certain times of the day (when people respond to an offer for a few hours or inquiries are made about stock prices at market close.
- Errors: It refers to API error codes that indicate something is not working properly. The tracking of the total number of errors that take place and the percentage of failed requests allows you to compare the service with others. Google SREs extend this concept to include functional errors of incorrect data and slow responses.
- Saturation: There is a saturation point for networks, disks, and memory where demand exceeds the performance limits of a service. You can do load testing to identify the saturation point, as well as restrictions, when a request failed first. A very common bad practice is to ignore saturation when there are load balancers and other automated scaling mechanisms. In poorly configured systems, inconsistent scaling and other factors can prevent load balancers from doing their job properly. For that reason, monitoring saturation helps teams identify issues before they become serious problems by taking proactive actions to prevent these incidents from happening again.
The Importance of the Four Golden Signals in Monitoring
The relevance of the four golden signals in IT systems monitoring lies in the feasible tracking on latency, traffic, errors and saturation of all services, in real time, providing the elements for IT teams to identify potential or ongoing issues more quickly. Also, with the single view of everyone’s status, the work of the team devoted to monitoring IT or third-party systems is streamlined. Instead of performing different monitoring for each function or service, monitoring metrics and records can be grouped into a single location. All of this helps to better manage issues and track the whole lifecycle of an event.
How to Implement the Four Golden Signals
The four golden signals are a way to help SRE teams focus on what’s important, so they don’t rely on a plethora of metrics and alarms that might be difficult to interpret. To implement them, follow these steps:
- Define baselines and thresholds: Sets normal operating ranges or service level targets for each signal. SLO help identify anomalies and set up significant alerts. For example, you may set a latency threshold of 200 ms; if it is higher, an alert should be triggered.
- Implement alerts: Set up alerts to receive notifications when signals exceed predefined thresholds, ensuring issues can be responded to promptly. Combination with AI streamlines alert and notification management and escalation.
- Analyze trends: Review historical data periodically to understand trends and patterns, as well as gather information for proactive capacity planning and identifying areas of opportunity to optimize them. Advanced analytics and AI are valuable tools to give the correct reading to these analyses.
- Automate responses: Try to automate responses to common problems so as not to overwhelm your IT team and so that they can also focus on more strategic tasks or incidents that really deserve attention. With AI, automatic scaling can be established to help manage traffic spikes.
Monitoring Tools Open Source or Commercial Solutions?
To choose a Monitoring tool, the question may arise as to which option is more convenient: an open source one or a commercial solution. The answer should not depend only on an economic question (whether or not to pay for resources), but also on taking into account that almost all IT products cannot do without open source, since they are constantly used and that is why we do not question their value. Of course, it should be borne in mind that, to use open source, you must choose monitoring solutions supported by professional and reliable monitoring, in addition to support for correct configuration.
It is also important for the open source solution to be intuitive, to not represent a consumption of valuable time spent on configuration, adjustments, maintenance and updating tasks. Remember that agility and speed are required.
Importance of Golden Signals in Observability
Monitoring allows problems to be detected before they become critical, while observability is particularly useful for diagnosing problems and understanding the root cause. Golden signals enable site reliability engineering (SRE) to be implemented based on availability, performance, monitoring, and readiness to respond to incidents, improving overall system reliability and performance. Also, monitoring based on golden signals offers the observability elements to find out what is happening and what needs to be done about it. To achieve observability, metrics from different domains and environments must be gathered in one place, and then analyzed, compared, and interpreted.
The Golden Signals as Part of Full-Stack Observability
The full-stack observability refers to the ability to understand what is happening in a system at any time, monitoring system inputs and outputs, along with cross-domain correlations and dependency mapping. Golden signals help manage the complexities of multi-component monitoring, avoiding blind spots. It also links system behavior, performance, and health to user experience and business outcomes.
Also, golden signals are integrated to the principles of SRE: Risk Acceptance, Service Level Objectives, Automation, Effort Reduction, and Distributed Systems Monitoring, combining software engineering and operations to build and execute large-scale, distributed, and high-availability systems. SRE practices also include the definition and measurement of reliability objectives, the design and implementation of observability, along with the definition, testing and execution of incident management processes. In advanced observability platforms, the golden signals provide the data to also improve financial management (costs, capital decisions by use of technologies, SLA compliance), security and risk prevention.
Conclusion
The digital nature of business has caused IT security strategists to face the complexity of multi-component monitoring. Golden signals provide the key indicators that apply to almost all types of systems. In addition, it is necessary to analyze and predict system performance, where observability is essential. In this regard, MELT (Metrics, Events, Logs, and Traces) is a framework with a comprehensive approach to observability, gaining insight into the health, performance, and performance of systems.
Pandora FMS: a Complete Solution for Monitoring the Four Golden Signals
Pandora FMS stands out as a complete solution for monitoring distributed systems and implementing the Four Golden Signals. Here we explain why.
1. Versatility and Flexibility
Pandora FMS (Flexible Monitoring System) is known for its ability to adapt to different environments and business needs. Whether you’re managing a small on-premise infrastructure or a complex, large-scale distributed system, Pandora FMS can scale and adapt seamlessly.
2. Comprehensive Latency Monitoring
Pandora FMS enables detailed latency monitoring at different levels, from application latency to network and database latency. It provides real-time alerts and intuitive dashboards that make it easy to identify bottlenecks and optimize performance.
3. Detailed Traffic Monitoring
With Pandora FMS, you may monitor traffic in real time, getting a clear view of the volume of requests and transactions. This tool allows you to identify usage patterns, detect unexpected spikes, and plan capacity effectively.
4. Error Detection and Analysis
Pandora FMS platform offers a strong feature for error detection, both application errors, network errors, such as packet loss, network interface errors and device errors through SNMP traps in real time or even failures in the infrastructure. Configurable alerts and detailed reports help teams respond quickly to critical issues, reducing downtime and improving system reliability.
5. Resource Saturation Monitoring
Pandora FMS monitors key resource usage, such as CPU, memory, and storage, allowing administrators to anticipate and avoid saturation. This is vital to keep system performance and availability under control, especially during periods of high demand.
6. Integration with Existing Tools and Technologies
Pandora FMS integrates easily with a wide range of existing tools and technologies, enabling easier deployment and greater interoperability. This flexibility makes it easy to consolidate all monitoring data into a centralized platform.
7. Custom Reports and Intuitive Dashboards
The ability to generate custom reports and interactive dashboards allows IT teams to look at the status of their systems effectively. These features are essential for informed decision making and continuous service improvement.
8. Support and Active Community
Pandora FMS has strong technical support and an active community that offers ongoing resources and support. This is crucial to ensure that any issues are quickly solved and that users can get the most out of the platform.
9. Cost-Effectiveness
Unlike many commercial solutions, Pandora FMS offers excellent value for money, providing advanced features at a competitive cost. This makes it an attractive option for both small businesses and large corporations.

by Olivia Díaz | Last updated Jul 22, 2024 | ITSM
Learn the differences between SLA, SLO and SLI and how to implement these metrics to improve the quality of service offered by your company. Also, learn about the challenges and best practices for implementing them, along with some real-world examples.
Importance of SLA, SLO and SLI in user experience
Talking about SLA, SLO and SLI means talking about user experience. Each of these acronyms (we will explain them later) is on the minds of developers, who are looking to achieve increasingly reliable and high-quality IT services and resources. To achieve this, they must understand and effectively manage objectives at service levels, relying on defined indicators and formal agreements that lead them to achieve user satisfaction.
Objective of metrics and their application in system performance
What is measured can be improved… so metrics help ensure a service meets its performance and reliability goals. They also help align the goals of different teams within an organization toward one goal: the best user experience.
Differences between SLA, SLO and SLI
- Definition and scope of each metric.
Imagine a base where SLI (Service Level Indicators) refers to the quantifiable measurement to evaluate the performance of a service. Above this base you may find SLO (Service Level Objectives), which set objectives for service performance, and SLA (Service Level Agreement), which are legally binding contracts between a service provider and a customer.
- Example and applications in different contexts.
For example, a cloud service provider may define latency as the amount of time it takes to process a user’s request and return a response as SLI. From there, an SLO of no more than 100 milliseconds is established for a consecutive period of 30 days; if the average latency exceeds this value, they will issue service credits to customers.
If an SLI is set on the e-commerce website based on the error rate as a percentage of failed transactions, the SLO could set the error rate to not exceed 0.5% during any 24-hour period. The SLA agreed with the cloud service provider would include this SLO, along with penalties or compensation if it is not met.
SLI: Service Level Indicator
Meaning and function
Service Level Indicators (SLIs) measure the performance and reliability of a service, to determine whether an offer meets its quality objectives. The SLI also helps identify areas for improvement. Examples of indicators include latency (response time), error rate, throughput, and availability (uptime). These metrics are usually monitored over specific time periods to assess performance. As it can be seen, SLIs are the foundation for setting performance and reliability benchmarks for a service.
Challenges and strategies for their measurement
Based on the fact that SLI refers to metrics, the main challenge is to achieve a simple approach to the indicators, since they must be easily analyzed and compared in order to speed up decision-making based on the results. Another challenge is choosing useful tracking metrics that correspond to the actual needs of the product or service.
SLO: Service Level Objective
Definition and purpose
Service Level Objectives (SLOs) set performance and reliability objectives that service providers aim to achieve, in line with a service’s SLIs. So these SLO help to evaluate and monitor whether the service meets the desired quality level. For example, a cloud provider may say that their goal is to achieve 99.99% availability over a specific time period.
Challenges and recommendations for implementation
The main challenge is that objectives must be clear, specific and measurable, so it is recommended that the service provider works closely with stakeholders to define SLOs and their scopes.
SLA: Service Level Agreement
Concept and purpose
A service level agreement (SLA) is a legally binding contract between a service provider and a customer, outlining agreed SLOs and penalties for non-compliance. SLAs ensure that providers and stakeholders clearly understand the expectations about the quality of service and the repercussions in case of non-compliance (financial compensation or service credits) with the agreed standards. SLAs include SLOs such as latency times, error rate, and availability. Of course, before service begins, the service provider and the customer will negotiate Service Level Agreements. SLAs help to have a clear understanding of performance expectations, channels and courses of action, and service reliability, safeguarding the interests of both parties.
Challenges and best practices
One of the most important challenges of an SLA is that it does not go along the line of business priorities, so a best practice is to involve the business areas where the greatest impact on the service level is generated in the agreements. Also, monitoring the SLA and updating them can be a complex process that requires reports with data obtained from multiple sources of information. In this regard, it is recommended to acquire the technological tools that help to retrieve data from multiple sources in a more agile and automated way.
Comparison between SLA, SLO and SLI
As we have seen, SLIs are the foundation for SLOs and SLAs, with quantitative metrics to assess service performance and reliability. SLOs use data derived from SLIs to set specific objectives on service performance, ensuring that the service provider and stakeholders have clear objectives to achieve. Hence, SLAs incorporate SLOs into a contract between the service provider and the customer, so that both parties have a clear understanding of performance expectations and consequences in the event of non-compliance.
To be clearer, it helps to look at these tables that compare differences, challenges, and best practices:
Table 1: Differences between SLA, SLO and SLI
|
Metric
|
Purpose
|
Application
|
Flexibility
|
|
SLI
|
Actual measurement of service performance.
|
Internal, paid.
(actual number on performance)
|
High flexibility.
|
|
SLO
|
Internal objectives that indicate service performance.
|
Internal and external, free and paid.
(objectives of the internal team to comply with the service level agreement)
|
Moderate flexibility.
|
|
SLA
|
Agreement with customers on service commitments.
|
Payments, availability.
(the agreement between the provider and the service user)
|
Low flexibility.
|
As it can be seen in Table 1, to the extent that the metric is more specific (SLI), there is greater flexibility for its definition, AND, the more specific the metric (SLA), the more parties involved the commitment is.
Table 2: Challenges and best practices
|
Metric
|
Challenges
|
Best Practices
|
|
SLI
|
Definition of product or service associated with business needs.
Accurate and consistent measurement.
|
Another challenge is choosing useful tracking metrics that correspond to the actual needs of the product or service.
Track system evolution and visualize data.
|
|
SLO
|
Balance between complexity and simplicity.
Define the objectives must be clear, specific and measurable.
|
Close collaboration with the parties involved in the service to define SLOs and their scopes.
Continuously improve and select valuable metrics.
|
|
SLA
|
Alignment with business objectives.
Collaboration between legal and technical teams.
Retrieving data from multiple sources to measure compliance levels.
|
Define realistic expectations, with a clear understanding of the impact on the business.
Reach consensus with stakeholders and the technical team to define the agreements in the SLA.
Use technological tools that help to retrieve data from multiple sources in a more agile and automated way.
|
In Table 2, you may see that the challenges for the metric are different, due to their internal or external nature. For example, SLOs are internal objectives of the service provider, while SLAs establish a commitment between the provider and the customer (service user), as well as penalties in case of non-compliance.
Real-world applications
Examples of how these metrics are applied in different companies and services.
- SLI:
- Service availability/uptime.
- Number of successful transactions/service requests.
- Data consistency.
- SLO:
- Disk life must be 99.9%
- Service availability must be 99.5%
- Requests/transactions successfully served must reach 99.999%
- SLA:
- Agreement with clauses and declarations of the signing parties (supplier and user), validity of the agreement, description of services and their corresponding metrics, contact details and hours for support and escalation courses, sanctions and causes of termination in case of non-compliance, termination clauses, among others.
Conclusion
Service metrics are essential to ensure the quality of the service offered. Whether you are working with the service provider or you are on the other side of the desk, the service user, you need to have reliable and clear information about a service’s performance in order to generate better user experiences, which in turn translates into better responsiveness to internal customers (including vendors and business partners) and external customers of any organization. Additionally, do not overlook the fact that more and more companies are adopting outsourcing services, so it is helpful to be familiar with these terms, their applicability and best practices.
We also recommend these tools that Pandora FMS puts at your disposal:

by Sancho Lerena | May 8, 2024 | Pandora FMS
Resilience in today’s liquid business environment demands flexibility. The term “observability” replaces monitoring, reflecting the need to adapt and be agile in the face of challenges. The key is to dissolve operations into the cloud, integrating tools and operational expertise for effective resilience.
I remember that when I started my professional career (in a bank) one of the first tasks I was handled was to secure an email server exposed to the internet. Conversations around coffee were about these new trends that seemed suicidal, they wanted to take away service exploitation to servers on the internet!
There wasn’t even talk of the cloud at that time. The first steps of software as a service were already being taken, but in short, everything was on-premise, and infrastructure was the queen of computing, because without a data center, there was no business.
Two decades have gone by and the same thing that happened to Mainframes has happened to data centers. They are reminiscences of the past, something necessary, but outside of our lives. No one builds business continuity around the concept of the data center anymore, who cares about data centers anymore?
The number of devices worldwide that are connected to each other to collect and analyze data and perform tasks autonomously is projected to nearly triple, from 7 billion in 2020 to over 29.4 billion in 2030.
How many of those devices are located in a known data center?, furthermore, does it really matter where these devices are?
We don’t know who they are, who they are maintained by, or even what country they are in many times, no matter how much data protection laws insist, technology evolves a lot faster than legislation.
The most important challenge is ensuring business continuity, and that task is at the very least difficult when it is increasingly harder to know how to manage a business’ critical infrastructure, because the concept of infrastructure itself is changing.
What does IT infrastructure mean?
The suite of applications that manages the data needed to run your business. Below those applications is “everything else”, from databases, engines, libraries, full technology stacks, operating systems, hardware and hundreds of people in charge of each piece of that great babel tower.
What does business continuity mean?
According to ISO 22301, business continuity is defined as the “ability of an organization to continue the delivery of products and services in acceptable timeframes at a predefined capacity during an interruption.”
In practice, there is talk of disaster recovery and incident management, in a comprehensive approach that establishes a series of activities that an organization can initiate to respond to an incident, recover from the situation and resume business operations at an acceptable level. Generally, these actions have to do with infrastructure in one way or another.
Business continuity today
Before IT was simpler, infrastructure was located in one or more datacenters.
Now, we don’t even know where it is, beyond a series of intentionally fuzzy concepts, but what we do know is that neither the hardware is ours, nor the technology is ours, nor the technicians, nor the networks are ours. Only the data (supposedly).
What does business resilience mean?
It is funny that this term has become trendy, when the basic concept of the creation of the Internet was resilience. It means neither more nor less than that it is not a matter of hitting a wall and getting up, but that of accepting mistakes and moving forward, in other words, being a little more elegant and flexible when facing adversity.
Resilience and business continuity
In these liquid times, where everything flows, you have to be flexible and change the paradigm, that is why there is no longer talk of monitoring but of observability, because that of the all-seeing eye is a bit illusory, there is too much to see. Old models don’t work.
It’s not a scalability problem (or at least it’s not just a scalability problem), it’s a paradigm shift problem.
Let’s solve the problem using the problem
Today all organizations are somehow dissolved in the cloud. They mix their own infrastructure with the cloud, they mix their own technology with the cloud, they mix their own data with the cloud. Why not mix observability with cloud?
I’m not talking about using a SaaS monitoring tool, that would be to continue the previous paradigm, I’m talking about our tool dissolving in the cloud, that our operational knowledge dissolves in the cloud and that the resilience of our organization is based on that, on being in the cloud.
As in the beginnings of the internet, you may cut off a hydra’s head, but the rest keeps biting, and soon, it will grow back.
Being able to do something like this is not about purchasing one or more tools, hiring one or more services, no, that would be staying as usual.
Tip: the F of FMS in Pandora FMS, means Flexible. Find out why.
Resilience, business continuity and cloud
The first step should be to accept that you cannot be in control of everything. Your business is alive, do not try to corset it, manage each element as living parts of a whole. Different clouds, different applications, different work teams, a single technology to unite them all? Isn’t it tempting?
Talk to your teams, they probably have their own opinion on the subject, why not integrate their expertise into a joint solution? The key is not to choose a solution, but a solution of solutions, something that allows you to integrate the different needs, something flexible that you do not need to be in control of, just take a look, just have a complete map, so that whatever happens, you can move forward, that’s what continuity is all about.
Some tips on business continuity, resilience and cloud
Why scale a service instead of managing on-demand items?
A service is useful insofar as it provides customers with the benefits they need from it. It is therefore essential to guarantee its operation and operability.
Sizing a service is important to ensure its profitability and quality. When sizing a service, the amount of resources needed, such as personnel, equipment, and technology, can be determined to meet the demand efficiently and effectively. That way, you will avoid problems such as long waiting times, overwork for staff, low quality of service or loss of customers due to poor attention.
In addition, sizing a service will allow you to anticipate possible peaks in demand and adapt the capacity appropriately to respond satisfactorily to the needs of customers and contribute to their satisfaction. Likewise, it also helps you optimize operating costs and maximize service profitability.
Why find the perfect tool if you already have it in-house?
Integrate your internal solution with other external tools that can enhance its functionality. Before embarking on a never-ending quest, consider what you already have at home. If you have an internal solution that works well for your business, why not make the most of it by integrating it with other external tools?
For example, imagine that you already have an internal customer management (CRM) system that adapts to the specific needs of your company. Have you thought about integrating it with digital marketing tools like HubSpot or Salesforce Marketing Cloud? This integration could take your marketing strategies to the next level, automating processes and optimizing your campaigns in a way you never imagined before.
And if you’re using an internal project management system to keep everything in order, why not consider incorporating online collaboration tools like Trello or Asana? These platforms can complement your existing system with additional features, such as Kanban boards and task tracking, making your team’s life easier and more efficient.
Also, let’s not forget IT service management. If you already have an internal ITSM (IT Service Management) solution, such as Pandora ITSM, why not integrate it with other external tools that can enhance its functionality? Integrating Pandora ITSM with monitoring tools like Pandora FMS can provide a more complete and proactive view of your IT infrastructure, allowing you to identify and solve issues before they impact your services and users.
The key is to make the most of what you already have and further enhance it by integrating it with other tools that can complement it. Have you tried this strategy before? It could be the key to streamlining your operations and taking your business to the next level.
Why force your team to work in a specific way?
Incorporate other equipment and integrate it into your team (it may be easier than you imagine, and much cheaper).
The imposition of a single work method can limit the creativity and productivity of the team. Instead, consider incorporating new teams and work methods, seamlessly integrating them into your organization. Not only can this encourage innovation and collaboration, but it can also result in greater efficiency and cost reduction. Have you explored the option of incorporating new teams and work methods into your organization? Integrating diverse perspectives can be a powerful driver for business growth and success.
Why choose a single cloud if you can integrate several?
The supposed simplicity can be a prison of very high walls, never take your chances on a single supplier or you will depend on it. Use European alternatives to protect yourself from legal and political changes in the future.
Choosing a single cloud provider can offer simplicity in management, but it also carries significant risks, such as over-reliance and vulnerability to legal or political changes. Instead, integrating multiple cloud providers can provide greater flexibility and resilience, thereby reducing the risks associated with relying on a single provider.
Have you considered diversifying your cloud providers to protect your business from potential contingencies? Integrating European alternatives can provide an additional layer of protection and stability in an increasingly complex and changing business environment.
Why choose high availability?
Pandora FMS offers HA on servers, agents and its console for demanding environments ensuring their continuity.
High availability (HA) is a critical component in any company’s infrastructure, especially in environments where service continuity is key. With Pandora FMS, you have the ability to deploy HA to servers, agents, and the console itself, ensuring your systems are always online even in high demand or critical environments.
Imagine a scenario where your system experiences a significant load. In such circumstances, equitable load distribution among several servers becomes crucial. Pandora FMS allows you to make this distribution, which ensures that, in the event of a component failure, the system remains operational without interruptions.
In addition, Pandora FMS modular architecture allows you to work in synergy with other components, assuming the burden of those that may fail. This contributes to creating a fault-resistant infrastructure, where system stability is maintained, even in the face of unforeseen setbacks.
Why centralize if you can distribute?
Choose a flexible tool, such as Pandora FMS.
Centralizing resources may seem like a logical strategy to simplify management, but it can limit the flexibility and resilience of your infrastructure. Instead of locking your assets into a single point of failure, consider distributing your resources strategically to optimize performance and availability across your network.
With Pandora FMS, you have the ability to implement distributed monitoring that adapts to the specific needs of your business. This solution allows you to deploy monitoring agents across multiple locations, providing you with full visibility into your infrastructure in real time, no matter how dispersed it is.
By decentralizing monitoring with Pandora FMS, you may proactively identify and solve issues, thus minimizing downtime and maximizing operational efficiency. Have you considered how distributed monitoring with Pandora FMS can improve the management and control of your infrastructure more effectively and efficiently? Its flexibility and adaptability can offer you a strong and customized solution for your IT monitoring needs.
Contact our sales team, ask for a quote, or solve your doubts about our licenses. Pandora FMS, the integral solution for monitoring and observability.

by Olivia Díaz | Last updated Jul 22, 2024 | Remote Control
Every computer has its BIOS, short for Basic Input/Output System), which is a firmware installed on the PC’s motherboard. Through the BIOS you may initialize and configure hardware components (CPU, RAM, hard disk, etc.). Let’s say it’s a kind of translator or bridge between computer hardware and software. Its main functions are:
- Initialize the hardware.
- Detect and load the bootloader and operating system.
- Configure multiple parameters of your PC such as boot sequence, time and date, RAM times and CPU voltage.
- Set up security mechanisms like a password to restrict access to your PC.
Importance of understanding how to access and update the BIOS
Since its main function is to initialize and check that all the hardware components of your PC are working properly, if everything is working correctly, BIOS looks for the operating system on the hard drive or other boot device connected to your PC. However, accessing BIOS may be an unknown process for many users, preventing its update, which can guarantee the performance of the equipment and its security. Later in this blog we will explain how to access BIOS.
Clarification on the non-routine nature of BIOS updates
It is recommended to update BIOS to maintain performance, stability and computer security. Your PC manufacturer can send BIOS updates to add features or fix some bugs. The process is overall simple, but it must be done with great care to avoid irreversible damage. Also, it should be avoided to turn off or cut off the power in the middle of an upgrade process with serious consequences for the equipment.
Accessing the BIOS from Windows
To access BIOS, there are several options, from the following buttons, depending on the brand of your computer:
- Dell: F2 or F12
- HP: F10
- Lenovo: F2, Fn + F2, F1, or Enter followed by F1
- Asus: F9, F10 or Delete
- Acer: F2 or Delete
- Microsoft Surface: Hold the volume up button pressed
- Samsung/Toshiba/Intel/ASRock/Origin PC: F2
- MSI/Gigabyte/EVGA/Zotac/BIOStar: Delete
Instructions for accessing the BIOS from Windows 10 or 11 through Settings and the Advanced Start option
Just follow these instructions:
- Restart your computer and wait for the manufacturer’s logo to appear.
- Press the key one of the keys mentioned above when viewing the home screen to access the BIOS settings.
- Once in the BIOS, you may navigate through the different options using the arrow keys on your keyboard.
You may also follow this process in Windows 11:
- On the login or lock screen, press the Shift key on your keyboard and tap the power button (or click the power option at the bottom right of the login screen). Then choose the Reset option from the menu.
- When Windows 11 restarts, you will be shown the advanced startup screen (choose an option).
- Then scroll to Troubleshoot > Advanced Options > UEFI Firmware Settings and click Restart.
Since BIOS configuration can have an impact on the operation of your PC, it is recommended to seek help from a professional.
Alternatives to using the Windows 10 and 11 method if the operating system loads too fast to access BIOS.
An alternative to start Win11 BIOS configuration is from the Settings application. Just follow these three steps:
- Open Windows 11 Settings
- Navigate to System > Recovery > Restart now.
- Before you click Restart Now , save your work.
- Next, go to Troubleshooting > Advanced Options > UEFI Firmware Configuration and click Restart. (we will talk about UEFI later in this blog post)
Another alternative is to use the Windows Run command:
- Open up the Run box (by pressing the Windows + R keys).
- Then type shutdown /r /o , and press Enter . A shortcut is to type shutdown /r/o/f /t 00 and click OK .
- Then select Troubleshoot > Advanced Options > UEFI Firmware Configuration and click Restart to boot into the system BIOS settings.
By the command line, also:
- Open CMD, PowerShell or Terminal.
- Type in shutdown /r /o /f /t 00 o shutdown /r /o and press Enter.
- Then go to Troubleshooting > Advanced Options > UEFI Firmware Configuration and click Restart to get to the Windows 11 BIOS/UEFI configuration.
A more customized option is by shortcut:
- Right-click on the Windows 11 desktop and select New > Shortcut.
- In window Create Shortcut, enter shutdown /r/o /f /t 00 or shutdown /r /o to locate it.
- Follow the instructions to create a BIOS shortcut.
Once the BIOS configuration shortcut is created, just double-click it and choose Troubleshooting > Advanced Options > UEFI Firmware Configuration and click Restart to boot your PC into the BIOS environment.
What does UEFI stand for?
UEFI (Unified Extensible Firmware Interface) has emerged as the most modern and flexible firmware with new features that go hand in hand with today’s needs for more volume and more speed. UEFI supports larger hard drives and faster boot times.
UEFI advantages:
- Easy to program since it uses the C programming language. With this programming language you may initialize several devices at once and have much faster booting times.
- More security, based on Secure Boot mode.
- Faster, as it can run in 32-bit or 64-bit mode and has more addressable address space than BIOS, resulting in a faster booting process.
- Make remote support. easier. It allows booting over the network, and may also carry different interfaces in the same firmware. A PC that cannot be booted into the operating system can also be accessed remotely for troubleshooting and maintenance.
- Safe booting, as you may check the validity of the operating system to prevent or check if any malware tampered with the booting process.
- More features and ability to add programs. You may also associate drivers (you would no longer have to load them into the operating system), which is a major advantage in agility.
- Modular, since modifications can be made in parts without affecting the rest.
- CPU microcode independence.
- Support for larger storage drives, with up to 128 partitions.
Additionally, UEFI can emulate old BIOSes in case you need to install on old operating systems.
Continued use of the “BIOS” term to refer to UEFI for simplicity
BIOS is still used to initialize and check the hardware components of a computer to ensure proper operation. Also, as we have seen, it allows you to customize PC behavior (which boots first, for example). So BIOS is still helpful in troubleshooting issues that prevent the PC from booting properly.
When should you update your BIOS?
Reasons to perform a BIOS update
Updating the BIOS (or UEFI), as we mentioned before, helps the system work with better performance, in addition to checking and adjusting the installed hardware, which in turn ultimately impacts software operation. It is recommended to update BIOS only if there is a necessary improvement in the new version.
Sometimes, it is necessary to update BIOS so that the motherboard supports the use of a new generation processor or other type of hardware.
Warning about the potential risks of a BIOS update
The recommendation to update BIOS only when it is a necessary part of the possibility that the updating process fails, leaving your computer inoperable (!). Another risk is data loss if something fails during the upgrade (a connection outage, power, incomplete process). It considers that there may be unexpected errors that may result in a direct impact on the operation of your computer. That is why it is recommended to ask for professional support to do so.
How to update your BIOS
Although each manufacturer recommends a process and their own tools for updating BIOS, you may say that the first step is always to back up the most critical data on your computer, in case something goes wrong in the process (hopefully not!). To do so, the following is recommended:
Identification of the motherboard model and BIOS using Windows system information
The BIOS update is based on the model data of the motherboard or computer. To find out, press the Windows key on your PC and type System Information . The service window will open in which all the details of the installed software will be listed. You will see the System Model and BIOS Version and Date, for the BIOS manufacturer’s name, BIOS version, and release date. With this data you will know which version of the BIOS to download (it must be later than the one you installed).
However, the most common method of updating BIOS is through an update wizard program, which takes you by the hand throughout the update process and runs from the operating system. Only indicate where the BIOS update file is located and restart the PC.
Steps to download and install the BIOS update according to the manufacturer’s instructions.
Generally, the manufacturer of the motherboard of your PC has not only an update wizard program but also the BIOS update file, such as the wizard program itself, which you may download from the support page of the manufacturer of your computer or motherboard.
Once you obtain the BIOS installation wizard and the latest version of the BIOS, download them to your computer. It is important to mention that it is not recommended to use Beta versions of BIOS updates. It is preferable to keep the latest stable version, even if it is older.
Let the update wizard take you by the hand and use the BIOS update file to indicate that this is the new firmware to be installed. In case the downloaded update file is invalid or more updated to what you already have installed, the wizard software will detect it and will not perform the update.
Once this is done, restart your PC. We recommend that you check the main settings, checking that the date and time are correct, the boot order is correct (i.e. which hard drive is checked first for a Windows installation) and check that everything else is correct.
Now, you may continue working with the new BIOS version.
BIOS Update Considerations
Before making any BIOS updates, it is always recommended to back up the data so that this does not become your nightmare. For BIOS update, please consider these considerations:
- Updating the BIOS generally does not improve performance, so it should be done only if necessary.
- As we have seen, there are several methods for updating the BIOS, increasingly intuitive such as those in which the manufacturer itself offers an update wizard program that takes you by the hand throughout the process. It is important to follow the instructions that the manufacturer of your equipment indicates to prevent it from becoming unusable.
- Always investigate BIOS corruption recovery options and have that information handy. That is: get ready for any contingency. Many times, despite precautionary measures, the upgrade may fail, either due to incompatibility issues or an unfortunate blackout or power outage. Should that happen, and if the PC is still working, do not turn off the computer. Close the flash update tool and restart the update process to see if it works. If you made a BIOS backup dtry selecting this file to recover it.
Also some motherboards have backup BIOSes that help restore the BIOS. Or, the manufacturer sells BIOS chips from its online store, at a good price.
Finally, we would like to repeat once again the recommendation that you rely on an expert to update the BIOS.

by Pandora FMS team | Last updated Apr 2, 2024 | Community, Tech
You drink tap water every day, right? Do you know who invented the filtering mechanism that makes water pure and clean?… Well, do you actually care?
Do you know that this mechanism is exactly the same in all the taps of all the houses of any country? Do you know that this specialized piece is the work of an engineer who does it just because? Can you imagine what could happen if this person had a bad day?
Let’s talk about the XZ Utils library and why it is not a good idea to depend on a single supplier and make them angry. Let’s talk about the XZ Utils library and its latest developer, Jia Tan.
Yes, open source software can offer a series of benefits in terms of prices (because it is actually “free”), transparency, collaboration and adaptability, but it also entails risks regarding the security and excessive trust that we place as users.
What happened?
On March 29, Red Hat, Inc. disclosed the vulnerability CVE-2024-3094, with a score of 10 on the Common Vulnerability Scoring System scale, and, therefore, a critical vulnerability, which compromised the affected SSH servers.
This vulnerability affected the XZ Utils package, which is a set of software tools that provide file compression and decompression using the LZMA/LZMA2 algorithm, and is included in major Linux distributions. Had it not been discovered, it could have been very serious, since it was a malicious backdoor code, which would grant unauthorized remote access to the affected systems through SSH.
The vulnerability began in version 5.6.0 of XZ, and would also affect version 5.6.1.
During the liblzma building process it would retrieve an existing camouflaged test file in the source code, later used to modify specific functions in the liblzma code. The result is a modified liblzma library, which can be used by any software linked to it, intercepting and modifying data interaction with the library.
This process of implementing a backdoor in XZ is the final part of a campaign that was extended over 2 years of operations, mainly of the HUMNIT type (human intelligence) by the user Jia Tan.
User Jia Tan created his Github account in 2021, making their first commit to the XZ repository on February 6, 2022. More recently, on February 16, 2024, a malicious file would be added under the name of “build-to-host.m4” in .gitignore, later incorporated together with the launch of the package, to finally on March 9, 2024 incorporate the hidden backdoor in two test files:
- tests/files/bad-3-corrupt_lzma2.xz
- tests/files/good-large_compressed.lzma
How was it detected?
The main person in charge of locating this issue is Andres Freund.
It is one of the most important software engineers at Microsoft, who was performing micro-benchmarking tasks. During testing, they noticed that sshd processes were using an unusual amount of CPU even though the sessions were not established.
After profiling sshd, they saw a lot of CPU time in the liblzma library. This in turn reminded them of a recent bizarre complaint from Valgrind about automated testing in PostgreSQL. This behavior could have been overlooked and not discovered, leading to a large security breach on Debian/Ubuntu SSH servers.
As Andres Freund himself claims, a series of coincidences were required to be able to find this vulnerability, it was a matter of luck to have found it.
What set off Freund’s alarms was a small delay of only 0.5 sec in the ssh connections, which although it seems very little, was what led him to investigate further and find the problem and the potential chaos that it may have generated.
This underscores the importance of monitoring software engineering and security practices. The good news is that, the vulnerability has been found in very early releases of the software, so in the real world it has had virtually no effect, thanks to the quick detection of this malicious code. But it makes us think about what could have happened, if it had not been detected in time. It is not the first nor will be the last. The advantage of Open Source is that this has been made public and the impact can be evaluated, in other cases where there is no such transparency, the impact can be more difficult to evaluate and therefore, remediation.
Reflection
After what happened, we are in the right position to highlight both positive and negative points related to the use of open source.
As positive points we can find transparency and collaboration between developers from all over the world. Having a watchful community, in charge of detecting and reporting possible security threats, and have flexibility and adaptability, since the nature of open source allows adapting and modifying the software according to specific needs.
As for the disadvantages, we find the vulnerability to malicious attacks, as is the case with the action of developers with malicious intentions. Users trust that the software does not contain malicious code, which can lead to a false sense of security. In addition, due to the number of existing contributions and the complexity of the software itself, it can be said that it is very difficult to exhaustively verify the code.
If we add to all of that the existence of libraries maintained by one person or a very small group of people, the risk of single point of failure is greater. In this case, that need or benefit of having more people contributing is what caused the problem.
In conclusion, while open source software can offer us a number of benefits in terms of transparency, collaboration and adaptability, it can also present disadvantages or challenges in terms of the security and trust we place in it as users.

by Olivia Díaz | Last updated Apr 1, 2024 | Pandora FMS
Talking about too many cybersecurity alerts is not talking about the story of Peter and the Wolf and how people end up ignoring false warnings, but about its great impact on security strategies and, above all, on the stress it causes to IT teams, which we know are increasingly reduced and must fulfill multiple tasks in their day to day.
Alert Fatigue is a phenomenon in which excessive alerts desensitize the people in charge of responding to them, leading to missed or ignored alerts or, worse, delayed responses. IT security operations professionals are prone to this fatigue because systems are overloaded with data and may not classify alerts accurately.
Definición de Fatiga de Alertas y su impacto en la seguridad de la organización
Alert fatigue, in addition to overwhelming data to interpret, diverts attention from what is really important. To put it into perspective, deception is one of the oldest war tactics since the ancient Greeks: through deception, the enemy’s attention was diverted by giving the impression that an attack was taking place in one place, causing the enemy to concentrate its resources in that place so that it could attack on a different front. Taking this into an organization, cybercrime can actually cause and leverage IT staff fatigue to find security breaches. This cost could become considerable in business continuity and resource consumption (technology, time and human resources), as indicated by an article by Security Magazine on a survey of 800 IT professionals:
- 85% percent of information technology (IT) professionals say more than 20% of their cloud security alerts are false positives. The more alerts, the harder it becomes to identify which things are important and which ones are not.
- 59% of respondents receive more than 500 public cloud security alerts per day. Having to filter alerts wastes valuable time that could be used to fix or even prevent issues.
- More than 50% of respondents spend more than 20% of their time deciding which alerts need to be addressed first. Alert overload and false positive rates not only contribute to turnover, but also to the loss of critical alerts. 55% say their team overlooked critical alerts in the past due to ineffective prioritization of alerts, often weekly and even daily.
What happens is that the team in charge of reviewing the alerts becomes desensitized. By human nature, when we get a warning of every little thing, we get used to alerts being unimportant, so it is given less and less importance. This means finding the balance: we need to be aware of the state of our environment, but too many alerts can cause more damage than actually help, because they make it difficult to prioritize problems.
Causes of Alert Fatigue
Alert Fatigue is due to one or more of these causes:
These are situations where a security system mistakenly identifies a benign action or event as a threat or risk. They may be due to several factors, such as outdated threat signatures, poor (or overzealous) security settings, or limitations in detection algorithms.
Lack of context
Alerts must be interpreted, so if alert notifications do not have the proper context, it can be confusing and difficult to determine the severity of an alert. This leads to delayed responses.
Several security systems
Consolidation and correlation of alerts are difficult if there are several security systems working at the same time… and this gets worse when the volume of alerts with different levels of complexity grows.
Lack of filters and customization of cybersecurity alerts
If they are not defined and filtered, it may cause endless non-threatening or irrelevant notifications.
Unclear security policies and procedures
Poorly defined procedures become very problematic because they contribute to aggravating the problem.
Shortage of resources
It is not easy to have security professionals who know how to interpret and also manage a high volume of alerts, which leads to late responses.
The above tells us that correct management and alert policies are required, along with the appropriate monitoring tools to support IT staff.
Most common false positives
According to the Institute of Data, false positives faced by IT and security teams are:
False positives about network anomalies
These take place when network monitoring tools identify normal or harmless network activities as suspicious or malicious, such as false alerts for network scans, legitimate file sharing, or background system activities.
False malware positives
Antivirus software often identifies benign files or applications as potentially malicious. This can happen when a file shares similarities with known malware signatures or displays suspicious behavior. A cybersecurity false positive in this context can result in the blocking or quarantine of legitimate software, causing disruptions to normal operations.
False positives about user behavior
Security systems that monitor user activities can generate a cybersecurity false positive when an individual’s actions are flagged as abnormal or potentially malicious. Example: an employee who accesses confidential documents after working hours, generating a false positive in cybersecurity, even though it may be legitimate.
False positives can also be found in email security systems. For example, spam filters can misclassify legitimate emails as spam, causing important messages to end up in the spam folder. Can you imagine the impact of a vitally important email ending up in the Spam folder?
Consequences of Alert Fatigue
Alert Fatigue has consequences not only on the IT staff themselves but also on the organization:
False sense of security
Too many alerts can lead the IT team to think they are false positives, leaving out the actions that could be taken.
Late Response
Too many alerts overwhelm IT teams, preventing them from reacting in time to real and critical risks. This, in turn, causes costly remediation and even the need to allocate more staff to solve the problem that could have been avoided.
Regulatory non-compliance
Security breaches can lead to fines and penalties for the organization.
A breach of the company’s security gets disclosed (and we’ve seen headlines in the news) and impacts its reputation. This can lead to loss of customer trust… and consequently less revenue.
IT staff work overload
If the staff in charge of monitoring alerts feel overwhelmed with notifications, they may experience increased job stress. This has been one of the causes of lower productivity and high staff turnover in the IT area.
Deterioration of morale
Team demotivation can cause them to disengage and become less productive.
How to avoid these Alert Fatigue problems?
If alerts are designed before they are implemented, they become useful and efficient alerts, in addition to saving a lot of time and, consequently, reducing alert fatigue.
Prioritize
The best way to get an effective alert is to use the “less is more” strategy. You have to think about the absolutely essential things first.
- What equipment is absolutely essential? Hardly anyone needs alerts on test equipment.
- What is the severity if a certain service does not work properly? High impact services should have the most aggressive alert (level 1, for example).
- What is the minimum that is needed to determine that a computer, process, or service is not working properly?
Sometimes it is enough to monitor the connectivity of the device, some other times something more specific is needed, such as the status of a service.
Answering these questions will help us find out what the most important alerts are that we need to act on immediately.
Avoiding false positives
Sometimes it can be tricky to get alerts to only go off when there really is a problem. Setting thresholds correctly is a big part of the job, but more options are available. Pandora FMS has several tools to help avoid false positives:
Dynamic thresholds
They are very useful for adjusting the thresholds to the actual data. When you enable this feature in a module, Pandora FMS analyzes its data history, and automatically modifies the thresholds to capture data that is out of the ordinary.
- FF Thresholds: Sometimes the problem is not that you did not correctly define the alerts or thresholds, but that the metrics you use are not entirely reliable. Let’s say we are monitoring the availability of a device, but the connection to the network on which it is located is unstable (for example, a very saturated wireless network). This can cause data packets to be lost or even there are times when a ping fails to connect to the device despite being active and performing its function correctly. For those cases, Pandora FMS has the FF Threshold. By using this option you may configure some “tolerance” to the module before changing state. Thus, for example, the agent will report two consecutive critical data for the module to change into critical status.
- Use maintenance windows: Pandora FMS allows you to temporarily disable alerting and even event generation of a specific module or agent with the Quiet mode. With maintenance windows (Scheduled downtimes), this can be scheduled so that, for example, alerts do not trigger during X service updates in the early hours of Saturdays.
Improving alert processes
Once they have made sure that the alerts that are triggered are the necessary ones, and that they will only trigger when something really happens, you may greatly improve the process as follows:
- Automation: Alerting is not only used to send notifications; it can also be used to automate actions. Let’s imagine that you are monitoring an old service that sometimes becomes saturated, and when that happens, the way to recover it is to just restart it. With Pandora FMS you may configure the alert that monitors that service to try to restart it automatically. To do this, you just need to configure an alert command that, for example, makes an API call to the manager of said service to restart it.
- Alert escalation: Continuing with the previous example, with alert escalation you may make the first action performed by Pandora FMS, when the alert is triggered, to be the restart of the service. If in the next agent run, the module is still in critical state, you may configure the alert so that, for example, a ticket is created in Pandora ITSM.
- Alert thresholds: Alerts have an internal counter that indicates when configured actions should be triggered. Just by modifying the threshold of an alert you may go from having several emails a day warning you of the same problem to receiving one every two or three days.
This alert (executed daily) has three actions: at first, it is about restarting the service. If at the next alert execution, the module has not been recovered, an email is sent to the administrator, and if it has not yet been solved, a ticket is created in Pandora ITSM. If the alert remains triggered on the fourth run, a daily message will be sent through Slack to the group of operators.
Other ways to reduce the number of alerts
- Cascade Protection is an invaluable tool in setting up efficient alerting, by skipping triggering alerts from devices dependent on a parent device. With basic alerting, if you are monitoring a network that you access through a specific switch and this device has a problem, you will start receiving alerts for each computer on that network that you can no longer access. On the other hand, if you activate cascade protection on the agents of that network (indicating whether they depend on the switch), Pandora FMS will detect that the main equipment is down, and will skip the alert of all dependent equipment until the switch is operational again.
- Using services can help you not only reduce the number of alerts triggered, but also the number of alerts configured. If you have a cluster of 10 machines, it may not be very efficient to have an alert for each of them. Pandora FMS allows you to group agents and modules into Services, along with hierarchical structures in which you may decide the weight of each element and alert based on the general status.
Implement an Incident Response Plan
Incident response is the process of preparing for cybersecurity threats, detecting them as they arise, responding to quell them, or mitigating them. Organizations can manage threat intelligence and mitigation through incident response planning. It should be remembered that any organization is at risk of losing money, data, and reputation due to cybersecurity threats.
Incident response requires assembling a team of people from different departments within an organization, including organizational leaders, IT staff, and other areas involved in data control and compliance. The following is recommended:
- Plan how to analyze data and networks for potential threats and suspicious activity.
- Decide which incidents should be responded to first.
- Have a plan for data loss and finances.
- Comply with all applicable laws.
- Be prepared to submit data and documentation to the authorities after a violation.
Finally, a timely reminder: incident response became very important starting with GDPR with extremely strict rules on non-compliance reporting. If a specific breach needs to be reported, the company must be aware of it within 72 hours and report what happened to the appropriate authorities. A report of what happened should also be provided and an active plan to mitigate the damage should be presented. If a company does not have a predefined incident response plan, it will not be ready to submit such a report.
The GDPR also requires to know if the organization has adequate security measures in place. Companies can be heavily penalized if they are scrutinized after the breach and officials find that they did not have adequate security.
Conclusion
The high cost to both IT staff (constant turnover, burnout, stress, late decisions, etc.) and the organization (disruption of operations, security breaches and breaches, quite onerous penalties) is clear. While there is no one-size-fits-all solution to prevent over-alerting, we do recommend prioritizing alerts, avoiding false positives (dynamic and FF thresholds, maintenance windows), improving alerting processes, and an incident response plan, along with clear policies and procedures for responding to incidents, to ensure you find the right balance for your organization.
Contact us to accompany you with the best practices of Monitoring and alerts.
If you were interested in this article, you can also read: Dynamic thresholds in monitoring. Do you know what they are used for?

by Ahinóam Rodríguez | Last updated Mar 18, 2024 | Pandora FMS
Today, many companies generate and store huge amounts of data. To give you an idea, decades ago, the size of the Internet was measured in Terabytes (TB) and now it is measured in Zettabytes (ZB).
Relational databases were designed to meet the storage and information management needs of the time. Today we have a new scenario where social networks, IoT devices and Edge Computing generate millions of unstructured and highly variable data. Many modern applications require high performance to provide quick responses to user queries.
In relational DBMSs, an increase in data volume must be accompanied by improvements in hardware capacity. This technological challenge forced companies to look for more flexible and scalable solutions.
NoSQL databases have a distributed architecture that allows them to scale horizontally and handle continuous and fast data flows. This makes them a viable option in high-demand environments such as streaming platforms where data processing takes place in real time.
Given the interest in NoSQL databases in the current context, we believe it is essential to develop a user guide that helps developers understand and effectively use this technology. In this article we aim to clarify some basics about NoSQL, giving practical examples and providing recommendations on implementation and optimization to make the most of its advantages.
NoSQL data modeling
One of the biggest differences between relational and non-relational bases lies in the approach we took to data modeling.
NoSQL databases do not follow a rigid and predefined scheme. This allows developers to freely choose the data model based on the features of the project.
The fundamental goal is to improve query performance, getting rid of the need to structure information in complex tables. Thus, NoSQL supports a wide variety of denormalized data such as JSON documents, key values, columns, and graph relationships.
Each NoSQL database type is optimized for easy access, query, and modification of a specific class of data. The main ones are:
- Key-value: Redis, Riak or DyamoDB. These are the simplest NoSQL databases. They store the information as if it were a dictionary based on key-value pairs, where each value is associated with a unique key. They were designed to scale quickly ensuring system performance and data availability.
- Documentary: MongoDB, Couchbase. Data is stored in documents such as JSON, BSON or XML. Some consider them an upper echelon of key-value systems since they allow encapsulating key-value pairs in more complex structures for advanced queries.
- Column-oriented: BigTable, Cassandra, HBase. Instead of storing data in rows like relational databases do, they do it in columns. These in turn are organized into logically ordered column families in the database. The system is optimized to work with large datasets and distributed workloads.
- Graph-oriented: Neo4J, InfiniteGraph. They save data as entities and relationships between entities. The entities are called “nodes” and the relationships that bind the nodes are the “edges”. They are perfect for managing data with complex relationships, such as social networks or applications with geospatial location.
NoSQL data storage and partitioning
Instead of making use of a monolithic and expensive architecture where all data is stored on a single server, NoSQL distributes the information on different servers known as “nodes” that join in a network called “cluster“.
This feature allows NoSQL DBMSs to scale horizontally and manage large volumes of data using partitioning techniques.
What is NoSQL database partitioning?
It is a process of breaking up a large database into smaller, easier-to-manage chunks.
It is necessary to clarify that data partitioning is not exclusive to NoSQL. SQL databases also support partitioning, but NoSQL systems have a native function called “auto-sharding” that automatically splits data, balancing the load between servers.
When to partition a NoSQL database?
There are several situations in which it is necessary to partition a NoSQL database:
- When the server is at the limit of its storage capacity or RAM.
- When you need to reduce latency. In this case you get to balance the workload on different cluster nodes to improve performance.
- When you wish to ensure data availability by initiating a replication procedure.
Although partitioning is used in large databases, you should not wait for the data volume to become excessive because in that case it could cause system overload.
Many programmers use AWS or Azure to simplify the process. These platforms offer a wide variety of cloud services that allow developers to skip the tasks related to database administration and focus on writing the code of their applications.
Partitioning techniques
There are different techniques for partitioning a distributed architecture database.
- Clustering
It consists of grouping several servers so that they work together as if they were one. In a clustering environment, all nodes in the cluster share the workload to increase system throughput and fault tolerance.
- Separation of Reads and Writes
It consists of directing read and write operations to different nodes in the cluster. For example, read operations can be directed to replica servers acting as children to ease the load on the parent node.
- Sharding
Data is divided horizontally into smaller chunks called “shards” and distributed across different nodes in the cluster.
It is the most widely used partitioning technique in databases with distributed architecture due to its scalability and ability to self-balance the system load, avoiding bottlenecks.
- Consistent Hashing
It is an algorithm that is used to efficiently allocate data to nodes in a distributed environment.
The idea of consistent hashes was introduced by David Karger in a research paper published in 1997 and entitled “Consistent Hashing and Random Trees: Distributed Caching Protocols for Relieving Hot Spots on the World Wide Web“.
In this academic work, the “Consistent Hashing” algorithm was proposed for the first time as a solution to balance the workload of servers with distributed databases.
It is a technique that is used in both partitioning and data replication, since it allows to solve problems common to both processes such as the redistribution of keys and resources when adding or removing nodes in a cluster.
Nodes are represented in a circular ring and each data is assigned to a node using a hash function. When a new node is added to the system, the data is redistributed between the existing nodes and the new node.
The hash works as a unique identifier so that when you make a query, you just have to locate that point on the ring.
An example of a NoSQL database that uses “Consistent Hashing” is DynamoDB, since one of its strengths is incremental scaling, and to achieve this it needs a procedure capable of fractionating data dynamically.
Replication in NoSQL databases
It consists of creating copies of the data on multiple machines. This process seeks to improve database performance by distributing queries among different nodes. At the same time, it ensures that the information will continue to be available, even if the hardware fails.
The two main ways to perform data replication (in addition to the Consistent Hashing that we already mentioned in the previous section) are:
Master-slave server
Writing is made to the primary node and from there data is replicated to secondary nodes.
Peer to peer
All nodes in the cluster have the same hierarchical level and can accept writing. When data is written to one node it spreads to all the others. This ensures availability, but can also lead to inconsistencies if conflict resolution mechanisms are not implemented (for example, if two nodes try to write to the same location at the same time).
CAP theorem and consistency of NoSQL databases.
The CAP theorem was introduced by Professor Eric Brewer of the University of Berkeley in the year 2000. He explains that a distributed database can meet two of these three qualities at the same time:
- Consistency: All requests after the writing operation get the same value, regardless of where the queries are made.
- Availability: The database always responds to requests, even if a failure takes place.
- Partition Tolerance: The system continues to operate even if communication between some nodes is interrupted.
Under this scheme we could choose a DBMS that is consistent and partition tolerant (MongoDB, HBase), available and partition tolerant (DynamoDB, Cassandra), or consistent and available (MySQL), but all three features cannot be preserved at once.
Each development has its requirements and the CAP theorem helps us find the DBMS that best suits your needs. Sometimes it is imperative for data to be consistent at all times (for example, in a stock control system). In these cases, we usually work with a relational database. In NoSQL databases, consistency is not one hundred percent guaranteed, since changes must propagate between all nodes in the cluster.
BASIS and eventual consistency model in NoSQL
BASE is a concept opposed to the ACID properties (atomicity, consistency, isolation, durability) of relational databases. In this approach, we prioritize data availability over immediate consistency, which is especially important in applications that process data in real time.
The BASE acronym means:
- Basically Available: The database always sends a response, even if it contains errors if readings occur from nodes that did not yet receive the last writing.
- Soft state: The database may be in an inconsistent state when reading takes place, so you may get different results on different readings.
- Eventually Consistent: Database consistency is reached once the information has been propagated to all nodes. Up to that point we talk about an eventual consistency.
Even though the BASE approach arose in response to ACID, they are not exclusionary options. In fact, some NoSQL databases like MongoDB offer configurable consistency.
Tree indexing in NoSQL databases. What are the best-known structures?
So far we have seen how data is distributed and replicated in a NoSQL database, but we need to explain how it is structured efficiently to make its search and retrieval easier.
Trees are the most commonly used data structures. They organize nodes hierarchically starting from a root node, which is the first tree node; parent nodes, which are all those nodes that have at least one child; and child nodes, which complete the tree.
The number of levels of a tree determines its height. It is important to consider the final size of the tree and the number of nodes it contains, as this can influence query performance and data recovery time.
There are different tree indexes that you may use in NoSQL databases.
B Trees
They are balanced trees and perfect for distributed systems for their ability to maintain index consistency, although they can also be used in relational databases.
The main feature of B trees is that they can have several child nodes for each parent node, but they always keep their height balanced. This means that they have an identical or very similar number of levels in each tree branch, a particularity that makes it possible to handle insertions and deletions efficiently.
They are widely used in filing systems, where large data sets need to be accessed quickly.
T Trees
They are also balanced trees that can have a maximum of two or three child nodes.
Unlike B-trees, which are designed to make searches on large volumes of data easier, T-trees work best in applications where quick access to sorted data is needed.
AVL Trees
They are binary trees, which means that each parent node can have a maximum of two child nodes.
Another outstanding feature of AVL trees is that they are balanced in height. The self-balancing system serves to ensure that the tree does not grow in an uncontrolled manner, something that could harm the database performance.
They are a good choice for developing applications that require quick queries and logarithmic time insertion and deletion operations.
KD Trees
They are binary, balanced trees that organize data into multiple dimensions. A specific dimension is created at each tree level.
They are used in applications that work with geospatial data or scientific data.
Merkle Trees
They represent a special case of data structures in distributed systems. They are known for their utility in Blockchain to efficiently and securely encrypt data.
A Merkle tree is a type of binary tree that offers a first-rate solution to the data verification problem. Its creator was an American computer scientist and cryptographer named Ralph Merkle in 1979.
Merkle trees have a mathematical structure made up by hashes of several blocks of data that summarize all transactions in a block.
Data is grouped into larger datasets and related to the main nodes until all the data within the system is gathered. As a result, the Merkle Root is obtained.
How is the Merkle Root calculated?
1. The data is divided into blocks of a fixed size.
2. Each data block is subjected to a cryptographic hash function.
3. Hashes are grouped into pairs and a function is again applied to these pairs to generate their corresponding parent hashes until only one hash remains, which is the Merkle root.
The Merkle root is at the top of the tree and is the value that securely represents data integrity. This is because it is strongly related to all datasets and the hash that identifies each of them. Any changes to the original data will alter the Merkle Root. That way, you can make sure that the data has not been modified at any point.
This is why Merkle trees are frequently employed to verify the integrity of data blocks in Blockchain transactions.
NoSQL databases like Cassandra draw on these structures to validate data without sacrificing speed and performance.
Comparison between NoSQL database management systems
From what we have seen so far, NoSQL DBMSs are extraordinarily complex and varied. Each of them can adopt a different data model and present unique storage, consultation and scalability features. This range of options allows developers to select the most appropriate database for their project needs.
Below, we will give as an example two of the most widely used NoSQL DBMSs for the development of scalable and high-performance applications: MongoDB and Apache Cassandra.
MongoDB
It is a documentary DBMS developed by 10gen in 2007. It is open source and has been created in programming languages such as C++, C and JavaScript.
MongoDB is one of the most popular systems for distributed databases. Social networks such as LinkedIn, telecommunications companies such as Telefónica or news media such as the Washington Post use MongoDB.
Here are some of its main features.
- Database storage with MongoDB: MongoDB stores data in BSON files (binary JSON). Each database consists of a collection of documents. Once MongoDB is installed and Shell is running, you may create the DB just by indicating the name you wish to use. If the database does not already exist, MongoDB will automatically create it when adding the first collection. Similarly, a collection is created automatically when you store a file in it. You just have to add the first document and execute the “insert” statement and MongoDB will create an ID field assigning it an ObjectID value that is unique for each machine at the time the operation is executed.
- DB Partitioning with MongoDB: MongoDB makes it easy to distribute data across multiple servers using the automatic sharding feature. Data fragmentation takes place at the collection level, distributing documents among the different cluster nodes. To carry out this distribution, a “partition key” defined as a field is used in all collection documents. Data is fragmented into “chunks”, which have a default size of 64 MB and are stored in different shards within the cluster, ensuring that there is a balance. MongoBD monitors continuously chunk distribution among the shard nodes and, if necessary, performs automatic rebalancing to ensure that the workload supported by these nodes is balanced.
- DB Replication with MongoDB: MongoDB uses a replication system based on the master-slave architecture. The master server can perform writing and reading operations, but slave nodes only perform reads (replica set). Updates are communicated to slave nodes via an operation log called oplog.
- Database Queries with MongoDB: MongoDB has a powerful API that allows you to access and analyze data in real time, as well as perform ad-hoc queries, that is, direct queries on a database that are not predefined. This gives users the ability to perform custom searches, filter documents, and sort results by specific fields. To carry out these queries, MongoDB uses the “find” method on the desired collection or “findAndModify” to query and update the values of one or more fields simultaneously.
- DB Consistency with MongoDB: From version 4.0 (the most recent one is 6.0), MongoDB supports ACID transactions at document level. The “snapshot isolation” function provides a consistent view of the data and allows atomic operations to be performed on multiple documents within a single transaction. This feature is especially relevant for NoSQL databases, as it poses solutions to different consistency-related issues, such as concurrent writes or queries that return outdated file versions. In this respect, MongoDB comes very close to the stability of RDMSs.
- Database indexing with MongoDB: MongoDB uses B trees to index the data stored in its collections. This is a variant of the B trees with index nodes that contain keys and pointers to other nodes. These indexes store the value of a specific field, allowing data recovery and deletion operations to be more efficient.
- DB Security with MongoDB: MongoDB has a high level of security to ensure the confidentiality of stored data. It has several authentication mechanisms, role-based access configuration, data encryption at rest and the possibility of restricting access to certain IP addresses. In addition, it allows you to audit the activity of the system and keep a record of the operations carried out in the database.
Apache Cassandra
It is a column-oriented DBMS that was developed by Facebook to optimize searches within its platform. One of the creators of Cassandra is computer scientist Avinash Lakshman, who previously worked for Amazon, as part of the group of engineers who developed DynamoDB. For that reason, it does not come as a surprise that it shares some features with this other system.
In 2008 it was launched as an open source project, and in 2010 it became a top-level project of the Apache Foundation. Since then, Cassandra continued to grow to become one of the most popular NoSQL DBMSs.
Although Meta uses other technologies today, Cassandra is still part of its data infrastructure. Other companies that use it are Netflix, Apple or Ebay. In terms of scalability, it is considered one of the best NoSQL databases.
Let’s take a look at some of its key properties:
- Database storage with Apache Cassandra: Cassandra uses a “Column Family” data model, which is similar to relational databases, but more flexible. It does not refer to a hierarchical structure of columns that contain other columns, but rather to a collection of key-value pairs, where the key identifies a row and the value is a set of columns. It is designed to store large amounts of data and perform more efficient writing and reading operations.
- DB Partitioning with Apache Cassandra: For data distribution, Cassandra uses a partitioner that distributes data to different cluster nodes. This partitioner uses the algorithm “consistent hashing” to assign a unique partition key to each data row. Data possessing the same partition key will stay together on the same nodes. It also supports virtual nodes (vnodes), which means that the same physical node may have multiple data ranges.
- DB Replication with Apache Cassandra: Cassandra proposes a replication model based on Peer to peer in which all cluster nodes accept reads and writes. By not relying on a master node to process requests, the chance of a bottleneck occurring is minimal. Nodes communicate with each other and share data using a gossiping protocol.
- DB Queries with Apache Cassandra: Like MongoDB, Cassandra also supports ad-hoc queries, but these tend to be more efficient if they are based on the primary key. In addition, it has its own query language called CQL (Cassandra Query Language) with a syntax similar to that of SQL, but instead of using joins, it takes its chances on data denormalization.
- DB Indexation with Apache Cassandra: Cassandra uses secondary indexes to allow efficient queries on columns that are not part of the primary key. These indices may affect individual columns or multiple columns (SSTable Attached Secondary Index). They are created to allow complex range, prefix or text search queries in a large number of columns.
- DB Coherence with Apache Cassandra: By using Peer to Peer architecture, Cassandra plays with eventual consistency. Data is propagated asynchronously across multiple nodes. This means that, for a short period of time, there may be discrepancies between the different replicas. However, Cassandra also provides mechanisms for setting the consistency level. When a conflict takes place (for example, if the replicas have different versions), use the timestamp and validate the most recent version. In addition, perform automatic repairs to maintain data consistency and integrity if hardware failures or other events that may cause discrepancies between replicas take place.
- DB Security with Apache Cassandra: To use Cassandra in a safe environment, it is necessary to perform configurations, since many options are not enabled by default. For example, activate the authentication system and set permissions for each user role. In addition, it is critical to encrypt data in transit and at rest. For communication between the nodes and the client, data in transit can be encrypted using SSL/TLS.
Challenges in managing NoSQL databases. How does Pandora FMS help?
NoSQL DBMSs offer developers the ability to manage large volumes of data and scale horizontally by adding multiple nodes to a cluster.
To manage these distributed infrastructures, it is necessary to master different data partitioning and replication techniques (for example, we have seen that MongoDB uses a master-slave architecture, while Cassandra prioritizes availability with the Peer to peermodel).
Unlike RDMS, which share many similarities, in NoSQL databases there is no common paradigm and each system has its own APIs, languages and a different implementation, so getting used to working with each of them can be a real challenge.
Considering that monitoring is a fundamental component for managing any database, we must be pragmatic and rely on those resources that make our lives easier.
Both MongoDB and Apache Cassandra have commands that return system status information and allow problems to be diagnosed before they become critical failures. Another possibility is to use Pandora FMS software to simplify the whole process.
How to do so?
If this is a database in MongoDB, download Pandora FMS plugin for MongoDB. This plugin uses the mongostat command to collect basic information about system performance. Once the relevant metrics are obtained, they are sent to Pandora FMS data server for their analysis.
On the other hand, if the database works with Apache Cassandra, download the corresponding plugin for this system. This plugin obtains the information by internally running the tool nodetool, which is already included in the standard Cassandra installation, and offers a wide range of commands to monitor server status. Once the results are analyzed, the plugin structures the data in XML format and sends it to Pandora FMS server for further analysis and display.
For these plugins to work properly, copy the files to the plugin directory of Pandora FMS agent, edit the configuration file and, finally, restart the system (the linked articles explain the procedure very well).
Once the plugins are active, you will be able to monitor the activity of the cluster nodes in a graph view and receive alerts should any failures take place. These and other automation options help us save considerable time and resources in maintaining NoSQL databases.
Create a free account and discover all Pandora FMS utilities to boost your digital project!
And if you have doubts about the difference between NoSQL and SQL you can consult our post “NoSQL vs SQL: main differences and when to choose each of them“.

by Pandora FMS team | Last updated Mar 12, 2024 | Pandora FMS
Today, digital trust is required inside and outside the organization, so tools must be implemented, with cybersecurity methods and best practices in each layer of your systems and their infrastructure: applications, operating systems, users, both on-premise and in the cloud. This is what we call System Hardening an essential practice that lays the foundation for a safe IT infrastructure. Its goal is to reduce the attack surface as much as possible, strengthening the systems to be able to face possible security attacks and get rid of as many entry points for cybercrime as possible.
Comprehensive Approach to Organizational Security
To implement organizational security, a comprehensive approach is undoubtedly required, since devices (endpoints, sensors, IoT), hardware, software, local environments, cloud (and hybrid) environments must be considered, along with security policies and local and even international regulatory compliance. It should be remembered that today and in the future we must not only protect an organization’s digital assets, but also avoid downtime and possible regulatory sanctions (associated with non-compliance with GDPR and data protection laws). Hardening also helps lay the solid foundation on which to implement advanced security solutions. Later, in Types of Hardening we will see where it is possible to implement security strengthening.
Benefits of Hardening in Cybersecurity
- Improved system functionality: Hardening measures help optimize system resources, eliminate unnecessary services and software, and apply security patches and updates. The consequences of actions lead to better system performance, as fewer resources are also wasted on unused or vulnerable components.
- Increased security level: A strengthened system reduces the surface area of a potential attack and strengthens defenses against threats (e.g., malware, unauthorized access, and data breaches). Confidential information is protected and user privacy is guaranteed.
- Compliance simplification and auditing: Organizations must comply with industry-specific security standards and regulations to protect sensitive data. Hardening helps meet these requirements and ensures compliance with industry-specific standards, such as GDPR (personal data protection), the payment card industry’s data security standard (PCI DSS) or the Health Insurance Portability and Accountability Acts (HIPAA, to protect a health insurance user’s data).
Other benefits include ensuring business continuity (without disruption or frictions), multi-layered defense (access controls, encryption, firewalls, intrusion detection systems, and regular security audits), and the ability to take a more proactive stance on security, with regular assessments and updates to prepare for emerging threats and vulnerabilities.
Every safe system must have been previously secured, and this is precisely what hardening consists of.
Types of Hardening
In the IT infrastructure set, there are several subsets that require different security approaches:
1. Configuration Management Hardening
Implementing and configuring security for multiple system components (including hardware, operating systems, and software applications). It also involves disabling unnecessary services and protocols, configuring access controls, implementing encryption, and safe communication protocols. It’s worth mentioning that security and IT teams often keep conflicting agendas. The hardening policy should take into account discussions between the two parties. It is also recommended to implement:
- Configurable item assessment: From user accounts and logins, server components and subsystems, what software and application updates and vulnerabilities to perform, networks and firewalls, remote access and log management, etc.
- Finding the balance between security and features: Hardening’s policy should consider both the requirements of the security team and the ability of the IT team to implement it using currently assigned levels of time and manpower. It must also be decided which challenges must be faced and which are not worthwhile for operational times and costs.
- Change management and “configuration drift” prevention: In Hardening, continuous monitoring must be implemented, where automation tools contribute to compliance with requirements at any time, getting rid of the need for constant scanning. Also, in unwanted changes, hardening policies that can happen in the production environment can be reinforced. Finally, in case of unauthorized changes, automation tools help detect anomalies and attacks to implement preventive actions.
2. Application Hardening
Protection of software applications running on the system, by removing or disabling unnecessary features, application-specific patching and security updates, along with safe coding practices and access controls, in addition to application-level authentication mechanisms. The importance of application security lies in the fact that users in the organization ask for safe and stable environments; on the part of the staff, patch and update application allows them to react to threats and implement preventive measures. Remember that users are often the entry point into the organization for cybercrime. Among the most common techniques, we can highlight:
- Install applications only from trusted repositories.
- Patch automations of standard and third-party applications.
- Installation of firewalls, antivirus and malware or spyware protection programs.
- Software-based data encryption.
- Password management and encryption applications.
3. Operating System (OS) Hardening
Configuring the operating system to minimize vulnerabilities, either by disabling unnecessary services, shutting down unused ports, implementing firewalls and intrusion detection systems, enforcing strong password policies, and regularly applying security patches and updates. Among the most recommended methods, there are the following:
- Applying the latest updates released by the operating system developer.
- Enable built-in security features (Microsoft Defender or third-party Endpoint Protection platform software or EPP, Endpoint Detection Rate or EDR from third parties). This will perform a malware search on the system (Trojan horses, sniffer, password sniffers, remote control systems, etc.).
- Remove unnecessary drivers and update used ones.
- Delete software installed on the machine that is unnecessary.
- Enable secure boot.
- Restrict system access privileges.
- Use biometrics or authentication FIDO (Fast Identity Online) in addition to passwords.
Also, a strong password policy can be implemented, protect sensitive data with AES encryption or self-encrypting drives, firmware resiliency technologies, and/or multi-factor authentication.
4. Server Hardening
Removing vulnerabilities (also known as attack vectors) that a hacker could use to access the server. It focuses on securing data, ports, components and server functions, implementing security protocols at hardware, firmware and software level. The following is recommended:
- Patch and update your operating systems periodically.
- Update third-party software needed to run your servers according to industry security standards.
- Require users to create and maintain complex passwords consisting of letters, numbers, and special characters, and update these passwords frequently.
- Lock an account after a certain number of failed login attempts.
- Disable certain USB ports when a server is booted.
- Leverage multi-factor authentication (MFA)
- Using encryption AES or self-encrypted drives to hide and protect business-critical information.
- Use virus and firewall protection and other advanced security solutions.
5. Network Hardening
Protecting network infrastructure and communication channels. It involves configuring firewalls, implementing intrusion prevention systems (IPS) and intrusion detection systems (IDS), encryption protocols such as SSL/TLS, and segmenting the network to reduce the impact of a breach and implement strong network access controls. It is recommended to combine IPS and IDS systems, in addition to:
- Proper configuration of network firewalls.
- Audits of network rules and access privileges.
- Disable unnecessary network ports and network protocols.
- Disable unused network services and devices.
- Network traffic encryption.
It is worth mentioning that the implementation of robust monitoring and recording mechanisms is essential to strengthen our system. It involves setting up a security event log, monitoring system logs for suspicious activity, implementing intrusion detection systems, and conducting periodic security audits and reviews to identify and respond to potential threats in a timely manner.
Practical 9-Step Hardening Application
Although each organization has its particularities in business systems, there are general hardening tasks applicable to most systems. Below is a list of the most important tasks as a basic checklist:
1. Manage access: Ensure that the system is physically safe and that staff are informed about security procedures. Set up custom roles and strong passwords. Remove unnecessary users from the operating system and prevent the use of root or “superadmin” accounts with excessive privileges. Also, limit the membership of administrator groups: only grant elevated privileges when necessary.
2. Monitor network traffic: Install hardened systems behind a firewall or, if possible, isolated from public networks. A VPN or reverse proxy must be required to connect. Also, encrypt communications and establish firewall rules to restrict access to known IP ranges.
3. Patch vulnerabilities: Keep operating systems, browsers, and any other applications up to date and apply all security patches. It is recommended to keep track of vendor safety advisories and the latest CVEs.
4. Remove Unnecessary Software: Uninstall any unnecessary software and remove redundant operating system components. Unnecessary services and any unnecessary application components or functions that may expand the threat surface must be disabled.
5. Implement continuous monitoring: Periodically review logs for anomalous activity, with a focus on authentications, user access, and privilege escalation. Reflect records in a separate location to protect the integrity of records and prevent tampering. Conduct regular vulnerability and malware scans and, if possible, conduct an external audit or penetration test.
6. Implement secure communications: Secure data transfer using safe encryption. Close all but essential network ports and disable unsafe protocols such as SMBv1, Telnet, and HTTP.
7. Performs periodic backups: Hardened systems are, by definition, sensitive resources and should be backed up periodically using the 3-2-1 rule (three copies of the backup, on two types of media, with one copy stored off-site).
8. Strengthen remote sessions: If you must allow Secure Shell or SSH (remote administration protocol), make sure a safe password or certificate is used. The default port must be avoided, in addition to disabling elevated privileges for SSH access. Monitor SSH records to identify anomalous uses or privilege escalation.
9. Monitor important metrics for security:Monitor logs, accesses, number of connections, service load (CPU, Memory), disk growth. All these metrics and many more are important to find out if you are being subjected to an attack. Having them monitored and known in real time can free you from many attacks or service degradations.
Hardening on Pandora FMS
Pandora FMS incorporates a series of specific features to monitor server hardening, both Linux and Windows. For that, it runs a special plugin that will perform a series of checks, scoring whether or not it passes the registration. These checks are scheduled to run from time to time. The graphical interface structures what is found in different categories, and the evolution of system security over time can be visually analyzed, as a temporal graph. In addition, detailed technical reports can be generated for each machine, by groups or made comparative.
It is important to approach the security tasks of the systems in a methodical and organized way, attending first to the most critical and being methodical, in order to be able to do it in all systems equally. One of the fundamental pillars of computer security is the fact of not leaving cracks, if there is an entrance door, however small it may be, and as much as we secured the rest of the machines, it may be enough to have an intrusion in our systems.
The Center for Internet Security (CIS) leads the development of international hardening standards and publishes security guidelines to improve cybersecurity controls. Pandora FMS uses the recommendations of the CIS to implement a security audit system, integrated with monitoring to observe the evolution of Hardening throughout your organization, system by system.
Use of CIS Categories for Safety Checks
There are more than 1500 individual checks to ensure the security of systems managed by Pandora FMS. Next, we mention the CIS categories audited by Pandora FMS and some recommendations:
- Hardware and software asset inventory and control
It refers to all devices and software in your organization. Keeping an up-to-date inventory of your technology assets and using authentication to block unauthorized processes is recommended.
- Device inventory and control
It refers to identifying and managing your hardware devices so that only those who are authorized have access to systems. To do this, you have to maintain adequate inventory, minimize internal risks, organize your environment and provide clarity to your network.
- Vulnerability Management
Continuously scanning assets for potential vulnerabilities and remediating them before they become the gateway to an attack. Patch updating and security measures in the software and operating systems must be ensured.
- Controlled use of administrative privileges
It consists of monitoring access controls and user performance with privileged accounts to prevent any unauthorized access to critical systems. It must be ensured that only authorized people have elevated privileges to avoid any misuse of administrative privileges.
- Safe hardware and software configuration
Security configuration and maintenance based on standards approved by your organization. A rigorous configuration management system should be created, to detect and alert about any misconfigurations, along with a change control process to prevent attackers from taking advantage of vulnerable services and configurations.
- Maintenance, supervision and analysis of audit logs and records
Collection, administration and analysis of event audit logs to identify possible anomalies. Detailed logs are required to fully understand attacks and to be able to effectively respond to security incidents.
- Defenses against malware
Supervision and control of installation and execution of malicious code at multiple points in the organization to prevent attacks. Anti-malware software should be configured and used and take advantage of automation to ensure quick defense updates and swift corrective action in the event of attacks.
- Email and Web Browser Protection
Protecting and managing your web browsers and email systems against online threats to reduce the attack surface. Deactivate unauthorized email add-ons and ensure that users only access trusted websites using network-based URL filters. Remember to keep these most common gateways safe from attacks.
- Data recovery capabilities
Processes and tools to ensure your organization’s critical information is adequately supported. Make sure you have a reliable data recovery system in place to restore information in the event of attacks that compromise critical data.
- Boundary defense and data protection
Identification and classification of sensitive data, along with a number of processes including encryption, data leak protection plans, and data loss prevention techniques. It establishes strong barriers to prevent unauthorized access.
- Account Monitoring and Control
Monitor the entire lifecycle of your systems and application accounts, from creation through use and inactivity to deletion. This active management prevents attackers from taking advantage of legitimate but inactive user accounts for malicious purposes and allows them to maintain constant control over the accounts and their activities.
It is worth mentioning that not all categories are applicable in a system, but there are controls to verify whether or not they apply. Let’s look at some screens as an example of display.
Detail example in a hardening control of a Linux (Debian) server
This control explains that it is advisable to disable the ICMP packet forwarding, as contemplated in the recommendations of CIS, PCI_DSS, NIST and TSC.
Example listing of checks by group (in this case, network security)
Example of controls, by category on a server:
The separation of the controls by category is key to be able to organize the work and to delimit the scope, for example, there will be systems not exposed to the network where you may “ignore” the network category, or systems without users, where you may avoid user control.
Example of the evolution of the hardening of a system over time:
This allows you to see the evolution of securitization in a system (or in a group of systems). Securitization is not an easy process, since there are dozens of changes, so it is important to address it in a gradual way, that is, planning their correction in stages, this should produce a trend over time, like the one you may see in the attached image. Pandora FMS is a useful tool not only for auditing, but also for monitoring the system securitization process.
Other additional safety measures related to hardening
- Permanent vulnerability monitoring. Pandora FMS also integrates a continuous vulnerability detection system, based on mitre databases (CVE, Common Vulnerabilities and Exposure) and NIST to continuously audit vulnerable software across your organization. Both the agents and the remote Discovery component are used to determine on which of your systems there is software with vulnerabilities. More information here.
- Flexibility in inventory: Whether you use Linux systems from different distributions or any Windows version, the important thing is to know and map our infrastructure well: installed software, users, paths, addresses, IP, hardware, disks, etc. Security cannot be guaranteed if you do not have a detailed inventory.
- Constant monitoring of security infrastructure: It is important to monitor the status of specific security infrastructures, such as backups, antivirus, VPN, firewalls, IDs/IPS, SIEM, honeypots, authentication systems, storage systems, log collection, etc.
- Permanent monitoring of server security: Verifying in real time the security of remote access, passwords, open ports and changes to key system files.
- Proactive alerts: Not only do we help you spot potential security breaches, but we also provide proactive alerts and recommendations to address any issues before they become a real threat.
I invite you to watch this video about Hardening on Pandora FMS
Positive impact on safety and operability
As we have seen, hardening is part of the efforts to ensure business continuity. A proactive stance on server protection must be taken, prioritizing risks identified in the technological environment and applying changes gradually and logically. Patches and updates must be applied constantly as a priority, relying on automated monitoring and management tools that ensure the fast correction of possible vulnerabilities. It is also recommended to follow the best practices specific to each hardening area in order to guarantee the security of the whole technological infrastructure with a comprehensive approach.
Additional Resources
Links to Pandora FMS documentation or read the references to CIS security guidelines: See interview with Alexander Twaradze, Pandora FMS representative to countries implementing CIS standards.

by Olivia Díaz | Last updated Mar 4, 2024 | Remote Control
From the computer, we increasingly perform different tasks simultaneously (listening to music while writing a report, receiving files by email and downloading videos), which involve executing commands, and sending and receiving data. Over time, computer performance can suffer if CPU usage is not optimized.
But what is a CPU?
CPU stands for central processing unit. The CPU itself is the brain of a computer, on which most calculations and processes are performed. The two components of a CPU are:
- The arithmetic logic unit (ALU), which performs arithmetic and logical operations.
- The Control Unit (CU), which retrieves instructions from the memory, decodes and executes them, calling the ALU when necessary.
In this diagram you may see that the CPU also contains the memory unit, which contains the following elements:
- The ROM (Read Only Memory): It is a read-only memory; that is, you may only read the programs and data stored in it. It is also a primary memory unit of the computer system, and contains some electronic fuses that can be programmed for specific information. The information is stored in ROM in binary format. It is also known as permanent memory.
- The RAM (Random Access Memory): As its name suggests, it is a type of computer memory that can be accessed randomly, any byte of memory without handling the previous bytes. RAM is a high-speed component on devices that temporarily stores all the information a device needs.
- Cache: The cache stores data and allows quick access to it. Cache speed and capacity improves device performance.
Its crucial role in the computer operation
By its components, the speed and performance of a computer are directly related to the CPU features, such as:
- Energy consumption. It refers to the amount of power that the CPU consumes when executing actions, the higher the quality, the higher the power consumption.
- The clock frequency. It refers to the clock speed that the CPU has and that determines the number of actions it can execute in a period of time.
- The number of cores. The greater the number of cores, the greater the number of actions that can be performed simultaneously.
- The number of threads. It helps the processor handle and execute actions more efficiently. It splits tasks or processes to optimize waiting times between actions.
- Cache memory. It stores data and allows quick access to it.
- The type of bus. It refers to the communication that the CPU establishes with the rest of the system.
Relationship between CPU speed/power and computer performance
Impact of speed and power on system effectiveness.
CPUs are classified by the number of cores:
- De un solo núcleo, en el que el procesador sólo puede realizar una acción a la vez, es el procesador más antiguo.
- Two-core, which allows you to perform more than one action at a time.
- Four cores, separate from each other, which allows them to perform several actions at once and are much more efficient.
Considering this, we understand why current CPUs have two or more cores to be able to perform several operations at the same time or balance the load so that the processor does not become 100% busy, which would prevent performing some operations.
Consequences of a slow or overloaded CPU
When a CPU is overloaded, the consequences are as follows, and in the indicated order:
- Loss of performance, encouraging task processing.
- Overheating of the computer, a sign that the components receive more demand than the capacity they have.
- If the temperature of a processor exceeds its limit, it slows down and can even lead to a total system shutdown.
With this, if you do not want to reach the last consequence that puts your equipment at risk, the CPU load must be optimized.
Importance of Reducing CPU Usage
Benefits of optimizing CPU load
When CPU consumption is minimized, the benefits become noticeable in:
- Energy savings: Lower power consumption, avoiding unnecessary use of processor resources.
- Battery life: It extends battery life by reducing power consumption.
- Higher performance: Performance improvements at all times.
- Lower processor overheating and exhaustion.
- Lower environmental impact: With lower energy consumption, the carbon footprint of the organization is reduced and it is possible to contribute to ESG goals (Environment, Social, Governance).
Monitoring CPU usage in IT environments
Role of IT support service agents
To give continuity to the business, it is always necessary to supervise systems and equipment to ensure service delivery without interruptions or events that may put the company at risk. IT support agents precisely provide face-to-face or remote support at:
- Install and configure equipment, operating systems, programs and applications.
- Regularly maintain equipment and systems.
- Support employees on technology use or needs.
- Detect risks and problems in equipment and systems, and take action to prevent or correct them.
- Perform diagnostics on hardware and software operation.
- Replace parts or the whole equipment when necessary.
- Make and analyze reports on the state of equipment and systems.
- Order parts and spare parts, and, if possible, schedule inventories.
- Provide guidance on the execution of new equipment, applications or operating systems.
- Test and evaluate systems and equipment prior to implementation.
- Configure profiles and access to networks and equipment.
- Carry out security checks on all equipment and systems.
Remote monitoring and management (RMM) tools for effective monitoring.
In order to carry out the functions of the technical support service agent, there are tools for remote monitoring and management. Remote Monitoring and Management (RMM) is software that helps run and automate IT tasks such as updates and patch management, device health checks, and network monitoring. The approach of RMM, of great support for internal IT teams as well as for Managed Service Providers (MSPs), is to centralize the support management process remotely, from tracking devices, knowing their status, to performing routine maintenance and solving problems that arise in equipment and systems. This becomes valuable considering that IT services and resources are in hybrid environments, especially to support the demand of users who not only work in the office but those who are working remotely. Tracking or maintaining resources manually is literally impossible.
To learn more about RMM, visit this Pandora FMS blog: What is RMM software?
Tips for reducing CPU usage on Chromebooks and Windows
Closing tabs or unnecessary applications
This is one of the easiest methods to reduce CPU usage. Close any tabs or apps you’re not using in your web browser. This frees up resources on your computer, allowing you to perform other tasks.
To open the Task Manager on a Chromebook, press “Ctrl” + “Shift” + “T”.
Right-click on the Windows taskbar and select “Task Manager”.
In Task Manager, close any tabs or apps you’re no longer using.
Disabling non-essential animations or effects
Some animations and effects can take up large CPU resources, so it’s best to disable them. First go to system settings and look for an option called “Performance” or “Graphics”, from which you may turn off animations and effects.
On Chromebook, go to Settings > Advanced > Performance and turn off any unnecessary animation or effects.
In Windows, go to Dashboards > System & Security > Performance and turn off unnecessary animations or effects.
Driver update
Outdated drivers can degrade computer performance, leading to excessive CPU usage. To update your drivers, visit your computer manufacturer’s website and download the latest drivers for your hardware. Install and then restart your computer.
Hard drive defragmentation
Over time, the hard drive can fragment, affecting computer performance. Open the “Disk Defragmenter” tool from the Start menu to defragment it. Select “Disk Defragmenter” from the Start menu. Restart the computer after defragmenting the hard drive.
Malware scanning
Malware is malicious software that aims to cause damage to systems and computers. Sometimes malware can take up CPU resources, so it’s key to scan your computer and perform a scan on a regular basis to find malware. For that, use a trusted antivirus program. Once the scan is complete, remove any malware that may have been detected.
System restoration
If you are experiencing high CPU usage, you may try performing a system restore. It can be a drastic solution, but it will return the computer to a previous state where it worked normally. To do this, open the Start menu and search for “System Restore”.
Click the “Start” button and type “System Restore”.
Choose a restore point that was created before you started experiencing problems with high CPU usage. Restart the computer.
Software update
Outdated software also causes performance issues on your computer, including high CPU usage. To update the software, open the Control Panel and go to the “Windows Update” settings, check for updates and install those that are available.
In addition to these tips, it is recommended to use RMM tools and agents installed on the company’s computers, servers, workstations and devices, which run in the background in order to collect information on network activity, performance and system security in real time. Through its analysis, it is possible to detect patterns and anomalies to generate support tickets (and scale them if necessary according to their severity) or, ideally, act preventively.
Proactive monitoring by internal IT teams or MSP providers is also recommended to ensure a stable and safe IT environment for users. Importantly, proactivity reduces the costs associated with equipment repair and data recovery.
Advanced Optimization: Overclocking and CPU Switching
Explanation of advanced options such as overclocking
overclocking is a technique used to increase clock frequency of an electronic component, such as the CPU (processor) or the GPU (graphics card), beyond the specifications set by the equipment manufacturer. That is, overlocking tries to force the component to operate at a higher speed than it originally offers.
Considerations on installing a new CPU
While it may seem like a simple matter to install a new CPU, there are considerations for installing a new CPU to ensure your computer’s performance. It is recommended to have the following at hand:
- A screwdriver: Depending on your PC and the content that is installed on it, you may need one or more screwdrivers to remove the screws from your CPU and even the motherboard, in case you need to remove it.
- Thermal paste: This is a must when installing a new CPU, especially if you do not have a CPU cooler with pre-applied thermal paste.
- Isopropyl alcohol wipes: You will need them to clean the residual thermal paste of the processor and the contact point of the CPU cooler. You may even use isopropyl alcohol along with some very absorbent paper towels.
- Antistatic Wristband: Since fragile and expensive components such as the CPU, motherboard and cooler will be worked on, we suggest using an antistatic wristband to protect the components from static discharges.
With this at hand, we now let you know three important considerations:
- Take static precautions:
The CPU is sensitive to static discharges. Its pins are delicate and work at high temperatures, so you have to take precautions. It is recommended to wear an antistatic bracelet or take a metal surface to “unload” yourself. In case the CPU has been used in another machine or if the fan is being replaced, you may need to remove the old thermal compound with isopropyl alcohol (not on the CPU contacts). There is no need to remove the battery from the motherboard during CPU installation. This would cause saved BIOS configurations to be lost. A minimum force must be required to lock the CPU charging lever in place.
- Motherboard compatibility:
It is important to check the documentation of your motherboard to know the type of socket that is used. Remember that AMD and Intel use different sockets, so you can’t install an Intel processor on an AMD board (and vice versa). If you can’t find this information, you may use the CPU-Z program to determine the type of socket to use.
- Correct location and alignment:
The CPU must be properly placed in the socket. If you do not do it correctly, the CPU will not work. You should make sure to properly install the fan and heat sink to avoid temperature problems.
In a nutshell…
The demand for resources on our computers to be able to process multiple tasks simultaneously has made it clear why attention should be paid to using the CPU with speed and power. For that reason, remote supervision and management tools are a resource for IT employees (or Managed Service Provider) in order to be able to know from a central point the status of systems and equipment and undertake maintenance and prevention actions remotely, such as driver updates, malware scanning, software updates, among others. The results of these efforts will be energy savings, increased performance, and extended battery life, along with reduced processor overheating and reduced environmental impact.

by Pandora FMS team | Last updated Mar 7, 2024 | Pandora FMS
Collectd is a daemon (i.e. running in the background on computers and devices) that periodically collects metrics from different sources such as operating systems, applications, log files, and external devices, providing mechanisms to store values in different ways (e.g. RRD files) or makes it available over the network. With this data and its statistics you may monitor systems, find performance bottlenecks (by performance analysis) and predict system load (capacity planning).
Programming language and compatibility with operating systems
Collectd is written in C for *nix operating systems; that is, UNIX-based, such as BSD, macOS and Linux, for portability and performance, since its design allows it to run on systems without scripting language or cron daemon, as integrated systems. For Windows it can be connected using Cygwin (GNU and open source tools that provide similar features to a Linux distribution on Windows).
Collectd is optimized to take up the least amount of system resources, making it a great tool for monitoring with a low cost of performance.
Plug-ins of collectd
Collectd as a modular demon
The collectd system is modular. In its core it has limited features and to use it, you need to know how to compile a program in C. You also need to know how to start the executable in the right way so that the data is sent to where it is needed. However, through plug-ins, value is obtained from the data collected and sent, extending its functionality for multiple use cases. This makes the daemon modular and flexible and the statistics obtained (and their format) can be defined by plug-ins.
Plug-in types
Currently, there are 171 plug-ins available for collectd. Not all plug-ins define data collection themes, as some extend capabilities with interfaces for specific technologies (e.g. programming languages such as Python).
- Read plug-ins fetch data and are generally classified into three categories:
- Operating system plug-ins, which collect information such as CPU usage, memory, or the number of users who logged into a system. Usually, these plug-ins need to be ported to each operating system.
- Application plug-ins, which collect performance data about an application running on the same computer or at a remote site. These plug-ins normally use software libraries, but are otherwise usually independent of the operating system.
- Generic plug-ins, which offer basic functions that users may make use for specific tasks. Some examples are the query for network monitoring (from SNMP) or the execution of custom programs or scripts.
- Writing plug-ins offer the ability to store collected data on disk using RRD or CSV files; or send data over the network to a remote daemon instance.
- Unixsock plugins allow you to open a socket to connect to the collectd daemon. Thanks to the collectd utility, you may directly obtain the monitors in your terminal with the getval or listval parameters, where you may indicate the specific parameter you wish to obtain or obtain a list with all the parameters that collectd has collected.
- You also have the network plug-in, which is used to send and receive data to and from other daemon instances. In a common network configuration, the daemon would run on each monitored host (called “clients”) with the network plug-in configured to send the collected data to one or more network addresses. On one or more of the so-called “servers”, the same daemon would run, but with a different configuration, so that the network plug-in receives data instead of sending it. Often, the RRDtool plugin is used in servers to store performance data (e.g. bandwidth, temperature, CPU workload, etc.)
To activate and deactivate the plug-ins you have, you may do so from the configuration file “collectd.conf”, in addition to configuring them or adding custom plugins.
Benefits of Collectd
- Open source nature
Collectd is open source software, just like its plug-ins, though some plug-ins don’t have the same open source license.
- Extensibility and modularity
Collectd has 171 plug-ins, supports a variety of operating systems, and is very easy to set up. It also allows customization according to the needs of the company and its features can be easily extended by adding some reliable plug-ins, in addition to being able to be written in several languages such as Perl and Python.
- Scalability
Collectd collects data from many sources and sends it to a multicast group or server. Whether they are one or a thousand hosts, collectd can collect statistics and performance metrics. Collectd also allows you to merge multiple updates into a single operation or large values into a single network packet.
- SNMP support
Collectd supports Simple Network Management Protocol (SNMP), which allows users to collect metrics from a wide range of network resources and devices.
- Flexibility
It provides flexibility and the opportunity to decide what statistics you want to collect and how often.
Collectd Integration with Pandora FMS
Monitoring IT environments
Collectd provides statistics to an interpretation package, so in a third-party tool, it must be configured to generate graphs and analysis from the data obtained, in order to see and optimize IT environment monitoring. Collectd has a large community that contributes improvements, new plugins, and bug fixes.
Effective execution in Pandora FMS
The pandora_collectd plugin allows to collect this information generated by collectd itself and send it to your Pandora FMS server for further processing and storage.
The plugin execution generates an agent with all the information of collectd transformed in Pandora FMS modules; with this, you may have any device monitored with collectd and obtain a data history, create reports, dashboards, visual consoles, trigger alerts and a long etcetera.
A very important feature of “pandora_collectd” is that it is a very versatile plugin, as it allows you to process data collected from collectd before sending it to your Pandora FMS server. By means of regular expressions, it allows you to decide according to the features you have, which metrics you want to collect and which ones you want to download, to send the desired metrics to your Pandora FMS server, in an optimal way. In addition, it allows you to modify parameters such as the port or the IP address of the tentacle server that you wish to use.
Also, it is possible to customize what we want your agent to be called, where the modules will be created, and modify their description.
Another important aspect of this plug-in is that it can run both as an agent plug-in and as a server plug-in. By being able to modify the agents resulting from the monitoring, you may easily differentiate one from the other and monitor a high amount of devices in your Pandora FMS environment.
In addition, your plugin is compatible with the vast majority of Linux and Unix devices so there will be no problems with its implementation with collectd.
To learn how to set up collectd in Pandora FMS, visit Pandora FMS Guides for details.
Collectd vs StatsD: A Comparison
Key differences
As we have seen, collectd is suitable for monitoring CPU, network, memory usage and different plugins for specific services such as NGinx. Due to its features, it collects ready-to-use metrics and must be installed on machines that need monitoring.
Whereas StatsD (written in Node.js) is generally used for applications that require accurate data aggregation and sends data to servers at regular intervals. Also, StatsD provides libraries in multiple programming languages for easy data tracking.
Once this is understood, collectd is a statistics gathering daemon, while StatsD is an aggregation service or event counter. The reason for explaining their differences is that collectd and StatsD can be used together (and it is common practice) depending on the monitoring needs in the organization.
Use cases and approaches
- Cases of StatsD use:
- Monitoring Web Applications: Tracking the number of requests, errors, response times, etc.
- Performance Analysis: Identification of bottlenecks and optimization of application performance.
- Cases of use of collectd:
- Monitoring hardware resources such as CPU usage, memory used, hard disk usage, etc.
- Monitoring specific metrics of available IT services.
The Importance of Collectd Integration with Pandora FMS
-
- Lightweight and efficient
Collectd in Pandora FMS is lightweight and efficient, with the ability to write metrics across the network, by itself a modular architecture and because it runs mainly in memory.
- Versatility and flexibility
This plugin allows you to decide which metrics you want to collect and which to discard in order to send only the metrics you want to your Pandora FMS server. It also allows you to adjust the data collected from time to time, according to the needs of the organization.
- Community support and continuous improvement
In addition to the fact that collectd is a popular plugin, there is community support for those who constantly make improvements, including specialized documentation and installation guides.
All this makes us understand why collectd has been widely adopted for monitoring IT resources and services.
Conclusion
Collectd is a very popular daemon for measuring metrics from different sources such as operating systems, applications, log files and external devices, being able to take advantage of the information for system monitoring. Among its key features we can mention that, being written in C, in open source, it can be executed on systems without the need for a scripting language. As it is modular, it is quite portable through plug-ins and the value of the collected and sent data is obtained, the collectd feature is extended to give a better use in monitoring IT resources. It is also scalable, whether one or a thousand hosts, to collect statistics and performance metrics. This is of great value in IT ecosystems that continue growing for any company in any industry.
The pandora_collectd plugin collects information generated by the collectd itself and sends it to Pandora FMS server from which you may enhance the monitoring of any monitored device and obtain data from which to generate reports or performance dashboards, schedule alerts and obtain history information for capacity planning, among other high-value functions in IT management.
For better use of collectd, with the ability to be so granular in data collection, it is also good to consolidate statistics to make them more understandable to the human eye and simplify things for the system administrator who analyzes the data. Also, it is recommended to rely on IT monitoring experts such as Pandora FMS, with best monitoring and observability practices. Contact our experts in Professional services | Pandora FMS

by Ahinóam Rodríguez | Last updated Feb 23, 2024 | Pandora FMS
Until recently, the default model for application development was SQL. However, in recent years NoSQL has become a popular alternative.
The wide variety of data that is stored today and the workload that servers must support force developers to consider other more flexible and scalable options. NoSQL databases provide agile development and ease of adapting to changes. Even so, they cannot be considered as a replacement for SQL nor are they the most successful choice for all types of projects.
Choosing between NoSQL vs SQL is an important decision, if you wish to avoid technical difficulties during the development of an application. In this article we aim to explore the differences between these two database management systems and guide readers on the use of each of them, taking into account the needs of the project and the type of data to be handled.
What is NoSQL?
The term NoSQL is short for “Not only SQL” and refers to a category of DBMSs that do not use SQL as their primary query language.
The NoSQL database boom began in 2000, matching the arrival of web 2.0. From then on, applications became more interactive and began to handle large volumes of data, often unstructured. Soon traditional databases fell short in terms of performance and scalability.
Big tech companies at the time decided to look for solutions to address their specific needs. Google was the first to launch a distributed and highly scalable DBMS: BigTable, in 2005. Two years later, Amazon announced the release of Dynamo DB (2007). These databases (and others that were appearing) did not use tables or a structured language, so they were much faster in data processing.
Currently, the NoSQL approach has become very popular due to the rise of Big Data and IoT devices, that generate huge amounts of data, both structured and unstructured.
Thanks to its performance and ability to handle different types of data, NoSQL managed to overcome many limitations present in the relational model. Netflix, Meta, Amazon or LinkedIn are examples of modern applications that use NoSQL database to manage structured information (transactions and payments) as well as unstructured information (comments, content recommendations and user profiles).
Difference between NoSQL and SQL
NoSQL and SQL are two database management systems (DBMS) that differ in the way they store, access and modify information.
The SQL system
SQL follows the relational model, formulated by E.F. Codd in 1970. This English scientist proposed replacing the hierarchical system used by the programmers of the time with a model in which data are stored in tables and related to each other through a common attribute known as “primary key”. Based on their ideas, IBM created SQL (Structured Query Language), the first language designed specifically for relational databases. The company tried unsuccessfully to develop its own RDBMS, so it had to wait until 1979, the year of the release of Oracle DB.
Relational databases turned out to be much more flexible than hierarchical systems and solved the issue of redundancy, following a process known as “normalization” that allows developers to expand or modify databases without having to change their whole structure. For example, an important function in SQL is JOIN, which allows developers to perform complex queries and combine data from different tables for analysis.
The NoSQL system
NoSQL databases are even more flexible than relational databases since they do not have a fixed structure. Instead, they employ a wide variety of models optimized for the specific requirements of the data they store: spreadsheets, text documents, emails, social media posts, etc.
Some data models that NoSQL uses are:
- Key-value: Redis, Amazon DynamoDB, Riak. They organize data into key and value pairs. They are very fast and scalable.
- Documentaries: MongoDB, Couchbase, CouchDB. They organize data into documents, usually in JSON format.
- Graph-oriented: Amazon Neptune, InfiniteGraph. They use graph structures to perform semantic queries and represent data such as nodes, edges, and properties.
- Column-oriented: Apache Cassandra. They are designed to store data in columns instead of rows as in SQL. Columns are arranged contiguously to improve read speed and allow efficient retrieval of the data subset.
- Databases in memory: They get rid of the need to access disks. They are used in applications that require microsecond response times or that have high traffic spikes.
In summary, to work with SQL databases, developers must first declare the structure and types of data they will use. In contrast, NoSQL is an open storage model that allows new types of data to be incorporated without this implying project restructuring.
Relational vs. non-relational database
To choose between an SQL or NoSQL database management system, you must carefully study the advantages and disadvantages of each of them.
Advantages of relational databases
- Data integrity: SQL databases apply a wide variety of restrictions in order to ensure that the information stored is accurate, complete and reliable at all times.
- Ability to perform complex queries: SQL offers programmers a variety of functions that allow them to perform complex queries involving multiple conditions or subqueries.
- Support: RDBMS have been around for decades; they have been extensively tested and have detailed and comprehensive documentation describing their functions.
Disadvantages of relational databases
- Difficulty handling unstructured data: SQL databases have been designed to store structured data in a relational table. This means they may have difficulties handling unstructured or semi-structured data such as JSON or XML documents.
- Limited performance: They are not optimized for complex and fast queries on large datasets. This can result in long response times and latency periods.
- Major investment: Working with SQL means taking on the cost of licenses. In addition, relational databases scale vertically, which implies that as a project grows, it is necessary to invest in more powerful servers with more RAM to increase the workload.
Advantages of non-relational databases
- Flexibility: NoSQL databases allow you to store and manage structured, semi-structured and unstructured data. Developers can change the data model in an agile way or work with different schemas according to the needs of the project.
- High performance: They are optimized to perform fast queries and work with large volumes of data in contexts where relational databases find limitations. A widely used programming paradigm in NoSQL databases such as MongoDB is “MapReduce” which allows developers to process huge amounts of data in batches, breaking them up into smaller chunks on different nodes in the cluster for later analysis.
- Availability: NoSQL uses a distributed architecture. The information is replicated on different remote or local servers to ensure that it will always be available.
- They avoid bottlenecks: In relational databases, each statement needs to be analyzed and optimized before being executed. If there are many requests at once, a bottleneck may take place, limiting the system’s ability to continue processing new requests. Instead, NoSQL databases distribute the workload across multiple nodes in the cluster. As there is no single point of entry for enquiries, the potential for bottlenecks is very low.
- Higher profitability: NoSQL offers fast and horizontal scalability thanks to its distributed architecture. Instead of investing in expensive servers, more nodes are added to the cluster to expand data processing capacity. In addition, many NoSQL databases are open source, which saves on licensing costs.
Disadvantages of NoSQL databases
- Restriction on complex queries: NoSQL databases lack a standard query language and may experience difficulties performing complex queries or require combining multiple datasets.
- Less coherence: NoSQL relaxes some of the consistency constraints of relational databases for greater performance and scalability.
- Less resources and documentation: Although NoSQL is constantly growing, the documentation available is little compared to that of relational databases that have been in operation for more years.
- Complex maintenance: Some NoSQL systems may require complex maintenance due to their distributed architecture and variety of configurations. This involves optimizing data distribution, load balancing, or troubleshooting network issues.
When to use SQL databases and when to use NoSQL?
The decision to use a relational or non-relational database will depend on the context. First, study the technical requirements of the application such as the amount and type of data to be used.
In general, it is recommended to use SQL databases in the following cases:
- If you are going to work with well-defined data structures, for example, a CRM or an inventory management system.
- If you are developing business applications, where data integrity is the most important: accounting programs, banking systems, etc.
In contrast, NoSQL is the most interesting option in these situations:
- If you are going to work with unstructured or semi-structured data such as JSON or XML documents.
- If you need to create applications that process data in real time and require low latency, for example, online games.
- When you want to store, manage and analyze large volumes of data in Big Data environments. In these cases, NoSQL databases offer horizontal scalability and the possibility of distributing the workload on multiple servers.
- When you launch a prototype of a NoSQL application, it provides you with fast and agile development.
In most cases, back-end developers decide to use a relational database, unless it is not feasible because the application handles a large amount of denormalized data or has very high performance needs.
In some cases it is possible to adopt a hybrid approach and use both types of databases.
SQL vs NoSQL Comparison
CTO Mark Smallcombe published an article titled “SQL vs NoSQL: 5 Critical Differences” where he details the differences between these two DBMS.
Below is a summary of the essentials of your article, along with other important considerations in comparing SQL vs NoSQL.
How data is stored
In relational databases, data are organized into a set of formally described tables and are related to each other through common identifiers that provide access, consultation and modification.
NoSQL databases store data in its original format. They do not have a predefined structure and can use documents, columns, graphs or a key-value schema.
Language
Relational databases use the SQL structured query language.
Non-relational databases have their own query languages and APIs. For example, MongoDB uses MongoDB Query Language (MQL) which is similar to JSON and Cassandra uses Cassandra Query Language (CQL) which looks like SQL, but is optimized for working with data in columns.
Compliance with ACID properties
Relational databases follow the ACID guidelines (atomicity, consistency, isolation, durability) that guarantee the integrity and validity of the data, even if unexpected errors occur. Adopting the ACID approach is a priority in applications that handle critical data, but it comes at a cost in terms of performance, since data must be written to disk before it is accessible.
NoSQL databases opt instead for the BASE model (basic availability, soft state, eventual consistency), which prioritizes performance over data integrity. A key concept is that of “eventual consistency”. Instead of waiting for the data to be written to disk, some degree of temporal inconsistency is tolerated, assuming that, although there may be a delay in change propagation, once the write operation is finished, all the nodes will have the same version of the data. This approach ensures faster data processing and is ideal in applications where performance is more important than consistency.
Vertical or horizontal scalability
Relational databases scale vertically by increasing server power.
Non-relational databases have a distributed architecture and scale horizontally by adding servers to the cluster. This feature makes NoSQL a more sustainable option for developing applications that handle a large volume of data.
Flexibility and adaptability to change
SQL databases follow strict programming schemes and require detailed planning as subsequent changes are often difficult to implement.
NoSQL databases provide a more flexible development model, allowing easy adaptation to changes without having to perform complex migrations. They are a practical option in agile environments where requirements change frequently.
Role of Pandora FMS in database management
Pandora FMS provides IT teams with advanced capabilities to monitor SQL and NoSQL databases, including MySQL, PostgreSQL, Oracle, and MongoDB, among others. In addition, it supports virtualization and cloud computing environments (e.g., Azure) to effectively manage cloud services and applications.
Some practical examples of the use of Pandora FMS in SQL and NoSQL databases:
- Optimize data distribution in NoSQL: It monitors performance and workload on cluster nodes avoiding overloads on individual nodes.
- Ensure data availability: It replicates the information in different nodes thus minimizing the risk of losses.
- Send Performance Alerts: It monitors server resources and sends alerts to administrators when it detects query errors or slow response times. This is especially useful in SQL databases whose performance depends on the power of the server where the data is stored.
- Encourage scalability: It allows you to add or remove nodes from the cluster and adjust the system requirements to the workload in applications that work with NoSQL database.
- Reduce Latency: It helps administrators identify and troubleshoot latency issues in applications that work with real-time data. For example, it allows you to adjust NoSQL database settings, such as the number of simultaneous connections or the size of the network buffer, thus improving query speed.
Conclusion
Making a correct choice of the type of database is key so that no setbacks arise during the development of a project and expand the possibilities of growth in the future.
Historically, SQL databases were the cornerstone of application programming, but the evolution of the Internet and the need to store large amounts of structured and unstructured data pushed developers to look for alternatives outside the relational model. NoSQL databases stand out for their flexibility and performance, although they are not a good alternative in environments where data integrity is paramount.
It is important to take some time to study the advantages and disadvantages of these two DBMSs. In addition, we must understand that both SQL and NoSQL databases require continuous maintenance to optimize their performance.
Pandora FMS provides administrators with the tools necessary to improve the operation of any type of database, making applications faster and more secure, which translates into a good experience for users.

by Pandora FMS team | Last updated Feb 16, 2024 | Pandora FMS
Interview with Alexander Twaradze, Pandora FMS representative in CIS countries.
See original here.
Companies’ modern IT infrastructure consists of multiple systems and services. These could be servers, network equipment, software, communication channels, and services from third-party companies. All of them interact through a wide variety of channels and protocols. Monitoring what the entire IT infrastructure works like is a difficult and time-consuming task. In case of failure, you may face negative customer reviews, lose money and reputation, waste time and lose nerve. The task is to quickly find out the location and cause of the failure. It is necessary for the monitoring system to also allow you to automate response to failures, for example, restarting the system, activating a backup communication channel, and adding resources to the virtual server. At the same time, it is necessary for such a system to support all the variety of systems and manufacturers that the company has. We talked with Alexander Tvaradze, Director of Pandora FMS representative company in the CIS countries, about how Pandora FMS software helps to solve this difficult task.
Please tell us about Pandora FMS itself.
Pandora FMS head office is located in Madrid. The company has been operating on the market for more than 15 years and currently offers three main products:
IT Infrastructure monitoring System;
Help desk, ticket system;
It is a remote server management system
The company successfully operates on the international market, and its clients include a large number of companies from the public and private sectors in Europe and the Middle East, including Viber, MCM Telecom, Telefonica and others.
What does IT infrastructure monitoring bring to the company and how important is it?
Now business is connected with IT in one way or another, so the performance of servers, services, network and workstations directly affects the business. For example, failures in processing centers may affect payments from many companies and services. Monitoring of systems and services helps to solve several problems at once:
- Monitor the parameters of equipment and services in advance, and take measures to get rid of a potential problem. For, example Pandora FMS can track the level of memory consumption and warn administrators in advance that the amount of free memory is insufficient and the service may stop.
- Quickly understand where the failure took place. For, example, the company has integration with the banking service via API. Pandora FMS can not only track that the communication channel is working and there is access to the server, but also that the banking service does not respond correctly to API commands.
- Perform actions to prevent the problem. For example, an organization has a reporting server. The peak load occurs at the end of the week, and when the server is overloaded, it causes problems for users. Pandora FMS can monitor the current server load. As soon as it exceeds a certain threshold, Pandora FMS launches a more powerful server in parallel, migrating services to it. When the peak load passes, Pandora FMS migrates back to the standard server, and disables the more powerful one.
To realize such opportunities, the system must be able to be flexible and work with several services and systems…
That’s exactly what Pandora FMS does. The system works with multiple manufacturers of network and server equipment, with both well-known and not-so-popular brands. If specific hardware appears, it is enough to upload its MIB file and specify which parameters need to be monitored. For example, our partner in Saudi Arabia is currently implementing a project with one of the large state-owned companies. They have a large “zoo” of systems from different manufacturers, including both 10-year-old devices and modern solutions.
Pandora FMS is able to monitor a wide range of software: operating systems, web servers, databases, containers, dockers, virtualization systems. Pandora FMS is also a certified solution for monitoring SAP R/3, S/3, CRM, etc., including monitoring SAP HANA databases.
The system has a high degree of flexibility. In one of the projects in the CIS, the customer needed to monitor the parameters of special satellite equipment. At the same time, the equipment did not support any standard monitoring protocols, such as SNMP, only the web interface. A script was created that collected data from a web interface page and uploaded it to an xml file. Then Pandora FMS downloaded the data from this file and displayed it to the customer in the form of graphs. The data were output to two monitoring centers located in different parts of the country. If there was a deviation from the basic values, the warning was sent to the administrators by e-mail and Telegram.
Pandora FMS can not only monitor, but also manage network device configurations, provide inventory, CMDB, script automation, monitor cloud services and web interfaces (UX monitoring), monitor IP addresses, etc.
What size of IT systems can be monitored using Pandora FMS?
Infinitely large and complex. One monitoring server can serve up to 50,000 different sensors. Multiple servers can be combined into a single system using the Enterprise Console. For customers with a complex structure, there is the possibility of distributed monitoring using Satellite servers. For example, such servers can be located in branches and transmit information to the central Pandora FMS server with one connection. This solution is fault-tolerant due to the fact that it is possible to install a backup Pandora FMS server. Unlike competitors, this feature is free. The multi-tenancy mode is also supported. For example, one Pandora FMS server can independently serve various departments or companies within a holding company.
How difficult is it to install and deploy the system?
The system is installed on a Linux platform. All major distributions are supported: RedHat, Suse and Rocket. MySQL is used as the database. Pandora FMS is deployed automatically by a script within some 15 minutes and users do not need in-depth knowledge of Linux. At the request of customers, you may provide ready-made images. Network equipment can be connected via automatic network scanning, data import via files, or manually. Servers are monitored through SNMP, WMI and/or agents, which can be installed automatically or manually.
What is the difference between Pandora FMS licensing models?
The company offers permanent licenses, which is convenient, in particular, for government organizations. This ensures that the monitoring system will never stop. It is licensed by the number of hosts, in increments of 100. For example, if you have 100 servers and 200 pieces of network equipment, then you need 300 licenses. They include all the modules of the system and access to over 400 plugins. The host can be both a server and network equipment. In the future, when purchasing additional licenses, customers can buy blocks of 50 hosts each. The difference in price compared to competitors’ solutions sometimes reaches 200-300%. Due to the fact that Pandora FMS runs on Linux platforms, you do not need to spend money for Windows and MS SQL server licenses.
For more information, please contact Advanced Technologies Solutions, which is the representative of Pandora FMS in the CIS countries. Pandora FMS can be purchased through partners in Azerbaijan and distributor Mont Azerbaijan.

by Pandora FMS team | Last updated Feb 16, 2024 | Pandora FMS
Pandora FMS stands out as a powerful monitoring software solution that helps individuals and organizations of all sizes. It facilitates effective monitoring of the performance and status of servers, applications, network devices and other essential components of the IT infrastructure.
You already know Pandora FMS and the G2 platform well, so we would like to make you a proposal to take advantage of your vast knowledge:
Give your opinion about Pandora FMS in G2 and help others
Pandora FMS with a wide range of features such as network mapping, event correlation and reporting, is an excellent choice for companies looking to enhance their capabilities. And G2 is a platform for user feedback on software solutions that allows users to share their experiences and views on various products, helping others to make informed decisions about technology solutions. That is why we have joined forces to benefit you and all the users who will know first hand, thanks to your review, all the advantages that Pandora FMS can bring to their lives.
We strive to improve Pandora FMS software, so your feedback can help us a lot to understand what works well and where we can improve. We know that your time is precious so, as a thank you, G2 offers you a 25$ gift card. We want to position well and we need your help to achieve it!
What are the steps to leave a review on Pandora FMS in G2?
- Access to the Platform through this link and make sure you have an account. You may need to register if you have not already done so.
- Leave your opinion: Provide the required information, such as a score and your comment.
- Includes Relevant Details: Be specific in your opinion. Share details about your experience with Pandora FMS, both positive and negative aspects. This will help other users to get a more complete view.
- Confirm and Send: Review your review to make sure it is complete and accurate. Then confirm and submit your review.
Hurry up, take a few minutes in G2 and receive your reward. They run out!*
Your feedback is crucial for us. Participate and benefit!
*Valid for the first 50 approved reviews.

by Olivia Díaz | Last updated May 9, 2024 | Pandora FMS
Distributed systems allow projects to be implemented more efficiently and at a lower cost, but require complex processing due to the fact that several nodes are used to process one or more tasks with greater performance in different network sites. To understand this complexity, let’s first look at its fundamentals.
The Fundamentals of Distributed Systems
What are distributed systems?
A distributed system is a computing environment that spans multiple devices, coordinating their efforts to complete a job much more efficiently than if it were with a single device. This offers many advantages over traditional computing environments, such as greater scalability, reliability improvements, and lower risk by avoiding a single point vulnerable to failure or cyberattack.
In modern architecture, distributed systems become more relevant by being able to distribute the workload among several computers, servers, devices in Edge Computing, etc. (nodes), so that tasks are executed reliably and faster, especially nowadays when continuous availability, speed and high performance are demanded by users and infrastructures extend beyond the organization (not only in other geographies, but also in the Internet of Things, Edge Computing, etc.).
Types and Example of Distributed Systems:
There are several models and architectures of distributed systems:
- Client-server systems: are the most traditional and simple type of distributed system, in which several networked computers interact with a central server to store data, process it or perform any other common purpose.
- Mobile networks: They are an advanced type of distributed system that share workloads between terminals, switching systems, and Internet-based devices.
- Peer-to-peer networks: They distribute workloads among hundreds or thousands of computers running the same software.
- Cloud-based virtual server instances: They are the most common forms of distributed systems in enterprises today, as they transfer workloads to dozens of cloud-based virtual server instances that are created as needed and terminated when the task is completed.
Examples of distributed systems can be seen in a computer network within the same organization, on-premises or cloud storage systems and database systems distributed in a business consortium. Also, several systems can interact with each other, not only from the organization but with other companies, as we can see in the following example:
From home, one can buy a product (customer at home) and it triggers the process with the distributor’s server and this in turn with the supplier’s server to supply the product, also connecting to the bank’s network to carry out the financial transaction (connecting to the bank’s regional mainframe, then connecting to the bank’s mainframe). Or, in-store, customers pay at the supermarket checkout terminal, which in turn connects to the business server and bank network to record and confirm the financial transaction. As it can be seen, there are several nodes (terminals, computers, devices, etc.) that connect and interact. To understand how tuning is possible in distributed systems, let’s look at how nodes collaborate with each other.
Collaboration between Nodes: The Symphony of Distribution
- How nodes interact in distributed systems: Distributed systems use specific software to be able to communicate and share resources between different machines or devices, in addition to orchestrating activities or tasks. To do this, protocols and algorithms are used to coordinate actions and data exchange. Following the example above, the computer or the store cashier is the customer from which a service is requested from a server (business server), which in turn requests the service from the bank’s network, which carries out the task of recording the payment and returns the results to the customer (the store cashier) that the payment has been successful.
- The most common challenges are being able to coordinate tasks of interconnected nodes, ensuring consistency of data being exchanged between nodes, and managing the security and privacy of nodes and data traveling in a distributed environment.
- To maintain consistency across distributed systems, asynchronous communication or messaging services, distributed file systems for shared storage, and node and/or cluster management platforms are required to manage resources.
Designing for Scalability: Key Principles
- The importance of scalability in distributed environments: Scalability is the ability to grow as the workload size increases, which is achieved by adding additional processing units or nodes to the network as needed.
- Design Principles to Encourage Scalability: scalability has become vital to support increased user demand for agility and efficiency, in addition to the growing volume of data. Architectural design, hardware and software upgrades should be combined to ensure performance and reliability, based on:
- Horizontal scalability: adding more nodes (servers) to the existing resource pool, allowing the system to handle higher workloads by distributing the load across multiple servers.
- Load balancing: to achieve technical scalability, incoming requests are distributed evenly across multiple servers, so that no server is overwhelmed.
- Automated scaling: using algorithms and tools to dynamically and automatically adjust resources based on demand. This helps maintain performance during peak traffic and reduce costs during periods of low demand. Cloud platforms usually offer auto-scaling features.
- Caching: by storing frequently accessed data or results of previous responses, improving responsiveness and reducing network latency rather than making repeated requests to the database.
- Geographic scalability: adding new nodes in a physical space without affecting communication time between nodes, ensuring distributed systems can handle global traffic efficiently.
- Administrative scalability: managing new nodes added to the system, minimizing administrative overload.
Distributed tracking is a method for monitoring applications built on a microservices architecture that are routinely deployed in distributed systems. Tracking monitors the process step by step, helping developers discover bugs, bottlenecks, latency, or other issues with the application. The importance of monitoring on distributed systems lies in the fact that multiple applications and processes can be tracked simultaneously across multiple concurrent computing nodes and environments, which have become commonplace in today’s system architectures (on-premises, in the cloud, or hybrid environments), which also demand stability and reliability in their services.
The Crucial Role of Stability Monitoring
To optimize IT system administration and achieve efficiency in IT service delivery, appropriate system monitoring is indispensable, since data in monitoring systems and logs allow detecting possible problems as well as analyzing incidents to not only react but be more proactive.
Essential Tools and Best Practices
An essential tool is a monitoring system focused on processes, memory, storage and network connections, with the objectives of:
- Making the most of a company’s hardware resources.
- Reporting potential issues.
- Preventing incidents and detecting problems.
- Reducing costs and system implementation times.
- Improving user experience and customer service satisfaction.
In addition to the monitoring system, best practices should be implemented which covers an incident resolution protocol, which will make a big difference when solving problems or simply reacting, based on:
- Prediction and prevention. The right monitoring tools not only enable timely action but also analysis to prevent issues impacting IT services.
- Customize alerts and reports that are really needed and that allow you the best status and performance display of the network and equipment.
- Rely on automation, taking advantage of tools that have some predefined rules.
- Document changes (and their follow-up) in system monitoring tools, which make their interpretation and audit easier (who made changes and when).
Finally, it is recommended to choose the right tool according to the IT environment and expertise of the organization, critical business processes and their geographical dispersion.
Business Resilience: Proactive Monitoring
Real-time access to find out the state of critical IT systems and assets for the company allows detecting the source of incidents. However, resilience through proactive monitoring is achieved from action protocols to effectively solve problems when it is clear what and how to do, in addition to having data to take proactive actions and alerts against hard disk filling, limits on memory use and possible vulnerabilities to disk access, etc., before they become a possible problem, also saving costs and time for IT staff to solve issues. Let’s look at some case studies that highlight quick problem solving.
- Cajasol case: We needed a system that had a very large production plant available, in which different architectures and applications coexisted, which it is necessary to have controlled and be transparent and proactive.
- Fripozo case: It was necessary to know in time of failures and correct them as soon as possible, as this resulted in worse system department service to the rest of the company.
Optimizing Performance: Effective Monitoring Strategies
Permanent system monitoring allows to manage the challenges in their performance, since it allows to identify the problems before they become a suspension or the total failure that prevents business continuity, based on:
- Collecting data on system performance and health.
- Metric display to detect anomalies and performance patterns of computers, networks and applications.
- Generation of custom alerts, which allow action to be taken in a timely manner.
- Integration with other management and automation platforms and tools.
Monitoring with Pandora FMS in Distributed Environments
Monitoring with agents
Agent monitoring is one of the most effective ways to get detailed information about distributed systems. Lightweight software is installed on operating systems that continuously collects data from the system on which it is installed. Pandora FMS uses agents to access deeper information than network checks, allowing applications and services to be monitored “from the inside” on a server. Information commonly collected through agent monitoring includes:
- CPU and memory usage.
- Disk capacity.
- Running processes.
- Active services.
Internal application monitoring
Remote Checks with Agents – Broker Mode
In scenarios where a remote machine needs to be monitored and cannot be reached directly from Pandora FMS central server, the broker mode of agents installed on local systems is used. The broker agent runs remote checks on external systems and sends the information to the central server, acting as an intermediary.
Remote Network Monitoring with Agent Proxy – Proxy Mode
When you wish to monitor an entire subnet and Pandora FMS central server cannot reach it directly, the proxy mode is used. This mode allows agents on remote systems to forward their XML data to a proxy agent, which then transmits it to the central server. It is useful when only one machine can communicate with the central server.
Multi-Server Distributed Monitoring
In situations where a large number of devices need to be monitored and a single server is not enough, multiple Pandora FMS servers can be installed. All these servers are connected to the same database, making it possible to distribute the load and handle different subnets independently.
Delegate Distributed Monitoring – Export Server
When providing monitoring services to multiple clients, each with their own independent Pandora FMS installation, the Export Server feature can be used. This export server allows you to have a consolidated view of the monitoring of all customers from a central Pandora FMS installation, with the ability to set custom alerts and thresholds.
Remote Network Monitoring with Local and Network Checks – Satellite Server
When an external DMZ network needs to be monitored and both remote checks and agent monitoring are required, the Satellite Server is used. This Satellite server is installed in the DMZ and performs remote checks, receives data from agents and forwards it to Pandora FMS central server. It is particularly useful when the central server cannot open direct connections to the internal network database.
Secure Isolated Network Monitoring – Sync Server
In environments where security prevents opening communications from certain locations, such as datacenters in different countries, the Sync Server can be used. This component, added in version 7 “Next Generation” of Pandora FMS, allows the central server to initiate communications to isolated environments, where a Satellite server and several agents are installed for monitoring.
Distributed monitoring with Pandora FMS offers flexible and efficient solutions to adapt to different network topologies in distributed environments.
Conclusion
Undertaking best practices for deploying distributed systems are critical to building organizations’ resilience in IT infrastructures and services that are more complex to manage, requiring adaptation and proactivity to organizations’ needs for performance, scalability, security, and cost optimization. IT strategists must rely on more robust, informed and reliable systems monitoring, especially when in organizations today and into the future, systems will be increasingly decentralized (no longer all in one or several data centers but also in different clouds) and extending beyond their walls, with data centers closer to their customers or end users and more edge computing. To give an example, according to Global Interconnection Index 2023 (GXI) from Equinix, organizations are interconnecting edge infrastructure 20% faster than core. In addition, the same index indicates that 30% of the digital infrastructure has been moved to Edge Computing. Another trend is that companies are increasingly aware of the data to know about their operation, their processes and interactions with customers, seeking a better interconnection with their ecosystem, directly with their suppliers or partners to offer digital services. On the side of user and customer experience there will always be the need for IT services with immediate, stable and reliable responses 24 hours a day, 365 days a year.
If you were interested in this article, you can also read: Network topology and distributed monitoring

by Olivia Díaz | Last updated Feb 23, 2024 | Pandora FMS
To address this issue, first understand that, in the digitization we are experiencing, there are multiple resources and devices that coexist in the same network and that require a set of rules, formats, policies and standards to be able to recognize each other, exchange data and, if possible, identify if there is a problem to communicate, regardless of the difference in design, hardware or infrastructure, using the same language to send and receive information. This is what we call network protocols (network protocols), which we can classify as:
- Network communication protocols for communication between network devices, whether in file transfer between computers or over the Internet, up to text message exchange and communication between routers and external devices or the Internet of Things (IoT). For example: Bluetooth, FTP, TCP/IP and HTTP.
- Network security protocols to implement security in network communications so that unauthorized users cannot access data transferred over a network, whether through passwords, authentication, or data encryption. For example: HTTPS, SSL, SSH and SFTP.
- Network administration protocols that allow network management and maintenance to be implemented by defining the procedures necessary to operate a network. These protocols are responsible for ensuring that each device is connected to others and to the network itself, as well as monitoring the stability of these connections. They are also resources for troubleshooting and assessing network connection quality.
Importance and Context in Network Management
Network management ranges from initial configuration to permanent monitoring of resources and devices, in order to ensure connectivity, security and proper maintenance of the network. This efficient communication and data flow have an impact on the business to achieve its objectives in stable, reliable, safe, efficient environments, better user experience and, consequently, the best experience of partners and customers.
Something important is the knowledge of the network context (topology and design), since there is an impact on its scalability, security and complexity. Through network diagrams, maps and documentation to visualize and understand the topology and design of the network, it is possible to perform analyses to identify potential bottlenecks, vulnerabilities and inefficiencies where action must be taken to correct or optimize it.
Another important aspect is the shared resources not only in the network but in increasingly widespread infrastructures in the cloud, in Edge Computing and even in the Internet of Things that demand monitoring of the state of the network, network configuration and diagnosis to promote efficiency, establish priorities and also anticipate or solve connection problems in the network and on the internet.
We’ll talk about the benefits of Network Management later.
Network protocols vs network management protocols
As explained above, network management protocols are part of network protocols. Although they may seem the same, there are differences: network protocols, as a rule, allow data transfer between two or more devices and are not intended to manage or administer such devices, while network administration protocols do not aim at the transfer of information, but the transfer of administrative data (definition of processes, procedures and policies), which allow to manage, monitor and maintain a computer network.
The key issue is to understand the following:
- Within the same network, network communication protocols will have to coexist with network management protocols.
- Network management protocols also have an impact on the overall performance of the platforms, so it is essential to know and control them.
- The adoption of cloud and emerging technologies, such as Edge Computing and the Internet of Things, make it clear that reliable and efficient connectivity is critical.
Deep Network Management Protocols
Network management protocols make it possible to know the status of resources, equipment and devices on the network (routers, computers, servers, sensors, etc.), and provide information on their availability, possible network latency or data loss, failures, among others. The most common network management protocols are: Simple Network Management Protocol (SNMP), Internet Control Message Protocol (ICMP) and Windows Management Instrumentation (WMI), as seen in the diagram below and explained below:
Simple Network Management Protocol (SNMP)
SNMP is a set of protocols for managing and monitoring the network, which are compatible with most devices (switches, workstations, printers, modems and others) and brands (most manufacturers make sure their product includes SNMP support) to detect conditions. SNMP standards include an application layer protocol, a set of data objects, and a methodology for storing, manipulating, and using data objects in a database schema. These protocols are defined by the Internet Architecture Board (Internet Architecture Board, IAB) and have evolved since their first implementation:
- SNMPv1: first version operating within the structure management information specification and described in RFC 1157
- SNMPv2: Improved support for efficiency and error handling, described in RFC 1901.
- SNMPv3: This version improves security and privacy, introduced in RFC 3410.
SNMP Architecture Breakdown: Agents and Administrators
All network management protocols propose an architecture and procedures to retrieve, collect, transfer, store and report management information from the managed elements. It is important to understand this architecture and its procedures to implement a solution based on said protocol.
The SNMP architecture is based on two basic components: Agents and Administrators or Managers, as we presented in the following diagram of a basic schema of the SNMP architecture:
Where:
- SNMP agents are pieces of software that run on the elements to be managed. They are responsible for collecting information on the device itself. Then, when SNMP administrators request such information through queries, the agent will send the corresponding. SNMP agents can also send the SNMP Manager information that does not correspond to a query but that comes from an event that takes place in the device and that requires to be notified. Then, it is said that the SNMP agent proactively sends a notification TRAP.
- SNMP Administrators are found as part of a management or monitoring tool and are designed to work as consoles where all the information captured and sent by the SNMP agents is centralized.
<
- OIDs (Object Identifier) are the items used to identify the items you want to manage. OIDs follow a format of numbers such as: .1.3.6.1.4.1.9.9.276.1.1.1.1.11. These numbers are retrieved from a hierarchical organization system that allows to identify the device manufacturer, to later identify the device and finally the item. In the following image we see an example of this OID tree outline.
- MIBs (Management Information Base) are the formats that the data sent from the SNMP agents to the SNMP managers will comply with. In practice, we have a general template with what we need to manage any device and then have individualized MIBs for each device, with their particular parameters and the values that these parameters can reach.
SNMP’s crucial functions are:
- Fault Validation: for detection, isolation and correction of network problems. With the SNMP trap operation, you may get the problem report from the SNMP agent running on that machine. The network administrator can then decide how, testing it, correcting or isolating that problematic entity. The OpManager SNMP monitor has an alert system that ensures you are notified well in advance of network issues such as faults and performance slowdowns.
- Performance Metrics Network: performance monitoring is a process for tracking and analyzing network events and activities to make necessary adjustments that improve network performance. With SNMP get and set operations, network administrators can track network performance. OpManager, an SNMP network monitoring tool, comes with powerful and detailed reports to help you analyze key performance metrics such as network availability, response times, throughput, and resource usage, making SNMP Management easier.
To learn more about SNMP, we recommend reading Blog SNMP Monitoring: keys to learn how to use the Simple Network Administration Protocol
Internet Control Message Protocol (ICMP)
This is a network layer protocol used by network devices to diagnose communication problems and perform management queries. This allows ICMP to be used to determine whether or not data reaches the intended destination in a timely manner and its causes, as well as to analyze performance metrics such as latency levels, response time or packet loss. ICMP contemplated messages typically fall into two categories:
- Error Messages: Used to report an error in packet transmission.
- Control messages: Used to report on device status.
The architecture that ICMP works with is very flexible, since any device on the network can send, receive or process ICMP messages about errors and necessary controls on network systems informing the original source so that the problem detected is avoided or corrected. The most common types of ICMP menssages are key in fault detection and performance metric calculations:
- Time-Out: Sent by a router to indicate that a packet has been discarded because it exceeded its time-to-live (TTL) value.
- Echo Request and Echo Response: Used to test network connectivity and determine round-trip time for packets sent between two devices.
- Unreachable Destination: Sent by a router to indicate that a packet cannot be delivered to its destination.
- Redirect: Sent by a router to inform a host that it should send packets to a different router.
- Parameter issue: Sent by a router to indicate that a packet contains an error in one of its fields.
For example, each router that forwards an IP datagram has to decrease the IP header time-to-live (TTL) field by one unit; if the TTL reaches zero, an ICMP type 11 message (“Time Exceeded”) is sent to the datagram originator.
It should be noted that sometimes it is necessary to analyze the content of the ICMP message to determine the type of error that should be sent to the application responsible for transmitting the IP packet that will ICMP message forwarding.
For more detail, it is recommended to access Pandora Discussion Forums FMS, with tips and experiences of users and colleagues in Network Management using this protocol.
Windows Management Instrumentation (WMI)
With WMI (Windows Management Instrumentation) we will move in the universe composed of computers running a Windows operating system and the applications that depend on this operating system. In fact, WMI proposes a model for us to represent, obtain, store and share management information about Windows-based hardware and software, both local and remote. Also, WMI allows the execution of certain actions. For example, IT developers and administrators can use WMI scripts or applications to automate administrative tasks on remotely located computers, as well as fetch data from WMI in multiple programming languages.
Architecture WMI
WMI architecture is made up of WMI Providers, WMI Infrastructure and Applications, Services or Scripts as exemplified in this diagram:
Where:
- A WMI provider is a piece responsible for obtaining management information for one or more items.
- The WMI infrastructure works as an intermediary between the providers and the administration tools. Among its responsibilities are the following:
- Obtaining in a scheduled way the data generated by the suppliers.
- Maintaining a repository with all the data obtained in a scheduled manner.
- Dynamically finding the data requested by administration tools, for which a search will be made in the repository and, if the requested data is not found, a search will be made among the appropriate providers.
- Administration applications correspond to applications, services or scripts that use and process information about managed items. WMI manages to offer a consistent interface through which you may have applications, services and scripts requesting data and executing the actions proposed by WMI providers about the items that you wish to manage.
CIM usage and WMI Class Breakdown
WMI is based on CIM (Common Information Model), which is a model that uses item-based techniques to describe different parts of a company. It is a very widespread model in Microsoft products; In fact, when Microsoft Office or an Exchange server is installed, for example, the extension of the model corresponding to the product is installed automatically.
Precisely that extension that comes with each product is what is known as WMI CLASS, which describes the item to be managed and everything that can be done with it. This description starts from the attributes that the class handles, such as:
- Properties: Properties that refer to item features, such as their name, for example.
- Methods: Actions that refer to the actions that can be performed on the object, such as “hold” in the case of an item that is a service.
- Associations: They refer to possible associations between items.
Now, once WMI providers use the classes of the items to collect administration information and this information goes to the WMI infrastructure, it is required to organize data in some way. This organization is achieved through logical containers called namespaces, which are defined by administration area and contain the data that comes from related objects.
Namespaces are defined under a hierarchical scheme that recalls the outline that folders follow on a disk. An analogy many authors use to explain data sorting in WMI is to compare WMI to databases, where the classes correspond to the tables, the namespaces to the databases, and the WMI infrastructure to the database handler.
To learn more about WMI, we recommend reading our blog post What is WMI? Windows Management Instrumentation, do you know it?
Key Insights for Network Management Protocol Analysis:
It is easy to understand that the more complex and heterogeneous the platform you want to manage, the greater its difficulty from three angles:
- Faults: have fault detection procedures and a scheme for reporting them.
- Performance: Information about platform performance to understand and optimize its performance.
- Actions: Many administration protocols include the possibility of executing actions on network devices (updating, changes, setting up alerts, reconfigurations, among others).
It is important to understand which of the three angles each of the protocols tackels and, therefore, what it will allow you to do. A fundamental pillar is Data Organization, which we will explain below.
Effective data organization: a fundamental pillar in network management protocols
A fundamental aspect of Network Management Protocols is the way in which the elements to be managed are defined and identified, making approaches on:
- What element can I administer with this protocol?
- Should it just be the hardware or should applications be considered too, for example?
- What format should be used to handle data? And how is it stored, if so?
- What are the options you have to access this information?
In that sense, effective data sorting allows the successful information exchange between devices and network resources. In network monitoring, data is required from routers, switches, firewalls, load balancers, and even endpoints, such as servers and workstations. The data obtained is filtered and analyzed to identify possible network problems such as configuration changes or device failures, link interruptions, interface errors, lost packets, latency or response time of applications or services on the network. Data also makes it possible to implement resource planning due to traffic growth or the incorporation of new users or services.
Challenges, Benefits and Key Tasks in Network Management Protocols
For those in charge of operating and managing enterprise networks, it is important to know five common challenges:
- Mixed environments, in which resources and devices exist in local and remote networks (including Edge Computing and IoT), which makes it necessary to adapt to the demands of hybrid networks.
- Understand network needs and perform strategic planning, not only in physical environments but also in the cloud.
- Reinforcing the security and reliability of increasingly dynamic networks, more so when business ecosystems are engaging interconnecting customers, suppliers, and business partners.
- Achieve observability that gets rid of network blind spots and provide a comprehensive view of IT infrastructure.
- Establish a network management strategy that can be connected, integrated, and even automated, especially when IT teams are doing more and more tasks in their day-to-day lives.
As we have seen throughout this Blog, understanding how network management protocols work is essential for communication, business continuity and security, which together have a great impact on organizations to:
- Establish and maintain stable connections between devices on the same network, which in turn results in less latency and a better experience for network users.
- Manage and combine multiple network connections, even from a single link, which can strengthen the connection and prevent potential failures.
- Identify and solve errors that affect the network, evaluating the quality of the connection and solving problems (lower latency, communication reestablishment, risk prevention in operations, etc.)
- Establish strategies to protect the network and the data transmitted through it, relying on encryption, entity authentication (of devices or users), transport security (between one device and another).
- Implementing performance metrics that ensure quality service levels.
Key Tasks and Benefits in Network Management
Efficient network administration involves device connectivity, access systems, network automation, server connectivity, switch management and network security, so it is recommended to carry out the following tasks:
- Strategies for Upgrades and Effective Maintenance: One of the big challenges is achieving end-to-end network visibility in an increasingly complex business environment. Most IT professionals have an incomplete understanding of how their network is set up, as new components, hardware, switches, devices, etc. are constantly being added, so it is vital to maintain an up-to-date catalog of your network and provide proper maintenance to guide network management principles and enforce the correct policies. You also have to consider that there are resource changes in your IT team. It is possible that the original administrator who defined the network topology and required protocols may no longer be available, which could result in having to undergo a full network administration review and incur additional costs. This can be avoided by detailed documentation of configurations, security policies, and architectures to ensure that management practices remain reusable over time.
- Rigorous Performance Monitoring: Network management demands performance monitoring (e.g. with a dashboard with performance indicators) consistently and rigorously with defined standards to provide the best service and a satisfactory usage experience without latency and as stable as possible. Previously this was a greater challenge when traditional network environments relied primarily on hardware for multiple devices, computers, and managed servers; today, advances in software-defined networking technology make it possible to standardize processes and minimize human effort to monitor performance in real time. It is also recommended to ensure that network management software is not biased towards one or a few original equipment manufacturers (OEMs) to avoid dependence on one or a few vendors in the long run. The impact would also be seen in the difficulty in diversifying IT investments over time.
- Downtime Prevention: A team designated for network failure management allows you to anticipate, detect and resolve network incidents to minimize downtime. On top of that, the team is responsible for logging information about failures, performing logs, analyzing, and assisting in periodic audits. This implies that the network failure management team has the ability to report to the network administrator to maintain transparency, and to be in close collaboration with the end user in case failures need to be reported. Also, it is recommended to rely on a Managed Service Provider (MSP) as an external partner that can assist in the design and implementation of the network and in routine maintenance, security controls and configuration changes, in addition to being able to support on-site management and support.
- Network Security Threat and Protection Management: Business processes are increasingly moving online, so network security is vital to achieving resilience, alongside risk management.
A regular stream of logs is generated in an enterprise network and analyzed by the network security management team to find digital fingerprints of threats. Depending on the business and the size of the organization, it is possible to have equipment or personnel assigned for each type of network management. Although it is also recommended to rely on services managed by experts in the industry in which the organization operates, with a clear knowledge of common risks, best security practices and with experts in the field of security that constantly evolves and becomes more sophisticated.
- Agile IP Address Management and Efficient Provisioning: Network protocols are the backbone of digital communication with rules and procedures on how data is transmitted between devices within a network, regardless of the hardware or software involved. Provisioning must contemplate the IT infrastructure in the company and the flow and transit of data at different levels from the network, including servers, applications and users to provide connectivity and security (also managing devices and user identities).
Another important task in network management is transparency about usage, anomalies and usage trends for different functions or business units and even individual users. This is of particular value for large companies in that they must make transparent the use of shared services that rent network resources to different branches and subsidiaries to maintain an internal profit margin.
Summary and conclusions
In business digitization, Network Management Protocols aims to take actions and standardize processes to achieve a secure, reliable and high-performance network for end users (employees, partners, suppliers and end customers). Companies distributed in different geographies depend on Network Management Protocols to keep the different business areas, functions and business teams connected, allowing the flow of data inside and outside the company, whether on local servers, private clouds or public clouds.
As technology continues to evolve, so do network protocols. The IT strategist and the teams assigned to network management must prepare for the future of network protocols and the integration of emerging technologies, to take advantage of advances in speed, reliability and security. For example, 5G is a technology that is expected to have a significant impact on networks, driven by the need for greater connectivity and lower latency. People’s daily lives also involve connecting objects (vehicles, appliances, sensors, etc.), revolutionizing networks to meet the Internet of Things. In Security, more robust network protocols are being developed, such as Transport Layer Security (TLS), which encrypts transmitted data to prevent access or manipulation by third parties.
All this tells us that the development of network protocols will not slow down in the short term as we move towards an increasingly connected world.
Pandora FMS works with the three main protocols for network management to offer a comprehensive and flexible monitoring solution. Check with Pandora FMS sales team for a free trial of the most flexible monitoring software on the market: https://pandorafms.com/en/free-trial/
Also, remember that if your monitoring needs are more limited, you have at your disposal the OpenSource version of Pandora FMS. Find out more here: http://pandorafms.com/community
Do not hesitate to send us your queries. Our Pandora FMS team will be glad to assist you!

by Olivia Díaz | Last updated Feb 23, 2024 | Pandora FMS
Digital-First has become the trend of organizations in the world and Latin America, in which a digital strategy is chosen first for product and service delivery, especially when a greater impact of the brand is sought more immediately to a certain segment of the market along with a wider dissemination on the offer, in a more customized way and, above all, if it seeks to get closer to the end customer. According to Marketing4Commerce, Digital Report, the number of internet users in the world reaches 5.16 billion (64.4% of the world’s population, as of 2023) with an internet browsing time greater than 6 hours, and people with mobile devices reach 5.44 billion (68% of the world’s population, as of 2023).
Also, we see this reflected in an Adobe report (Digital Trends 2023) in which more than 70% of organizations, both leaders and followers, believe that their customers’ expectations are constantly adjusted to align with improved omnichannel experiences, this is because end customers are constantly evaluating their experiences in comparison to their last best experience. Certainly, the most memorable experiences will be created by organizations that know how to leverage data and combine it with human knowledge to anticipate customer needs, with greater empathy and in a more individualized way.
In this scenario, Artificial Intelligence (AI) becomes an ally to implement customer experience strategies in a customized and innovative way, taking advantage of voice recognition tools, understanding of natural language, data on behavior patterns and customer preferences. In recent years, interactions with virtual assistants have become commonplace, prompting the development of language models for certain tasks or expected outcomes. This is known as Prompt Engineering, which is the process of building alerts or inputs to guide a certain AI system behavior and get desired and accurate answers from AI models. So AI assumes a digital collaborator role that not only works as a point of contact with customers, but also boosts knowledge and productivity for the organization’s collaborators.
What is Prompt Engineering?
According to Techopedia, (Prompt Engineering) refers to a technique used in artificial intelligence (AI) to optimize and adjust language models for particular tasks and desired outcomes. Also known as Prompt design, which carefully builds prompts or inputs for AI models in order to improve their performance of specific tasks. Properly designed prompts are used to guide and modify the desired performance of the AI system and obtain accurate and desired responses from AI models.
Prompt Engineering uses the capabilities of language models and optimizes their results through properly designed prompts. This allows not only to rely on pre-training or fine-tuning, but also to help users guide models to specific goals by encouraging accurate responses and providing direct directions, exceptions, or examples in prompts.
According to a survey conducted by COPC Inc. During 2022, “Improving Customer Experience” reached 87% as the most mentioned goal in terms of implementing AI-based solutions. In this regard, 83% of respondents stated that they use AI-based solutions mainly for contact applications with their customers, and that AI has endless uses that directly impact Customer Experience. According to a study conducted by CX optimization 2023, the most implemented uses are content creation, customer profiling and reduction of internal calls.
Large Language Models, LLM),which are advanced linguistic models based on Deep Learning algorithms to process and analyze large amounts of text data. LLM works from artificial neural networks (systems that are inspired by the function of the human brain), which are trained to learn patterns and relationships in a text and generate answers to users’ questions. This enables LLM to be able to analyze large volumes of text data and from that, use that information to understand words, phrases and sentences and their contexts, enabling human-IA communication.
Prompt Engineering Technical Side
As we mentioned earlier, LLMs are trained from large amounts of text data to teach the model to recognize relationships and patterns in a text. All this data is processed to adjust model parameters and thereby improve language accuracy and understanding. Text preprocessing techniques (removal of irrelevant words, standardization of words to detect the variability of a text), hyperparameter adjustments and optimization are also used to achieve the highest model accuracy. To implement Prompt Engineering, there are several techniques, such as:
- Zero-Shot Prompting: It generates a response without giving linguistic models examples or previous context. It is used for quick answers to general questions or topics.
- Example: “What is a prompt?”
- Answer: “A Prompt is…”
- One-Shot Prompting: A response is retrieved from an example or context provided by the user.
- Example: “If budget in Portuguese is orçamento, how can I translate Supplier?”
- Answer: “Fornecedor”.
- Information Retrieval: Generative AI is asked a specific question for detailed answers. The key to this is the data source from which the LLMs are fed. For example, ChatGPT only has access to data after September 2021.
- Example: “What are the advantages of LLM?”
- Answer: “1. Content diversification. 2. Customization…”
- Creative Writing: Through this technique it is possible to develop texts with imagination, stories and textual expressions that adapt to the preferences of the audience.
- Example: “Write a poem to the moon”
- Answer: “The moon can be taken in tablespoons…or as a capsule every two hours. It is good as a hypnotic and sedative and also relieves. “
- Context Enrichment: Enrichment of information to Artificial Intelligence to improve understanding using methods 5W and 1H, (which refers to 5 W questions: Who, What, Where, When, Why); and 1 H, which is the How of a topic.
- Example: “Is it good to eat Beets?”
- Answer: “Who: Most people can eat Beet; What: “Beet or beetroot refers to an edible deep red tuber…”
- Content Summary with a Specific Focus: It consists of directing the attention of AI to specific aspects of instruction, with a particular emphasis. It can be highlighted which elements should be prioritized in the model, so that the summary reflects the essence of the approach.
- Example: “Full guide on website optimization techniques, but I only want the mobile optimization strategies.”
- Answer: “The key aspects are: Mobile Cache – enabling this option allows…; List of Mobile User Agents – if the Mobile Cache feature is enabled…”
- Fill Templates: To create versatile and structured content. A template with placeholders is used to customize prompts in different instructions while maintaining consistency. Content managers or web developers use this strategy to create custom content snippets, which have been generated by AI on their websites. An example is using a standard template for quoting, making AI fill in customer data, products, pricing, etc. Another example is automating custom emails from a template with a general structure – from the greeting, main text, farewell (‘Hello {Name}, Thank you for requesting our {Service}… {Close}.”
- Prompt Customization or Prompt Reframing: It allows you to change the wording of the questions while maintaining the original intent of the query. The language model can be designed to give multiple answers that respond to the original query in different ways. This can be done with synonyms or question rephrasing.
- Example: “Original prompt: What are the ways to reduce network latency? Reworded Prompt: Can you list techniques to optimize network speed?”
- Prompt Combination: It consists of merging different prompts or questions in the same instruction to obtain a complete answer.
- Example: “Can you explain the differences between shared hosting and VPS hosting and recommend which one is better for a small e-commerce website?”
- Answer: “Shared hosting and VPS hosting are two types of hosting services… Shared Hosting: …”
- CChain-Of-Thought Prompting: It uses real-time AI interactions to guide toward more accurate and complete responses. It is not based on a single question, but on a sequence of questions or examples associated with it in order to elaborate on the original query. To do this, you need to divide a query or a complex topic into smaller sections. These parts are then presented as a sequence of queries that build on top of each other, to drive AI toward a desired answer.
- Example: “What is the Main Theme?… For what purpose?… Who is the audience?…”
- Iterative Prompting: It consists of making follow-up queries based on previous responses to dive into a certain topic, obtain additional information, or clarify any ambiguities about the initial result. This technique requires experts in (Natural Language Processing) to design iterative prompts and elaborate responses similar to those made by a human being.
- Example: “What are the best movies of 2022?”
- Answer: “‘Drive My Car’ by Ryûsuke Hamaguchi; ‘The Alley of Lost Souls’ by Guillermo del Toro; Martin McDonagh’s ‘The Banshees of Inisherin’; ‘Holy Spider’ by Ali Abbasi…”
- Interactive Storytelling & Role-Playing: It leverages AI’s ability to tailor responses based on previous prompts and interactions, developing a fluid narrative.
- Example: “Prompt: I want to start a collaborative storytelling exercise with you. We will write a fantasy story about a land where magic exists,… The character will be….”
- Answer: “In the shadows of a forest there was a…”
- Implicit Information Injection: The particularity of this technique is that context is subtly given so that AI understands the needs without the need to express it explicitly.
- Example: “Can you mention the best practices of Modernizing a Datacenter?”
- Answer: “1- Raise the operating temperature of your data center; 2- Upgrade servers and systems for better consolidation and efficiency.”
- Translation of Languages with Contextual Nuances: Generation of multilingual content, beyond translating words from one language to another, considering the cultural context or situation for a more accurate and natural translation.
- Example: “Translate the sentence “She took the ball and ran with it” from English to French, bearing in mind that it is a business metaphor to refer to taking the reins of a project.”
- Answer: “Elle a pris le ballon et a foncé avec”, considering the idea of taking the initiative of a project.”
In addition to these, we can mention Automatic Prompt Engineering (APE) as an advance in Artificial Intelligence that leverages LLMs to help AI automatically generate and select instructions on its own. The main steps are:
- Assign the chatbot a specific task and show some examples.
- The chatbot comes up with different ways to do the job, either by direct reasoning or by taking into account similar tasks that it knows.
- These different methods are then tested in practice.
- The chatbot assesses the effectiveness of each method.
- AI will then choose a better method and apply it.
By means of Machine Learning, Generative AI tools can streamline tasks, from in-context data analysis to automated customer service, without the need for constant human-generated prompts.
It is worth mentioning that in Prompt Engineering it is important to consider basic technical aspects such as Temperature and what we call Top-K Sampling ,to improve the quality and diversity of AI-generated content, by influencing the model’s token (word or subword) selection process:
- Temperature: A higher temperature value (e.g., 1.0 or higher) will result in more diverse and creative text, while a lower value (e.g., 0.5 or lower) will produce more focused and deterministic results. To do this, it is recommended to encourage creativity based on higher temperature values when generating creative writing, brainstorming sessions or exploring innovative ideas. It is also recommended to improve coherence, opting for lower temperature values with well-structured, coherent and focused content, such as technical documentation or formal articles.
- Top-k sampling: is another recommended technique in AI text generation to control the model token selection process, from a restricted set of most likable k tokens. A smaller k value (e.g., 20 or 40) will result in more focused and deterministic text, while a larger k value (e.g., 100 or 200) will produce more diverse and creative results. Applications of top-k sampling include driving content diversity, using larger k-values when generating content that requires a wide range of ideas, perspectives, or vocabularies. It is also about ensuring focused results, choosing smaller k-values, generating content that requires a high degree of concentration, accuracy or consistency.
To implement the Temperature and Top-k Sampling techniques, Experimentation (testing multiple combinations of temperature and top-k values to identify the optimal configuration for tasks or contents) and Sequential Adjustments, are recommended, during the text generation process to control the performance of the AI model at different stages. For example, start with a high temperature and a large k-value to generate creative ideas, then switch to lower values for further refinement and focus.
Finally, it is recommended to apply the downward gradients which consist of an optimization algorithm to minimize an objective function and calculate the rate of change or gradient of the loss function. In Machine Learning this objective function is usually the loss function to evaluate the performance of the model. Parameters are updated iteratively using downward gradients until a local minimum is reached.
Why Question Engineering Matters
The speed with which OpenAI ChatGPT works since 2022 is overwhelming, today it is being used by millions of people, as a form of conversational artificial intelligence, based on advanced deep learning algorithms to understand human language.
Currently, organizations use multiple AI techniques such as Natural Language Processing, Question Engineering, Artificial Neural Network (NN), Machine Learning, and Markov Decision Processing, (MDP) to automate different tasks.
The importance of Question Engineering is that it improves the customer experience and interactions between people and AI, and contributes to building better conversational AI systems. These conversational AI systems dominate and will dominate the market in the coming years by using LLM in a consistent, relevant and accurate way. Just for reference, we have ChatGPT reaching 100 million active users within weeks of its launch.
For developers, Question Engineering helps to understand how AI-based models arrive at the expected answers and also obtain accurate information on how AI models work on the back-end. Of course, the development of prompts covering several topics and scenarios will be needed. Other benefits that you may mention are: that Question Engineering and the context of the text-image synthesis, allow to customize the features of the image (the style, the perspective, the aspect ratio, the point of view and the image resolution). It also plays an important role in the identification and mitigation of prompt injection attacks, thus protecting AI models from possible malicious activities.
Evolución de la Ingeniería de Preguntas
Natural Language Processing (NLP), is part of AI that helps perceive, as its name says, the “natural language” used by humans, enabling interaction between people and computers, thanks to its ability to understand words, phrases and sentences. It also includes syntactic (meaning of words and vocabulary) and semantic (comprehension within a sentence or combination of sentences) processing. The first lights of NLP were seen in the 1950s, when rule-based methods began to be adopted, consisting mostly of machine translation. Its application was in word/sentence analysis, answering questions and machine translation. Until the 1980s, computational grammar appeared as an active field of research. There was more availability of grammar tools and resources, which boosted their demand. Towards the 90s, the use of the web generated a large volume of knowledge, which boosted statistical learning methods that required working with NLP. In 2012 Deep Learning appeared as a solution for statistical learning, producing improvements in NLP systems, deepening raw data and learning from its attributes.
By 2019, the Generative Pre-trained Transformer (GPT) a remarkable advance in the domain of natural language processing emerged, as it is possible to pre-train large-scale language models to teach AI systems how to represent words and sentences in context. This enabled the development of machines that can understand and communicate using language in a manner very similar to that of humans. Its most popular application is ChatGPT, which obtains information from texts published since 2021 on the Internet, including news, encyclopedias, books, websites, among others, but lacks the ability to discriminate which information is true and which is not. Precisely for this reason, Question Engineering emerges as a method to optimize natural language processing in AI and improve the accuracy and quality of its answers.
The Art and Science of Creating Questions
A prompt is itself a text included in the Language Model (LM), and Question Engineering is the art of designing that text to get the desired result, with quality and accuracy. This involves tailoring data input so that AI-driven tools can understand user intent and get clear and concise answers. Which tells us that the process must be effective to ensure that AI-driven tools do not generate inappropriate and meaningless responses, especially when GPT solutions are based mostly on the frequency and association of words, and may yield incomplete or erroneous results.
To create Questions in Generative AI tools, it is recommended to follow this essential guide:
- Understanding the Desired Outcome
Successful Prompt Engineering starts with knowing what questions to ask and how to do it effectively. So the user must be clear about what they want in the first place: objectives of the interaction and a clear outline of the expected results (what to get, for what audience and any associated actions that the system must perform).
- Choose words carefully
Like any computer system, AI tools can be precise in their use of commands and language, not knowing how to respond to unrecognized commands or language. It is recommended to avoid ambiguity, metaphors, idioms and specific jargon so as not to produce unexpected and undesirable results.
- Remember that form matters
AI systems work based on simple, straightforward requests, through informal sentences and simple language. But complex requests will benefit from detailed, well-structured queries that adhere to a form or format consistent with the internal design of the system. This is essential in Prompt Engineering, as the shape and format may differ for each model, and some tools may have a preferred structure involving the use of keywords in predictable locations.
- Make clear and specific requests
Consider that the system can only act on what it can interpret from a given message. So you have to make clear, explicit and actionable requests and understand the desired outcome. From there, work should then be done to describe the task to be performed or articulate the question to be answered.
- Pay attention to length
Prompts may be subject to a minimum and maximum number of characters. Even though there are AI interfaces that do not impose a strict limit, extremely long indications can be difficult for AI systems to handle.
- Raise open-ended questions or requests
The purpose of Generative AI is to create. Simple Yes or No questions are limiting and with possible short and uninteresting results. Open-ended questions allow for more flexibility.
- Include context
A generative AI tool can meet a wide range of objectives and expectations, from brief and general summaries to detailed explorations. To take advantage of this versatility, well-designed prompts include context that helps the AI system tailor its output to the intended audience.
- Setting goals or production duration limits
Although generative AI claims to be creative, it is often advisable to include barriers in factors such as output duration. Context elements in prompts may include, for example, requesting a simplified and concise response versus a long and detailed response. Also consider that natural language processing models, such as GPT-3, are trained to predict words based on language patterns, not to count them.
- Avoid contradictory terms
Also derived from long prompts and may include ambiguous or contradictory terms. It is recommended for Prompt engineers to review Prompt training and ensure all terms are consistent. Another recommendation is to use positive language and avoid negative language. The logic is that AI models are trained to perform specific tasks, not to do them.
- Use punctuation to clarify complex cues
Just like humans, AI systems rely on punctuation to help analyze a text. AI prompts can also make use of commas, quotation marks, and line breaks to help the system analyze and operate in a complex query.
Regarding images, it is recommended to consider their description, the environment and mood in their context, colors, light, realism.
How Question Engineering Works
Prompt Engineering is a discipline to promote and optimize the use of language models in AI, through the creation and testing of data inputs, with different sentences to evaluate the answers obtained, based on trial and error until the training of the AI-based system is achieved, following these fundamental tasks:
- Specify the task: Definition of an objective in the language model, which may involve NLP-related tasks such as complementation, translation, text summary.
- Identify inputs and outputs: Definition of the inputs that are required in the language model and the desired outputs or results.
- Create informative prompts: Creation of prompts that clearly communicate the expected behavior in the model, which must be clear, brief and in accordance with the purpose for which it was created.
- Interact and evaluate: It is tested using language models and evaluating the results that are returned, looking for flaws and identifying biases to make adjustments that improve their performance.
- Calibrate and refine: It consists of taking into account the findings obtained, making adjustments until the behavior required in the model is obtained, aligned with the requirements and intentions with which the prompt was created.
Throughout this process, the Prompt Engineer should keep in mind that when designing questions it is critical to be clear and accurate. If the designed message is ambiguous, the model will have difficulties for responding with quality. When designing prompts, attention should be paid to the sources used during the previous training, considering audiences without gender and cultural bias, to promote respect and inclusion. What is recommended is to focus on responses aimed at helping, learning, and providing neutral, fact-based responses
Also, the Role Play application is recommended in which a scenario is created where the model assumes a role and interacts with another entity. For example, if you wish to create a product review, you may take on the role of a customer who tried a product and writes down their satisfactory experience.
The Role of a Question Engineer
A Prompt Engineer es el responsable de diseñar, desarrollar, probar, depurar, mantener y actualizar aplicaciones de IA, en estrecha colaboración con otros desarrolladores de software para garantizar que el software responda y funcione de manera eficiente. En su función se requiere creatividad y atención al detalle para elegir palabras, frases, símbolos y formatos correctos que guíen al modelo IA en la generación de textos relevantes y de alta calidad. Este rol emergente ha cobrado mayor relevancia en la necesidad de que IA contribuya a mejorar y agilizar los servicios ante el cliente y en forma interna. Ahora, si nos preguntamos quiénes puede ser Ingenieros de Preguntas, no solo para agilizar sus tareas sino para desarrollarse profesionalmente, podemos decir que pueden ser los investigadores e ingenieros de IA, los científicos y analistas de datos, los creadores de contenido, ejecutivos de atención al cliente, personal docente, profesionales de negocios, investigadores. Se espera que la demanda de Ingenieros de Preguntas crezca en la medida que las organizaciones requieran de personas que sepan manejar las herramientas impulsadas por IA.
The Future of Prompt Engineering
It is anticipated that trends towards a future of Prompt Engineering will be linked to integration with augmented reality (AR) and virtual reality (VR), in the sense that the proper application of prompts can enhance immersive AR/VR experiences, optimizing AI interactions in 3D environments. Advances in Prompt Engineering allow users to converse with AI characters, request information, and issue natural language commands in simulated, real-time environments. This is based on the fact that, with Prompt Engineering, AI can be provided with a context or situation, a conversation and the exchange of the human being with AR/VR applications, whether for spatial, educational, research or exploration use.
Another of the forecasts of the use of Prompt Engineering is the possibility of achieving a simultaneous translation in spoken and written languages, taking advantage of the contexts in several languages so that AI translates bi-directionally in real time and in the most reliable way possible. The impact of this is communication in business, multicultural, diplomatic and personal contexts, taking into account regional dialects, cultural nuances and speech patterns.
Regarding interdisciplinary creativity, Prompt Engineering can boost AI to generate art, stories, works and music, combining with human creativity. Of course, this may have ethical implications, although the access of AI for artistic purposes is also democratized.
Of course, as Prompt Engineering matures, questions about fairness, respect and alignment with moral values are raised, from the formulation of the query itself to the type of answers that can be derived. Keep in mind that in the future of AI and Prompt Engineering, technology will always be a reflection of people.
Challenges and Opportunities
As we have seen, Prompt Engineering represents the opportunity to develop well-designed Prompts that improve the features of AI, more efficiently and effectively. The advantage of this is that everyday tasks can be streamlined, in addition to expanding knowledge on different topics and boosting creativity. Inclusion is also encouraged when properly implemented, with a positive impact on gender experiences.
On the other hand there are poorly designed questions that can result in AI responses with bias, prejudice, or erroneous data. Hence, ethical considerations in Prompt Engineering can mitigate these risks, without compromising fairness, respect, and inclusion. Also, the lack of application of best practices, even by professionals in the field, may not achieve the desired result on the first attempt and may be difficult to find a suitable point to start the process.
It can also be difficult to control the level of creativity and uniqueness of the result. Often, Prompt Engineering professionals can provide additional information in the message that may confuse the AI model and affect the accuracy of the answer.
Conclusions
In the digital economy, the most memorable experiences will be those in which data is leveraged and combined with human knowledge to anticipate customer needs, with empathy and customization. In this environment, AI becomes the digital partner, not only as a point of contact with the customer, but also as a driver of productivity in the organization. It is true that GPT has gained traction in a search for closer proximity to the customer; however, it is based on frequency and word association, lacking the ability to differentiate correct from incorrect information. Due to this need to improve the quality of answers that Prompt Engineering takes relevance to develop and optimize AI natural language models and obtain quality and accuracy in their answers, based on a greater understanding of user intent. Without a doubt, the demand for the Prompt Engineer will grow, confirming that organizations require professionals who know how to understand the nature of AI-based tools.
It is clear that, as the adoption of Mature Prompt Engineering will continue to raise issues of equity, respect and alignment with moral values in the formulation of prompts and results, so appropriate techniques are required to achieve its implementation without bias or prejudice. To embark on this journey to Prompt Engineering, it is recommended to be accompanied by a technology partner who transmits to their team the best techniques and practices for its implementation.

by Olivia Díaz | Last updated Feb 23, 2024 | Remote Control
It would seem like the line between science fiction and reality is increasingly blurred. We no longer see this only in the movies and games, but in e-commerce, education, entertainment, staff training, remote diagnostics or architectural projects. Today Virtual Reality and Augmented Reality are changing the way we use screens by creating new, more interactive and immersive experiences. But… How do we define Virtual Reality and Augmented Reality?
Virtual Reality or VR refers to an artificial environment created with hardware and software, presented to the user in such a way that it looks and feels like a real environment. To “enter” a virtual reality, the user puts on gloves, headphones and special glasses, from which information is received from the computer system. In addition to providing sensory input to the user (three of the five senses: touch, hearing, and vision), the devices also monitor the user’s actions.
For Augmented Reality or AR), technology capable of inserting digital elements into real-world environments is used to offer customers and professionals a hybrid experience of reality. Although Augmented Reality is compatible with multiple devices, it is more popular for smartphone applications, with real-time interactions. In fact, most current AR tools are customer-oriented, although organizations are beginning to embrace AR in business processes, products, and services.
While AR is different from VR, both innovations represent a field of technology called extended reality (XR), encompassing all environments, real and virtual, represented by computer graphics or mobile devices. The goal of XR is to combine physical and virtual realities until users are unable to differentiate them, in addition to being available to anyone to improve their lives.
The importance of understanding each reality (AR and VR) is the potential to alter the digital landscape in life and business, transforming the way we communicate and interact with information and changing the way multiple industries can operate. We look at this in more detail below.
Augmented Reality (AR)
This reality incorporates virtual content into the physical world to improve user perception and interaction with a real environment. AR is experienced with smartphones, tablets or AR glasses, which project virtual objects, text or images so that users can interact simultaneously with virtual and physical elements.
For example, a camera on the device records the user’s environment and gyroscopes and accelerometers monitor the camera’s orientation and location. The AR software analyzes the camera’s transmission, which identifies objects and features in the environment. From there, users may interact with virtual objects using touchscreens, gestures, and voice commands. For example: from a Tablet, you may check suggestions for those who visit a city. The screen shows places to shop, eat, visit a museum, etc., based on the user’s preferences.
On the production floor of a manufacturing company, through AR lenses and software, maintenance engineers can obtain information on the health status of a piece of equipment, so that they can make decisions in real time and more proactively.
Another example can be seen in the design of spaces and architecture. From a lens you may get an image of what the completed project would look like to present the executive project to investors or detect improvements in the design and/or impact on the environment.
Operation and example of Virtual Reality (VR)
Within Extended Reality, virtual reality is the most popular form. Users wear headsets or virtual reality goggles (wearables) that have sensors to track movements and allow them to explore computer-generated virtual environments, as well as to interact with objects and participate in different activities displayed on screens or lenses.
In VR, users see three-dimensional (3D) images that create the feeling of depth and immersion, while spatial audio enhances the experience through headphones or speakers. We must also understand that the immersive experience is a format whose goal is to completely “immerse” the person in a specific real or virtual environment or context.
One of the most widespread applications of VR is in games, in which users interact directly with the game through devices such as glasses, belts, gloves and other accessories that improve player experience.
In industries, VR can support design and training with elements that could be risky for the operator in an induction stage. Risks are also reduced in product design or construction and architecture analysis.
In the field of health, VR has contributed to improvements in the diagnosis of both physical and mental illnesses, training of medical personnel, application of telemedicine, patient education about their condition, or a new approach to recovery or rehabilitation therapies (which transfers the mechanics of games to the educational-professional field). A very important thing in VR is that immersive content is as important as the hardware from which the user has interactions. Without hardware, there is no “simulated environment” that can be brought to life.
To arrive at what we understand today as VR, in 1961, what is considered the first virtual reality helmet was built (by scientists Corneau and Bryan), based on a system of magnetic sensors, incorporating the elements of virtual reality: isolation, freedom of perspective and an immersive sensory experience. A year later, Morton Heilig presented the Sensorama, which reproduced audiovisual content. Users fitted their heads into a device specially designed to live a three-dimensional experience where even odors were reproduced. It was a mechanical device, predating digital electronics. In 1965, Ivan Shuterland, laid the foundations of a multi-sensory system based on a computer. In 1968, Shutherland created the first head-mounted display (HMD) for use in immersive simulations. The graphs that comprised the virtual environment the user was in consisted of simple model rooms rendered from the wireframe algorithm (a visual representation of what users will see and interact with). This device was called The Sword of Damocles (the helmet was so large that it needed to be suspended from the ceiling).
Over time, advances were made, until in the 80s and 90s, the game companies Sega and Nintendo developed virtual reality game systems. In 2009, the Oculus Rift glasses emerged in a project by Palmer Luckey, to develop devices in the video game industry. Until the 2010s, the Oculus and HTC Vive companies introduced high-quality virtual reality headsets, being able to take advantage of powerful graphics and motion tracking technology. Recently, Apple, with Vision Pro, and Meta, with Oculus Go headphones, have generated great expectations about the use of VR.
As for the origins of AR, in 1974, Myron Kruger, a computer scientist and artist, built a lab at the University of Connecticut called ‘Videoplace’ that was entirely dedicated to artificial reality. Within these walls, projection and camera technology were used to cast on-screen silhouettes surrounding users for an interactive experience. Then, AR came out of the labs for use in different industries and commercial applications. In 1990, Tom Caudell, a researcher at Boeing, coined the term “augmented reality”. In 1992, Louis Rosenburg, a researcher at the USAF’s Armstrong’s Research Lab, created “Virtual Fixtures,” which was one of the first fully functional augmented reality systems. The system allowed military personnel to virtually control and guide machinery to perform tasks such as training their U.S. Air Force pilots in safer flying practices.
In 1994, Julie Martin, a writer and producer, brought augmented reality to the entertainment industry with the stage production Dancing in Cyberspace. The show featured acrobats dancing alongside virtual objects projected onto the physical stage.
In 1998, Sportsvision broadcasted the first NFL game live with the 1st & Ten virtual graphics system, also known as the yellow yard marker. The technology showed a yellow line overlaid on top of the transmission so you could quickly see where the team advanced to get a first try. In 1999, NASA created a hybrid synthetic vision system for its X-38 spacecraft. The system leveraged AR technology to help provide better navigation during test flights.
From those years to the present, AR has been widely adopted in various fields such as entertainment, industrial, personnel and design: Esquire magazine used augmented reality (2009) in print media for the first time in an attempt to bring the pages to life. When readers scanned the cover, the augmented reality-equipped magazine showed Robert Downey Jr. talking to readers. Volkswagen introduced the MARTA (Mobile Augmented Reality Technical Assistance) app in 2013, which mainly provided technicians with step-by-step repair instructions within the service manual. Google introduced Google Glass, which is a pair of augmented reality glasses for immersive experiences. Users with AR technology communicated with the Internet through natural language processing commands, being able to access a variety of applications such as Google Maps, Google+, Gmail and others. In 2016, Microsoft introduced HoloLens, which is a headset that runs on Windows 10 and is essentially a wearable computer that allows users to scan their environment and create their own AR experiences. In 2017, IKEA launched its augmented reality app called IKEA Place that changed the retail industry forever. The app allows customers to get a virtual preview of their home décor options before making a purchase.
Similarities and Differences between AR and VR
As we have seen, AR and VR are quite similar and offer virtual objects in real life. Their similarities can be summarized like this:
- They can display enlarged and life-size objects and use the same devices.
- 3D content is needed.
- They can be used on laptops, PCs, smartphones, etc.
- They include tracking of movement of hands, eyes, fingers and more.
- Inmersion is offered.
However, there are differences that we can summarize as follows:
|
Augmented Reality
|
Virtual Reality
|
|
It uses a real-world scenario to add a virtual item or object that can be viewed through a lens. AR augments the real-world scene
|
Everything is completely virtual, even the environment. VR is a fully immersive virtual environment
|
|
Users can control their minds and their presence in the real world. Users can feel their own presence along with virtual objects.
|
VR systems guide users in the virtual environment. Visual senses are controlled by the system. Only objects, sounds, etc., of the image can be perceived in your view
|
|
The user can access AR on their smartphone, laptop or tablet.
|
To access virtual reality, you need a headset.
|
|
AR enhances the virtual and real world and simplifies your work. In AR, the virtual world is 25% and the real world is 75%
|
VR enhances fictional reality. In VR, the virtual world is 75% and the real world is 25%
|
|
AR requires higher bandwidth, around 100 Mbps.
|
Virtual reality can work at low speeds. About 50 Mbps connection is required.
|
|
Audience: for those who need to add virtuality to the real world and improve both the virtual and real worlds. AR detects user locations and bookmarks, as well as system calls in predefined content. It is partially immersive and open.
|
Audience: for those who need to replace all reality and improve virtual reality for many purposes, such as games, marketing, etc. VR is an immersive sequence of animations, URLs, videos, audio. VR is fully immersive and closed
|
As for the audiences for which each one is focused, AR is for those who need to add virtuality to the real world and improve both the virtual and real world. AR detects user locations and bookmarks, as well as system calls in predefined content. It is partially immersive and open. While VR is for those who need to replace the whole reality and improve virtual reality for many purposes, such as games, marketing, etc. taking into account that VR is an immersive sequence of animations, URLs, videos, audio. VR is fully immersive and closed.
Examples of AR and VR Applications
Some examples of how organizations have adopted AR are:
- Development of translation applications. These applications interpret text, which is scanned, from one language to another.
- In the gaming industry, to develop real-time 3D graphics.
- Analysis and recognition of an item or text. Example: With image capture using Google Lens, the app will start analyzing the image and recognize what it is about. Once done, it will offer you actions to perform related to the type of item or text.
- In advertising and printing, AR is used to display digital content at the top of magazines.
- In design, as we mentioned in the IKEA Place example, AR provides a virtual preview of decoration options before making a purchase. Another example is YouCam Makeup, a free application that allows you to design and create makeup styles, hairstyles, face and body touch-ups with filters, dyes, eyelashes, among others.
VR has gained momentum in several industries, such as:
- The Armed Forces using virtual reality technology to train their soldiers by showing flight and battlefield simulations.
- Medical students learning better with 3D scanning of each organ or the entire body with the help of VR technology.
- Virtual reality being also used to treat post-traumatic stress, phobias, or anxiety by making patients understand the real cause of their illness and in other healthcare settings.
- Professionals using virtual reality to measure an athlete’s performance and analyze techniques with the digital training device.
- Virtual reality-based devices (Oculus Rift, HTC Vive, google cartoon, etc.) helping users imagine an environment that doesn’t exactly exist, such as an immersive experience in the world of dinosaurs.
- From manufacturing and packaging to interior design, companies can use virtual reality to give customers a demo of the product and a better understanding of what goes into making it. An example is Lowe’s Holoroom, where customers can select home décor items, appliances, cabinets, and room designs to see the end result.
- This approach can also be implemented to engage both customers and employees, driving inspiration, collaboration, and interactions. For example, in personal banking, some benefits or rewards can be offered to loyal customers.
- In the specific experience of a particular product, VR makes it possible to highlight its most exclusive features and at the same time provide the opportunity to experience its use. Vehicle manufacturer Volvo used virtual reality technology implementation to help customers who did not have easy access to their dealerships to test their cars. This experience was provided through the use of the Google Cardboard VR headset.
Using AR on Mobile Devices
At first, it seemed that AR would be intended only for military applications or games, but today we see that they play an important role in innovation in the mobile market, allowing users of smartphones and tablets to interact virtually with their environment thanks to greater bandwidth and better connectivity. In the words of Mark Donovan, analyst at ComScore, “…The idea that a mobile device knows where I am and can access, manipulate, and overlay that information on real images that are right in front of me really gets my sci-fi juices flowing…This is just getting started and will probably be one of the most interesting mobile trends in years to come.”.
A major factor in the mobile market is GPS and location-based technologies, which allow users to track and find friends while traveling or “check in” at particular locations. That information is stored and shared with others through the internet cloud and can be used so that marketers can use it to publicize special promotions or discounts, or a city promoting its hotspots could embed facts on the screen and about the neighborhood and the people who lived there. Other visitors may leave virtual comments about the tour. In education, biology students, for example, could use an augmented reality app and a smartphone to gain additional insight into what they see while dissecting a frog.
The way smartphones are driving AR usage, Qualcomm recently showcased augmented reality technology on its devices. Qualcomm’s Snapdragon processors and a new Android smartphone software development kit have been designed to provide the necessary foundation in building and using augmented reality technology in mobile phones. With toy maker Mattel, they collaborated on the virtual update of a classic game called Rock ‘Em Sock ‘Em Robots. Using Qualcomm technology and the smartphone’s built-in camera, players could see virtual robots superimposed on their smartphone screens. The robots appeared in the ring, which was a piece of paper printed with the static image of the ring and its strings. Players used the buttons on their phones to throw punches and their robots moved around the ring while players physically surrounded the table where the image of the ring was placed. The company also sees the potential in marketing, as an example it mentions the insertion of animated coupons on top of real images of its products in stores, so that, when consumers pass by a cereal box, for example, in the supermarket and look at their phone screen, they can get an instant discount.
Now, what is needed for AR on mobile devices? You need a real image capture device, software that is simultaneously transcribing this information and the virtual elements that are going to transform that reality. There are also different types of augmented reality: the one that is transcribed through a geolocation and the one that is based on markers:
- AR Projection: Artificial light is projected onto real-world surfaces. Augmented reality applications can also detect the tactile interaction of this projected light. This way, user interaction is detected by an altered projection on the expected projection.
- Overlay of the AR: Before the overlay, the application must recognize which element it has to replace. Once achieved, an object is partially or totally superimposed.
- AR Markers: Using a camera or a visual marker (a QR, for example), a marker is distinguished from any other real-world object. This way, information is superimposed on the marker.
- Geolocation of AR: It is based on the geolocation emitted by the smartphone through GPS to know its position and location.
- Devices for AR: In AR it is necessary to have sensors and cameras. The projector, usually a very small one, allows you to project reality in any space without using a mobile phone or tablet to interact. Glasses or mirrors also use augmented reality.
There are also 2 types of sensors:
- Sensors used for Tracking: They are responsible for knowing the position of the real world, users and any device in the solution. That way it is possible to achieve that synchronization or registration between the real and virtual world that we discussed when giving the definition of augmented reality. In turn, these sensors are classified into:
- Camera (computer vision): Perhaps one of the most important technologies. There are also the ‘fiducial markers’, that is, marks in the environment that allow the vision system and the solution as a whole, not only to be aware of what is there and what its performance is like, but also to place it spatially.
- Positioning (GPS): A technology not very specific to augmented reality but also sometimes used for spatial positioning.
- Gyroscopes, accelerometers, compasses and others: Which allow you to appreciate the orientation (gyroscopes), direction (compasses) and acceleration (accelerometers). Most of these sensors are already incorporated, for example, in mobiles and tablets.
- Sensors to collect information from the environment: Humidity, temperature and other atmospheric information. Another type of possible information is pH, electrical voltage, radio frequency, etc.
- Sensors to collect user input: These are fairly common devices such as buttons, touch screens, keyboards, etc.
Cinematic Influences on Public Perception of VR and AR
Undoubtedly, cinema has been one of the factors that have influenced the perception of Virtual Reality and Augmented Reality. As an example, we have these well-known films where these technologies played a leading role:
- Iron Man: This film is a great example of how military forces can use technology in the field using information fed by a central computer.
- They Live: It is the story of a drifter who discovers a pair of glasses that allow him to see the reality of aliens taking over the Earth. The whole concept of putting on glasses to see what others can’t is the big idea behind AR.
- Minority Report: Futuristic sci-fi film set in 2054, filled with AR technology from start to finish. From the computer interface that appears in the air to the interaction with a 3D computerized board and the ads that offer what the user would like to have.
- Avatar: The main character, Jake Sulley, is on a huge AR device that allows his host to experience a completely different level of sensory perception.
- Robocop: Detroit officer Alex Murphy becomes Robocop. His helmet is connected to the most advanced augmented reality technology that allows him to continue fulfilling his role as a police officer, albeit at a more impressive level.
- Wall-e: futuristic 3D animated film. This film somehow made a subtle statement that AR technology is not just for law enforcement use.
- Top Gun: The HUDs found in the cockpits of the F-14 Tomcats used in the film are the real reason they are called HUDs. These things allowed pilots to keep their heads up in the heat of the action and not look at their instrument panels.
- Tron/Tron: Legacy: Legacy – These two films delve into what could happen if you were unexpectedly thrown into a video game. Although for many passionate gamers it may seem like a dream come true, the movies quickly prove that it is not without its drawbacks.
- Virtuosity: This film poses what could happen if a virtual reality character were placed in our reality. There is a virtual reality simulation built by combining the characters of multiple serial killers that makes its way into reality.
- Matrix: It examines a world dominated by human-created machines, combining action sequences with innovative special effects. Unlike Skynet in the Terminator trilogy, which aimed to annihilate humanity, the artificial intelligence in Matrix has discovered a more useful purpose for our species: energy. Machines do this by absorbing energy from bodies while keeping people entertained in a virtual reality realm known as Matrix.
- Gamer: In the film, users control death row convicts in real life in the Internet Slayers game. Gerard Butler plays one of these convicts and, in order to get released, he must survive the game with the help of the person who controls it. It is an intense and visceral experience that explores the border between virtual and genuine violence.
- Ender’s game: It portrays a society where children are educated to be military soldiers through virtual reality simulations. It’s a depressing concept countered with vivid and extremely beautiful images, particularly in the recreated landscapes.
- Ready Player One: It chronicles how virtual reality has changed cultural conventions thanks to a new technology called Oasis. Although it started as a video game platform, Oasis has expanded into a way of life. People work in the Oasis, children go to school there, and companies try to monetize every square inch of the Oasis. In the game, the winner receives Halliday’s enormous riches, as well as ownership of the Oasis.
In addition to representing the use of AR and VR, the films also raise aspects of ethics and governance as in all emerging technology.
Technological and Business Challenges
AR and VR are technologies that will be increasingly present in people’s daily lives and in the work of companies. Of course, there are challenges that organizations should consider when adopting them:
- Excessive Expectations: It is often speculated that it is possible to execute in virtual environments absolutely all the actions that can be actually performed. It is important to carry out all the necessary procedures so that there is consistency between the virtual and the real world.
- Specific development: Considering that the development of skills in specific fields and in regards to the needs of each organization must be carried out, with defined results from its design in the business model and where a positive impact is generated for the organization.
- Limited resources: Understanding the current limitations in the development of better apps and learning items with AR and VR, from the necessary equipment, software and hardware, and the human talent that can develop and support the applications.
- Technological gap: Reducing the educational-digital gap between institutions, regions and social sectors with access to AR and VR technology and those that do not yet have the same opportunities or technological capabilities.
- Learning Curve: From the first business model where it is planned to integrate AR and VR and the organizational culture that allows the consistent and continuous development of these technologies.
- Transdisciplinary aspects: AR and VR involve transdisciplinary aspects from different knowledge and business areas: information technologies, marketing, sales, operations, human resources, etc.
- Accelerated change: Technology is very agile and the change of electronic devices that give life to this type of tools is updated at an accelerated speed, which triggers challenges in investments in technologies that support it and in the human talent that knows these technologies and that can implement them.
Another important aspect in the reality of many countries is that bandwidth and low latency requirements for these technologies that take up multimedia resources are at an insufficient level, in addition to the fact that current networks often cannot support high-quality AR and VR transmissions, perform high-speed data transmission, stable connection that gets rid of fluctuations and offers a seamless experience.
Future of Augmented and Virtual Reality
While AR and VR remain emerging technologies, faster, lighter and more affordable technology is envisioned in the future. On the one hand, advances in smartphone technology (with better cameras and processors) will mean that you can enjoy more innovative AR and VR experiences. The advancement in 5G wireless networks will also make it possible to enjoy these technologies from anywhere in the world.
Although this high technology is associated with science fiction and the gaming industry, Virtual Reality has the potential to revolutionize several industries, especially when looking for innovative ways to increase their productivity, improve processes and, as remoteness gains ground, the possibilities of virtual reality help achieve goals.
For VR, the development of more powerful processors such as Meta’s Oculus Quest and Apple’s 8KVR/AR headset is anticipated. As devices become more robust in functionality and lighter in use, the adoption of this technology will play an important role in creating more immersive and intuitive experiences in all fields.
We can also mention some predictions and budding improvements:
- LiDAR will bring more realistic AR creations to our phones. iPhone 12 and iPad Pro are now equipped with LiDAR LiDAR (Light Detection and Ranging) technology is essentially used to create a 3D map of the environment, which can seriously improve the AR capabilities of a device. In addition, it provides a sense of depth to AR creations, rather than a flat graphic.
- VR headsets will be smaller, lighter and incorporate more features. Hand detection and eye tracking are two prominent examples of the technology built into virtual reality headsets. Because hand detection allows VR users to control movements without clunky controllers, users can be more expressive in VR and connect with their VR game or experience on a deeper level. And the inclusion of eye-tracking technology allows the system to focus the best resolution and image quality only on the parts of the image the user is looking at (exactly as the human eye does). Delay and risk of nausea are reduced.
- There will be new XR accessories to further deepen the experience. The startup Ekto VR has created robotic boots that provide the sensation of walking, to adapt to the movement in the headphones, even if you are actually standing. The rotating discs at the bottom of the boots move to match the direction of the user’s movements. In the future, accessories like this may be considered a normal part of the virtual reality experience.
- We’ll even have full-body haptic suits. There are already haptic gloves that simulate the sensation of touch through vibrations. The full-body suit is proposed as the TESLASUIT, which today are not affordable for most virtual reality users. Over time they could reduce their cost which in turn will increase their adoption.
According to companies surveyed by PWC in 2022, VR learners absorb knowledge four times faster than learners in the classroom and are 275% more confident when it comes to applying the skills they learned during training in the real world.
In the workplace, remote work is more popular than ever, but there are still aspects of face-to-face interactions that are difficult to replicate. As a result, mixed reality collaborative work tools will increasingly leverage virtual reality and augmented reality to capture and express the more subtle aspects of interaction that are not translated into video calls.
In commerce, virtual reality and augmented reality will more often become part of the marketing and sales process. Brands will invest in creating virtual environments where they can interact with shoppers to help them solve their problems, encouraging them to make the leap from being customers to being loyal followers.
In health, from using AR to improve liver cancer therapy to creating surgery simulations in virtual reality, healthcare systems are using these technologies in a variety of applications. The development continues, due mostly to the growing demand driven by more connectivity, costs in devices that will be reduced and the need to reduce costs and risks in interventions.
According to Forbes, global investments in augmented reality are estimated to grow from $62.75 billion in 2023 to $1,109.71 billion by 2030, at a CAGR of 50.7%. For virtual reality, Forbes estimated that global investments in virtual reality (VR) reached $59.96 billion in 2022 and are expected to grow at a compound annual growth rate (CAGR) of 27.5% from 2023 to 2030. Undoubtedly, double-digit growth makes it clear that organizations must consider how to address these emerging technologies to achieve business results.
Conclusion
AR and VR are technologies that should be reviewed in the Digital Transformation strategy of organizations, for the advantages they represent, from the display for customers of outstanding product characteristics, the feasibility of a project or design; practical guides on the use of products, demonstrations, advertising or promotions; the training and development of staff skills on new equipment or security protocols through VR motivating interactive learning; the holding of virtual meetings or events that simulate the true presence of customers and colleagues; virtual visits to facilities, shops, educational institutions, museums, etc.; up to the best customer service, with a better approach saving time and resources.
Of course, the use of augmented reality and virtual reality depends on the internal capabilities, budget and objectives of the organization. Although there are already many applications on the market that use augmented reality, the technology has not yet become widespread; however, as devices, processors and software add more power and sophistication, the level of information that can be added will increase. AR and VR can help improve decision-making ability, communication, and understanding by experiencing a scenario that is artificial but looks and feels natural. As we have seen throughout this article, AR and VR have many applications in the entertainment, military, engineering, medical, industrial, and other industries. It is recommended, for best results, to combine both technologies by doing an analysis of each use case on adaptability, productivity, time to market, return on investment and expected results. It is also recommended to approach an information technology partner who has the expertise in your industry and understands your challenges.

by Olivia Díaz | Last updated Feb 23, 2024 | Pandora FMS
To understand what a Root Cause Analysis (RCA) is, we must start from the fact that a root cause is a factor that causes a non-conformance and must be deleted through process improvement. The root cause is the central issue and the highest-level cause that sets in motion the entire cause-and-effect reaction that ultimately leads to the problem.
Situaciones que requieren análisis de raíz
Understanding this, the Root Cause Analysis (Real Cause Analysis or RCA) describes a wide range of approaches, tools, and techniques used to uncover the causes of any issues. RCA approaches may be geared towards identifying true root causes, some are general problem-solving techniques, and others offer support for the core activity of root cause analysis. Some examples of common situations where root cause analysis can help solve problems:
- Manufacturing: A computer parts manufacturer identified that its products were failing in no time because of a design flaw in one of the microchips. After performing an RCA, a new chip was developed getting rid of the flaw.
- Safety: After a patient suffered an unfortunate fall while inside a hospital facility, RCA found that they were not wearing non-slip socks. This led to policy changes including non-slip socks to ensure that all patients have this new additional safety measure.
- Software development: Following complaints from customers about software that unexpectedly failed during use, an RCA was carried out, making it clear that there were design errors that caused the failures. The company applied new testing processes before launching any products, improving customer satisfaction.
- Construction: The RCA performed for the delay in the completion of a project revealed that critical components had been delivered late, which led to the definition of stricter procurement processes to ensure timely delivery.
- Commerce: In one retail store, shelves were found to be frequently empty. Performing an RCA found out that the store’s ordering process was inadequate, leading to order delays. A decision was made for the store to implement a new ordering process to avoid delays and keep the shelves fully stocked.
- Food: A restaurant was experiencing frequent food safety issues. RCA found that employees were not trained in food safety procedures. The restaurant implemented additional training and supervision to ensure compliance with food safety regulations and prevent future issues.
The most common approaches to root cause analysis include 5W, herringbone diagrams, fault tree analysis (FTA), root cause mapping, and Pareto analysis. Later we will look at each of these approaches:
What is Root Analysis?
According to Techopedia, root cause analysis (RCA) is a problem-solving method used to identify the exact cause of a problem or event. The root cause is the actual cause of a specific problem or set of problems. Eliminating the cause prevents the final undesirable effect from occurring. This definition makes it clear that RCA is a reactive method, as opposed to preventive, since it will be applied only after a problem has occurred to look for its cause and prevent it from happening again.
The importance of RCA to address the underlying causes lies in the fact that it is an analysis based on processes and procedures, which help guide the problem analyst or decision maker to discover and understand the real causes of the problems and, therefore, reach a practical solution that prevents the recurrence of said problem.
Root Analysis Objectives and Benefits
RCA aims to identify the original source of a problem to prevent it from happening again. By addressing the root cause, it is also possible to implement appropriate preventive actions and measures. Even when the RCA approach is based on a reaction (the cause is analyzed from a problem that has already arisen), there are important benefits:
- Cause Discovery and More Immediate Reaction: RCA allows you to intervene quickly to fix a problem and prevent it from causing widespread damage. The decision-making process should also be improved and be more timely.
- Understanding for Effective Solutions: RCA details why a problem took place and helps understand the steps involved in the issue. The more details you get about the issue, the easier it is to understand and communicate why the issue took place and work as a team to develop solutions.
- Applying Learning to Prevent Future Problems: By performing an RCA and taking the necessary steps to prevent problems from reoccurring, it is also possible to develop a mindset focused on finding problems more proactively.
Essential Principles of Root Analysis
To implement an RCA, its essential principles must be considered to ensure the quality of the analysis and, most importantly, to generate trust and acceptance of the analyst by stakeholders (suppliers, customers, business partners, patients, etc.) to undertake specific actions to get rid of and prevent problems. The principles underlying RCA are the following:
- Focus on correcting causes, not just symptoms: The main focus is to correct and remedy root causes rather than just symptoms.
- Importance of treating short-term symptoms: It avoids ignoring the importance of treating the symptoms of a problem to achieve short-term relief.
- Recognition of the possibility of multiple causes: For the same problem, take into account that there could be multiple root causes.
- Focus on “how” and “why”, not on “who”: Focus on how and why a problem happened, not on looking for liability.
- Methodicity and search for specific evidence: To carry out an RCA you must be methodical and find specific evidence of cause and effect to support root cause claims.
It is also recommended to provide enough information to define a corrective course of action and look for how this information also contributes to the prevention of a future problem.
Finally, a comprehensive and contextualized approach is always recommended, considering that interdependent systems may be involved in a problem.
How to Perform an Effective Root Analysis: Techniques and Methods
To perform an RCA, there are four essential steps:
- Identify the issue/event: It is crucial to identify the issue or event at hand and engage all relevant stakeholders to clearly understand the scope and its impact.
- Collect data: It includes reviewing documentation, interviewing those involved in the situation, observing processes, and analyzing available information in order to develop a comprehensive view of the problem or event.
- Identifying root cause(s): Here several tools, such as the 5W methodology, herringbone diagrams, change analysis, and Pareto analysis, are used to analyze the data collected before devising solutions that address each identified factor. This could include process changes/upgrades, staff training or the introduction of new technologies.
- Developing and implementing solutions: Monitoring the effectiveness of the strategies chosen over time, being able to adjust them when necessary in the event that similar problems arise again later.
-
The 5W?
It is the first and most popular RCA technique. This method involves asking “why” five times until the underlying cause of a problem is revealed. Detailed answers are found to the questions that arise. The answers become increasingly clear and concise. The last “why” should lead to the failed process. Example: If a manufacturing company has many defaults in its products, then by using a 5W analysis, it could be determined that no budget has been allocated because management did not.
-
Analysis of changes/analysis of events
Consists of analyzing the changes that lead to an event for a longer period of time and a historical context is obtained. This method is recommended when working with several potential causes. This means:
- Making a list of all the potential causes that led to an event and for each time a change took place.
- Each change or event is classified according to its influence or impact (internal or external, caused or unprovoked).
- Each event is reviewed and it is decided if it was an unrelated, correlated, contributing or probable root cause factor. Here you may use other techniques such as the 5W?
- It is observed how the root cause can be replicated or remedied.
-
Fishbone Diagram (Ishikawa)
These can identify root causes by breaking them down into categories or sub-causes. For example, in cases where customer satisfaction in restaurants is low due to service quality, food quality, environment, location, etc. are taken into account. These sub-branches are subsequently used to analyze the main reason for customer dissatisfaction. Example:
As it can be seen, the diagram encourages brainstorming by following branching paths, which resemble the skeleton of a fish, until the possible causes are seen and it is visually clear how the solution would alter the scenario. To build the Ishikawa Diagram, the fundamental problem is placed at the head. After posing the fundamental problem, the spines of the fish are traced. The spine will be the link between the cause categories and the root problem. The common categories for this diagram are:
- People involved in the process.
- Method or how the work was designed.
- Machines and equipment used in the process.
- Materials and raw materials used.
- Environment or causal factors.
In the spines, attached to the spine, the categories or groups of cause are included. More spines (subcauses) can also be attached to the upper level spines, and so on. This causes the cause-effect relationship to be visualized.
-
Which is a technique that can help select the best solution for a problem when there are many potential solutions, especially when available resources are limited. Pareto analysis is derived from the 80/20 rule, which states that 80% of the results of an event are the product of 20% of contributions. This technique allows users to set aside a number of input factors that are likely to make the greatest impact on the effect or outcome. So, if the result is positive, individuals or companies decide to continue with the factors. On the other hand, users remove those factors from their action plan if the effect appears to be negative.
Tips for Effective Root Analysis
To implement an RCA, the first step is to determine a single problem to be discussed and evaluated. From there, follow these steps for an effective RCA:
- Establish problem statement: By asking key questions, such as what is wrong, what are the symptoms?
- Understand the problem: Relying on flowcharts, spider diagrams or a performance matrix, working as a team and accepting diverse perspectives.
- Draw a mental map of the cause of the problem: To organize ideas or analysis.
- Collect data on the problem: Relying on checklists, sampling, etc.
- Analyze data: Using histograms, Pareto charts, scatter plots, or affinity diagrams.
- Identify the root cause: Through a cause and effect diagram (such as herringbone diagrams), the five whys or event analysis.
- Define deadlines and solve the root cause.
- Implement a solution.
Planning for future root cause analyses is recommended, keeping processes in mind, constantly taking notes and identifying whether a given technique or method works best for the needs of the organization and specific business environments.
It is also recommended to do a root analysis in successful cases. RCA is a valuable tool to also find the cause of a successful result, the surpassing of initially set objectives or the early delivery of a product and later be able to replicate the formula for success. So RCA also helps to proactively prioritize and protect key factors.
As a last step, it is recommended to monitor the solution, to detect if the solution has worked or if adjustments need to be made.
Conclusions
Without a doubt, RCA is a valuable tool to identify the original source of a problem that can be critical for the organization and react quickly and effectively, as well as preventing the same problem from arising again. Beyond a reactive approach, RCA can help organizations implement preventive actions and measures, and can even map success (root analysis in success stories) to be able to replicate in the future the same key factors that have led to customer satisfaction, the achievement of adequate quality levels or the timely delivery of a product.
Something also very important is that RCA allows to improve communication within the organization, detailing why a problem arose and what steps to take to solve it objectively. The more details you have of the context, the higher the possibility to engage the right people with clear courses of action, with informed and well-informed decisions.
Of course, there are several root cause analysis tools to evaluate data, each evaluates the information with a different perspective. Also, to understand a problem, you have to accept different points of view and work as a team to achieve the benefits of RCA.

by Ahinóam Rodríguez | Last updated Jan 29, 2025 | Remote Control
In this article, we will thoroughly address RMM Software (Remote Monitoring and Management Software) and its essential role for Managed Service Providers (MSPs). We will explain the core functions of RMM, from remote monitoring to efficient management of client devices, highlighting its key advantages such as reducing labor costs and improving productivity. We will analyze the strategic integration of RMM and PSA (Professional Services Automation) to empower MSP workflows and offer a vision of the future, supported by promising statistics. We conclude by highlighting the continued importance of RMM in the technology landscape and encouraging MSPs to consider its implementation to optimize efficiency and success in the delivery of managed services.
What is RMM software?
In the past, all businesses, regardless of size, used on-premise IT infrastructures. When a problem arose, they contacted their service provider and a technical team went to the offices to solve it. However, the landscape changed completely with the development of Cloud technology. The possibility of accessing data and computing resources from anywhere was gradually reducing the dependence on centralized IT infrastructures. The definitive leap occurred with the arrival of remote work and hybrid work. Organizations that go for a flexible working framework have their systems distributed in widely diverse locations, often outside the traditional corporate network.
On the other hand, each department within the company has specific technological needs that are quickly adapting to market changes. Managing all these applications manually would be very complex, expensive and could lead to human errors that put security at risk.
It is clear that to address these challenges new tools had to emerge such as the RMM (Remote Monitoring and Management) software that allows companies to maintain effective control of all their IT assets, even in distributed environments.
How does RMM software contribute to the digital transformation of companies?
As we just mentioned, RMM software has become a key piece to ensure the transition to decentralized and dynamic infrastructure environments, without neglecting the essential aspects.
Thanks to this technology, IT professionals can remotely monitor and manage a company’s entire infrastructure monitor the performance of IoT devices connected to the network in real time, identify possible threats or anomalous activities and apply corrective measures.
Although remote management tools emerged in the 1990s, they initially had limited features and were difficult to implement.
The first RMMs offered basic supervision and were installed on each computer individually. The central system then analyzed the data and created reports or alerts on critical events.
Instead, today’s RMM software takes a more holistic approach and enables unified and comprehensive management of the company’s technology infrastructure by retrieving information from the whole IT environment rather than from each device in isolation. In addition, it supports on-premise and cloud installations.
Finally, another key contribution of RMM tools for digitization is to switch from a reactive maintenance model to a preventive maintenance model. Remote access solutions allow technical teams to proactively monitor software processes, operating systems, and network threads, and address potential issues before they become critical situations.
A key tool for MSPs
A Managed Service Provider (MSP) is a company that provides management and technology support services to other companies, from server administration, to network configuration, to cloud asset management.
As organizations grow, they store more data, and cyber threats are also on the rise. Many SMEs decide to hire the services of an MSP provider to take charge of their infrastructures, especially if they do not have an internal IT department that optimizes the security and performance of their systems.
MSPs use different technologies to distribute their services and one of the most important is RMM software, which allows them to proactively monitor their customers’ networks and equipment and solve any issues remotely without having to go to the offices in person.
According to data from the Transparency Market Research portal, the market for this type of software has not stopped growing in recent years and this growth is expected to remain constant at least until 2030, driven by the demand for MSPs.
How do RMM tools for remote monitoring work?
RMM tools work thanks to an agent that is installed on the company’s workstations, servers and devices. Once installed, it runs in the background and gathers information about the performance and security of systems.
The RMM agent continuously monitors network activity (CPU usage, memory, disk space, etc.) and if it detects any anomalies, it automatically generates a ticket with detailed information about the problem and sends it to the MSP provider. Tickets are organized in a panel according to their priority and their status can be changed once they have been solved or escalated to a higher level in the most complex cases.
In addition, RMM tools create periodic reports on the overall health of systems. These reports can be analyzed by technical teams to reinforce network stability.
How does RMM software help improve the operational efficiency of MSPs?
RMM software has a number of practical utilities that MSPs can leverage to raise the quality of their services:
- Remote monitoring and management
It monitors equipment performance in real time and allows to solve problems remotely without having to go physically to the place where the incident took place. This saves time and costs associated with transportation.
Another advantage of implementing RMM tools is the possibility of hiring the best professionals regardless of their location and covering different time zones offering 24/7 support.
- Full visibility of IT infrastructure
Thanks to RMM software, technical teams can keep track of all their customers’ IT assets from a single dashboard. For example, they can make an inventory of all devices and cloud services that are active, or check in a single dashboard view the tickets that are open and those that are pending resolution.
- Automating repetitive tasks
RMM tools create automated workflows for routine tasks such as: installing/ uninstalling software, transferring files, running scripts, managing patches and updates, or backing up. This reduces the workload of IT teams and minimizes the risk of human error.
- Increased security
RMM agents send alerts in real time if a critical event takes place. That way, network administrators can very quickly identify security threats or problems that affect computer performance.
Proactive monitoring is critical for MSP providers to ensure a stable and secure IT environment for their customers. In addition, it reduces the costs associated with equipment repair and data recovery.
- Reduce downtime
The installation of new programs, updates and corrective measures runs in the background without interfering with user activity. This makes compliance with Service Level Agreements (SLAs) easier by solving problems as soon as possible without any prolonged service interruptions.
What aspects should MSPs consider when choosing RMM software?
It is important to choose a stable, safe and easily scalable solution that meets customer needs. In addition, the chosen RMM software is ideally integrated easily with other tools for more efficient and complete management.
Let’s look at some basic requirements!
- Easy implementation
RMM tools should be intuitive to reduce commissioning time and costs.
- Flexibility
As companies grow, so does their IT infrastructure. For MSPs, a higher volume of customers means increased monitoring capacity. That’s why it’s important to choose a tool that’s flexible and scalable. That way, it will be possible to add new devices and users without technical limitations.
- Stability
It verifies that RMM software is stable. Some solutions provide remote access through third-party software and this can affect connection performance as each tool has its own features and data transfer speed. Therefore, it is best to select a platform that offers integrated remote access to optimize responsiveness and avoid interruptions.
- Device compatibility
The tool should be prepared to monitor the activity of a wide variety of devices and computer systems that support SNMP protocols. This includes, but is not limited to, servers, routers, switches, printers, IP cameras, etc.
- Seamless integration with PSA tools
The integration of RMM and PSA improves the workflow of MSPs.
PSA tools automate and manage tasks related to the provision of professional services such as invoicing, ticket management, time registration, etc.
For example, issues detected during remote monitoring can automatically generate tickets in the PSA system for technicians to review the device’s incident history and keep track.
Time spent applying corrective action can also be automatically recorded by PSAs, allowing for more accurate billing.
- Security
Make sure that the RMM software you plan to purchase is properly licensed and meets security standards. It should provide features such as data encryption, multi-factor authentication, system access via VPN, or blocking inactive accounts.
- Support
Finally, before deciding on an RMM solution, check that the vendor offers good post-implementation support. Check the references and opinions of other customers to know the quality of the service and make sure that you are making a good investment.
Conclusion
SMBs are increasingly digitized and rely on a wide variety of software to run their day-to-day operations. As enterprises migrate their infrastructures to the cloud, MSP providers need remote access solutions to end-to-end management of their customers’ assets.
There are different RMM tools that allow you to monitor the performance of your systems in real time and perform support and maintenance actions. One of the most complete ones is Pandora FMS Command Center, a specific version of the Pandora FMS platform for monitoring MSP and which has been designed to work in IT environments with a high volume of devices. It is a secure and scalable solution that helps managed service providers reduce workload and expand their customer base.
In addition, it has a specific training plan for IT teams to get the most out of all the advanced features of the software.
Many companies that work with Pandora FMS Command Center have already managed to reduce their operating costs between 40% and 70% thanks to task automation and reduced incidents.
It’s time to increase your business productivity and offer your customers exceptional service. Contact our sales team to request a quote or answer your questions about our tool.

by Pandora FMS team | Dec 28, 2023 | Pandora FMS
On this exciting journey, we celebrate the successes of our team over the course of an incredibly productive year. From solving 2677 development tickets and 2011 support tickets to spending 5680 hours on projects and operations, each metric represents our shared dedication and success with our valued customers, which are the engine of our growth.
We reinforced our commitment to security by becoming an official CNA in collaboration with INCIBE (National Cybersecurity Institute of Spain). This prestigious achievement placed Pandora FMS, Pandora ITSM and Pandora RC as the 200th CNA worldwide and the third CNA in Spain. Our recognition as CNA (Common Vulnerabilities and Exposures Numbering Authority) means that Pandora FMS is now part of a select group of organizations that coordinate and manage the assignment of CVE (Common Vulnerabilities and Exposures), uniquely identifying security issues and collaborating on their resolution.
During this year, we experienced an exciting brand unification. What started as Artica at Pandora FMS has evolved into a single name: Pandora FMS. This transition reflects our consolidation as a single entity, reinforcing our commitment to excellence and simplifying our identity.
Globally, we excelled at key events, from Riyadh’s Blackhat to Madrid Tech Show. In addition, we expanded into new markets, conquering China, Cameroon, Ivory Coast, Nicaragua and Saudi Arabia.
We evolved eHorus into Pandora RC and transformed Integria into Pandora ITSM, strengthening our presence in the market. We launched a new online course platform and developed a multi-version documentation system in four languages.
We proudly highlighted the technological milestone of the year: the creation of the MADE system (Monitoring Anomaly Detection Engine), the result of our collaboration with the Carlos III University of Madrid. Presented at the ASLAN 2023 Congress & Expo in Madrid, MADE uses Artificial Intelligence to monitor extensive amounts of data, automatically adapting to each management environment. This innovation sets a radical change in monitoring by getting rid of the need for manual rule configuration, allowing the adaptation to data dynamics to be fully autonomous.
This year was not only technical, but also personal. From the fewest face-to-face office hours in 17 years to small personal anecdotes, every detail counts.
Let’s celebrate together the extraordinary effort and dedication of the whole team in this new stage as Pandora FMS! Congratulations on an exceptional year, full of success in every step we took!