Security Monitoring
Introduction
Pandora FMS can be used to monitor the status of security infrastructures such as backup environments, antivirus, VPN, firewalls, IDS/IPS, SIEM, honeypots, authentication systems, storage systems, log collection, etc. In addition, Pandora FMS incorporates internal tools to increase its own security such as doble authentication (2FA), encryption in the database data for passwords, external authentication, protocol Tentacle using data encryption (SSL/TLS ), own audit log and other features to make the platform more secure. Pandora FMS, as an organization, has 27001 certification, and is CNA at Miter to manage its own CVEs. We have a public security policy and open to independent security auditors.
In addition to these functions, Pandora FMS incorporates its own specific security functionalities since version 773 and more features will be added in successive versions.
In version 774 Pandora FMS incorporates the following security features.
- Security monitoring plugin, to monitor basic system security, designed for GNU/Linux® servers only.
- Hardening evaluation system over time (GNU/Linux®, MS Windows®).
- System vulnerability assessment system (GNU/Linux®, MS Windows® and remote systems).
Security Monitoring Plugin
This plugin, which comes standard in GNU/Linux agents, is responsible for constantly verifying certain basic aspects of your environment. It is designed to be lightweight, impact very little on system performance, and be released at the agent's standard interval of every five minutes. Check the following aspects of the system:
- Strength of passwords for all users with access to the system. It does this through a “password dictionary”, by default composed of 100 entries. You can customize this dictionary and add your own entries (to reflect the typical common passwords used in your organization). 90% of common attacks have a poorly protected user account in a secondary environment as the attack vector.
- SELinux status, checking if it is active or present.
- Remote access as root user, verifying that password login is disabled for this user.
- Automatic remote access as root using previously configured and established SSH keys.
- TCP ports actively listening (that are outside a list of allowed port numbers).
- Modification of essential configuration files, verifying their integrity and whether they have changed (files such as
/etc/resolv.conf,/etc/hosts/,/etc /passwdand others).
They are very basic things but at the same time very important. Any system, be it a test environment, a virtual machine or a VPS on secondary hosting, is vulnerable to basic attacks, but these are usually 80% of those that open a more serious incident in the organization.
To install the security plugin, simply activate it in the GNU/Linux agent, it is included by default in versions 774 or later:
module_begin
module_plugin /etc/pandora/plugins/pandora_security_check
module_end
To install the plugin on previous versions of the agent, it can be downloaded from the Pandora FMS plugin library:
Hardening monitoring
The recommendations of the Center for Internet Security (CIS) have been merged with Pandora FMS monitoring technology to offer an integrated assurance audit system. This allows the evolution of hardening measures (security strengthening) to be tracked and evaluated over time in the environments used and monitored.
System hardening is a process used to improve the security of a computer system by reducing its attack surface and strengthening its defenses. It consists of making it more difficult for potential attackers to explore configuration errors, whether due to default configurations, bad configurations or improper configurations.
System hardening is an ongoing process as security threats and vulnerabilities evolve over time. It requires constant monitoring, risk assessments, and adjustments to security configurations to adapt to changing circumstances. Additionally, organizations often follow industry-specific standards and best practices, such as CIS controls or National Institute of Standards and Technology (NIST) guidelines, to ensure integral hardening system.
Pandora FMS uses several CIS categories to group the checks it performs.
CIS Categories Audited by Pandora FMS
We have taken the CIS recommendations a step further by implementing more than 1,500 individual checks across a variety of safety-critical categories.
Inventory and control of hardware and software assets: Monitor and manage all devices and software in your organization. Maintain an up-to-date inventory of your technology assets and use authentication to block unauthorized processes.
Device inventory and control: Identify and manage your hardware devices so that only authorized ones have access, blocking others. Maintaining proper inventory minimizes internal risks, organizes your environment, and provides clarity to your network.
Vulnerability Management: Analyze your assets continuously over time to detect potential vulnerabilities and fix them before they become the gateway to an attack. Strengthen network security by ensuring that software and operating systems in the organization are always up-to-date with the latest security measures and patches. Help manage your software to ensure that only authorized software is installed and running. Avoid vulnerabilities and risks by maintaining accurate inventory and managing your software.
Controlled use of administrative privileges: Closely monitor access controls and the behavior of users with privileged accounts to prevent any unauthorized access to critical systems. Ensure that only authorized people have the appropriate privileges to avoid any misuse of administrative privileges. Establish strict policies to prevent misuse of privileges.
Secure hardware and software configuration: Establish and maintain security configurations based on standards approved by your organization. Create a rigorous configuration management system that detects and alerts about any misconfigurations, and establishes a change control process to prevent attackers from exploiting vulnerable services and configurations.
Log and audit log maintenance, monitoring, and analysis: Collect, manage, and analyze event audit logs to identify potential anomalies. Maintain detailed logs to fully understand attacks and respond effectively to security incidents.
Malware Defenses: Monitor and control the installation and execution of malicious code at different points in your organization to prevent attacks. Configure and use anti-malware software and leverage automation to ensure fast defense updates and prompt corrective action in the event of attacks.
Email and Web Browser Protection: Protect and manage your web browsers and email systems from online threats to reduce your attack surface. Disable unauthorized email plugins and ensure that users only access trusted websites using web-based URL filters. Keep common entry doors safe from attacks.
Data recovery capabilities: Establish processes and tools to ensure your organization's critical information is properly backed up. Ensure you have a reliable data recovery system to restore information in the event of attacks that compromise critical data. Prepare your organization to deal with data loss effectively.
Boundary defense and data protection: Identify and separate sensitive data, and establish a series of processes that include encryption, data infiltration protection plans, and data loss prevention techniques. Establish strong barriers to prevent unauthorized access.
Monitoring and Account Control: Closely monitors the entire lifecycle of your systems and application accounts, from creation to deletion, usage and inactivity. This active management prevents attackers from exploiting legitimate but inactive user accounts for malicious purposes and allows you to maintain constant control over the accounts and their activities.
Detailed hardening audits of each machine
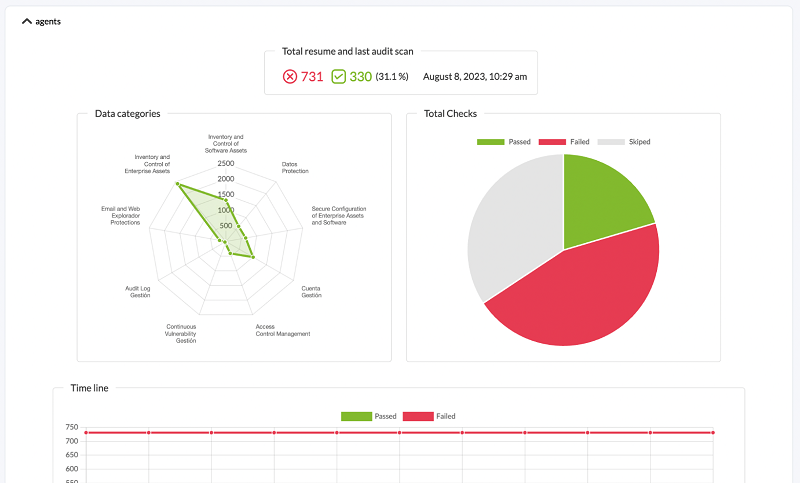
The checksare performed by the agent that runs on each machine. Usually an audit takes place every week, but that period can be set to a longer period, such as a month. That way you can take a snapshot of the security of the system, calculate and assign a security index (a numerical rating, defined as the percentage of checks carried out and approved versus checks that do not pass the tests) and see the evolution of that safety index over time.
Example of a “snapshot” of the hardening status of a system:
Example of the evolution of hardening of a system over time:
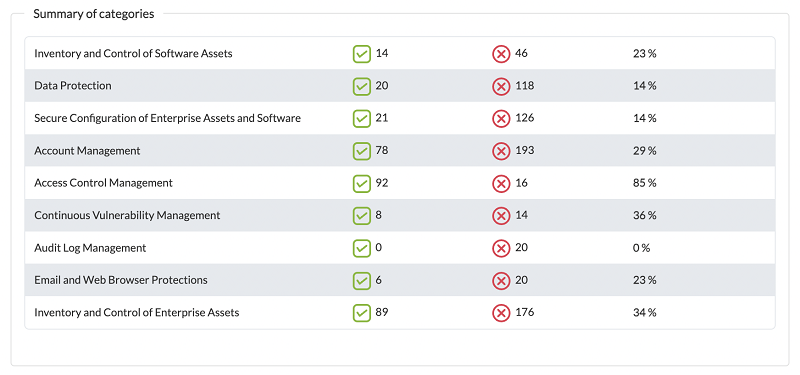
The system allows us to see, broken down by category, the checks that have been executed:
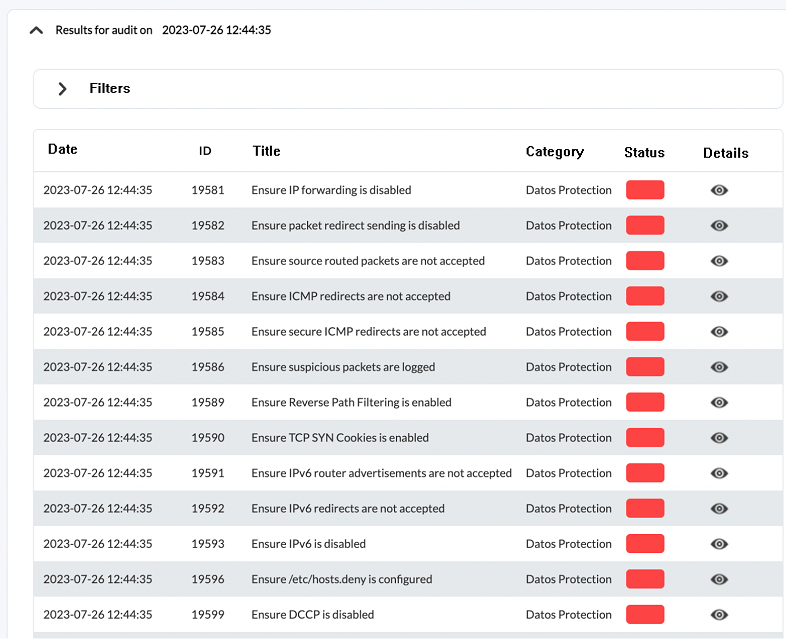
And for each group of elements, see the detail, to be able to work on its correction:
Hardening monitoring configuration
Controls have been developed, depending on each system if applicable, that will help determine if they are relevant for the environment to be monitored. Currently this feature is available for MS Windows® and GNU/Linux® servers. This feature is available with 773 agents or later. If the agents belong to a version prior to 773, they must be updated.
For that, activate the corresponding plugin in the agent configuration. It can be done manually or through monitoring policies on machine groups.
On MS Windows®:
module_begin
module_plugin "%PROGRAMFILES%\Pandora_Agent\util\pandora_hardening.exe -t 150"
module_absoluteinterval 7d
module_end
GNU/Linux®:
module_begin
module_plugin /usr/share/pandora_agent/plugins/pandora_hardening -t 150
module_absoluteinterval 7d
module_end
In these examples, the hardening audit will be executed every 7 days, with a timeout of 150 seconds for each command launched during the audit. You may increase this value to 30 days, but we do not recommend doing it every few days, as it will generate unnecessary inventory data.
Hardening data monitoring
In addition to the dashboard and specific views to be able to analyze this data in specific systems or at a global level, there are some modules generated by the hardening system that will allow the hardening evaluation data to be processed like other Pandora FMS data, to establish alerts, generate graphics or any other use that is needed. These modules are generated or updated automatically each time a hardening audit is run and belong to the Module group called Security.
- Hardening - Failed checks: It shows the total number of checks that did not pass the securing test.
- Hardening - Not applied checks: It shows the total number of checks that were not run because they do not apply (for example, checks for another version of your Linux distribution or Windows version, or because they look for a certain component that is not installed).
- Hardening - Passed checks: It shows the total number of checks that passed the securing test.
- Hardening - Score: It shows the percentage of checks that passed. A threshold can be set here to show when the system is in
WarningorCriticalstate regarding securing.
Hardening data display
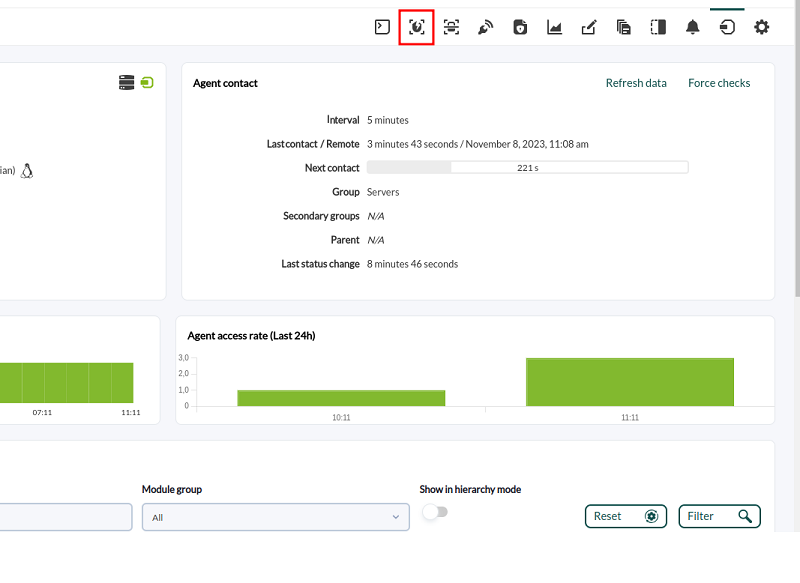
Once the agents run the hardening module for the first time, the information will arrive and you may see in the detail of each agent (Operation → Monitoring views → Agent detail → Agent main view) in the Agent Contact box three elements summarizing the security status (SecurityMon, hovering the pointer over it will show the number of security modules), the security percentage achieved (Hardening) and the vulnerability status (Vulnerability, hovering the pointer over it will show the score achieved): 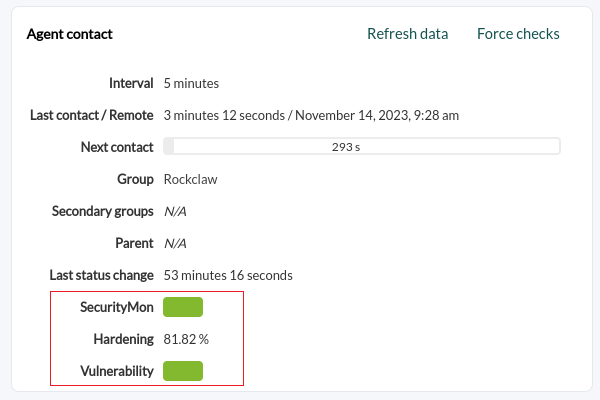
A specific section will also be enabled for the hardening of these agents:
In addition, you will be able to see a section in the operation menu called Security, where there is a ks2_1_42|specific dashboard for Hardening data where you may filter by groups, agents, CIS categories and other details.
Hardening reports
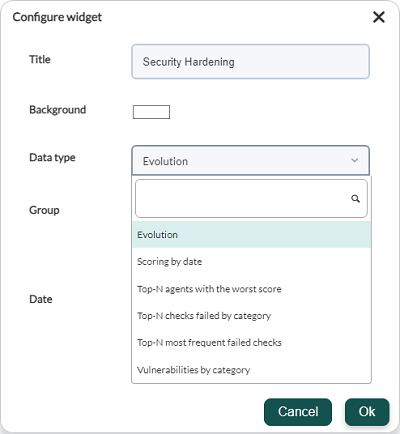
New report types have been created to display hardening information:
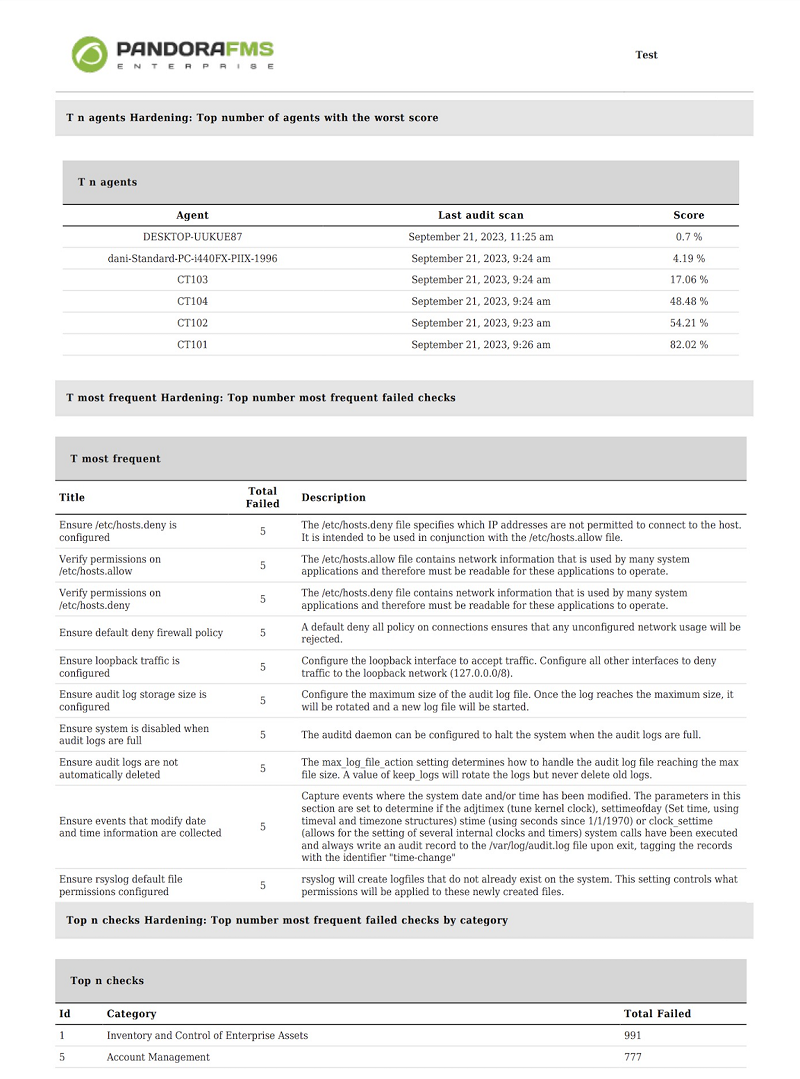
- Top N agents with the worst score. Filtered by groups.
- Top N of checkups that fail most frequently. Filtered by groups.
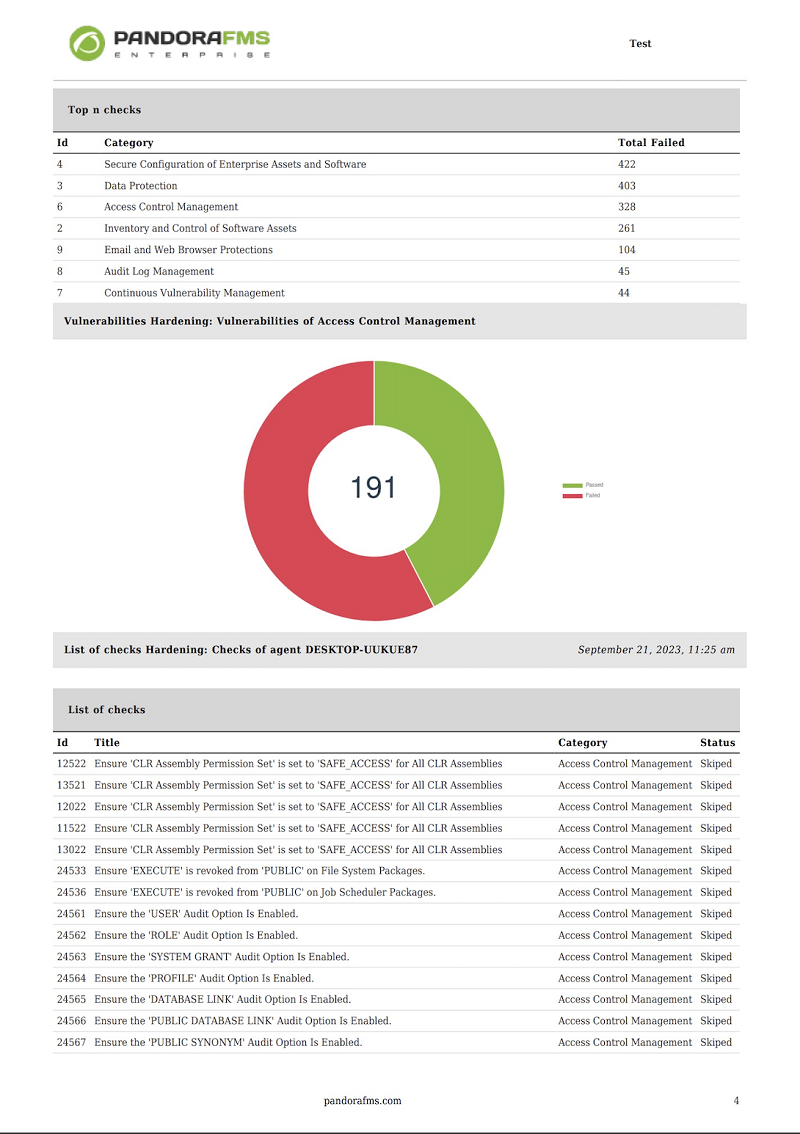
- Pie chart with Vulnerabilities by type. Choosing a CIS category, the fails, passed and skipped (optional) of all agents are grouped (or only the groupselected) by category.
- Top N of checks that fail by category, the latest data from all agents (or only the selected group) is grouped by hardening categories and the categories with the highest number of fails among all agents are listed.
- List of security checks is a technical and exhaustive report with all the details, the latest checks of an agent are listed, filtered by group, category and status.
- Scoring, the latest scoring of the agents of the selected group or of all within the time range selected in the default filter of the reports is shown. The last scoring of each agent within the temporal range is always taken, that is, if a range of one month is set, the last scoring of the agents within that month will be searched.
- Evolution, a global evolution of hardening is shown by averaging the tests that passed and those that failed, grouped by day, for all agents or those within the selected group.
Here are some examples of PDF reports:
Hardening Dashboard
Security view of the agents
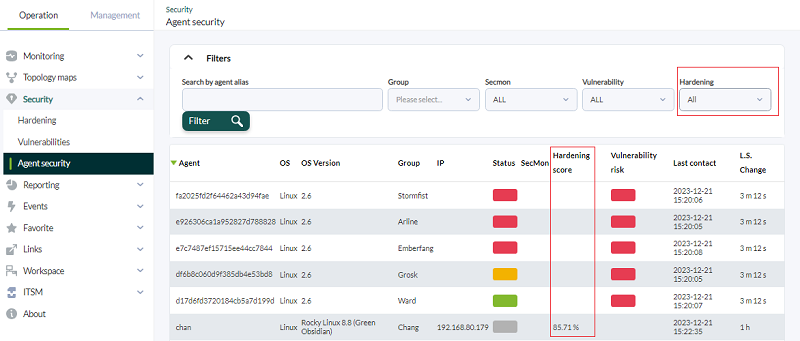
Operation → Security → Agent security menu.
In the agents' security view, Hardening column, you will be able to see the score of each agent, among other data. You may filter by hardening score percentage and include other additional fields. To show the agents without hardening score, use the All option.
Vulnerability Monitoring
In a similar way to how the hardening evaluation is carried out, Pandora FMS agents and the remote discovery engine will search for information about the software installed on the system, then compare this information with the central database of vulnerabilities that Pandora FMS has (downloaded from NIST, Miter and other sources) and will provide a list of software packages with known vulnerabilities.
This feature is available whether you have software agents (and these agents have software inventory enabled) or if you do not have agents and have to scan the network. If the network is scanned, the amount of information provided will be lower. It is recommended to use an agent.
Any version 7 agent can be used for this as long as it has software inventory activated. This system works for GNU/Linux® and MS Windows® systems.
In a similar way to how hardening works, Pandora FMS will offer a unique risk indicator for each system, based on the number of vulnerabilities and their dangerousness.
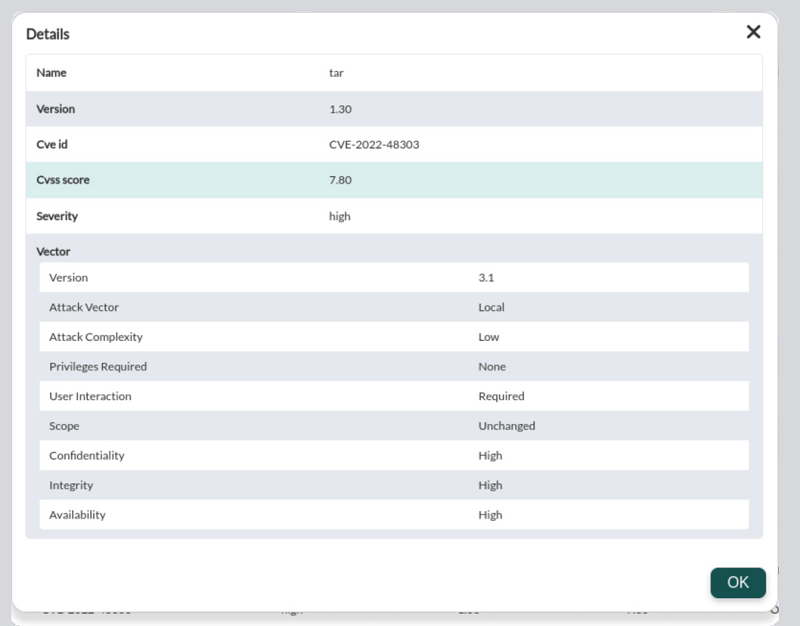
It will provide an information panel of the system's vulnerabilities, indicating the evolution of the risk over time, the vulnerabilities sorted by different criteria, such as complexity of the attack, severity, type of vulnerability, attack vector, user interaction, type of privileges required, etc.
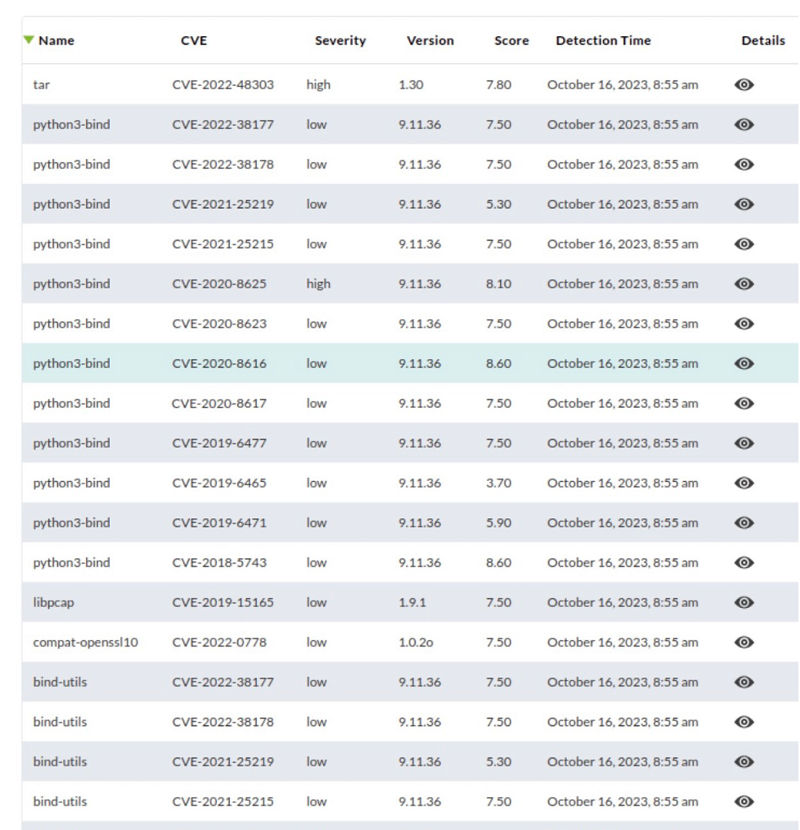
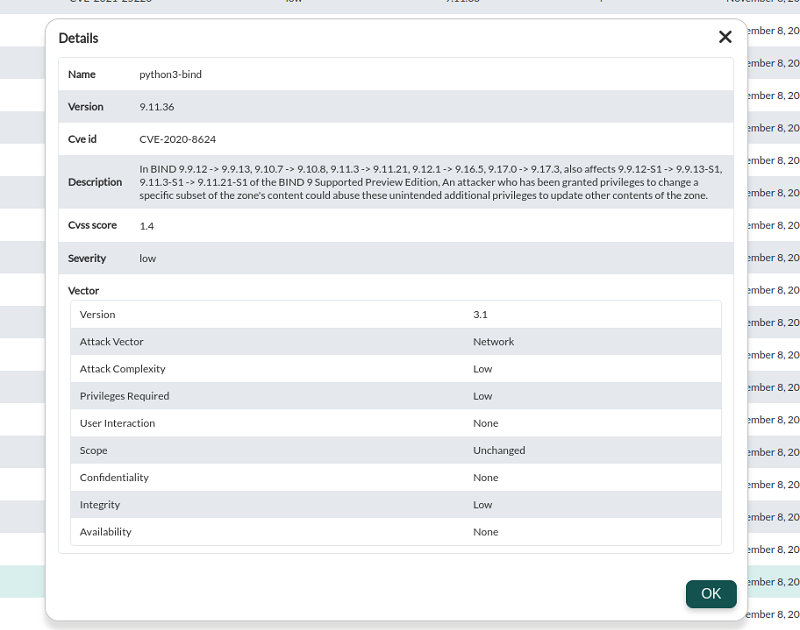
You may navigate through the control panel to filter the information and reach a level of detail where each vulnerable software package is specified, the vulnerability (with CVE code) that applies to it and the description of the problem:
What is a CVE?
Common Vulnerabilities and Exposures (CVE) is a unique, standardized identification for a security vulnerability in software or hardware. CVEs are a naming and tracking system used around the world to identify and list specific security vulnerabilities. This system was created to make vulnerability information organization, communication and reference easier, allowing the cybersecurity community and IT professionals to address and solve security issues more efficiently.
The key features of a CVE are the following:
- Unique identification: Each CVE has a unique number that identifies it, making it easy to track and reference. For example, a CVE may have a format like “CVE-2021-12345.”
- Detailed Description: Each CVE includes a detailed description of the vulnerability, allowing users to better understand the nature and impact of the issue.
- Cross-references: CVEs often include cross-references to other security resources and databases, such as the National Institute of Standards and Technology (NIST) National Vulnerability Database (NVD), to provide additional information about the vulnerability.
- Publication Date: CVEs normally include the date the vulnerability information was published.
CVEs are used by the computer security industry, software and hardware vendors, security researchers and system administrators to track and manage vulnerabilities. This standardized nomenclature is essential to ensure that vulnerabilities are communicated and addressed consistently around the world, helping to protect organizations and end users from security threats. Additionally, the existence of CVE makes it easier to create databases and tools that allow organizations to stay up to date with the latest threats and apply patches or security solutions when necessary.
The Pandora FMS vulnerabilities database
The Pandora FMS vulnerability database draws from two sources:
- CVE-Search which combines data from NVD NIST, MITER and Red Hat.
- Direct information from the repositories of Canonical, Red Hat, Debian, Arch Linux, NVD NIST, and Microsoft Security Updates.
The Pandora server builds its own database from this data and segments and indexes it in memory for quick detection, so that it only loads the vulnerabilities corresponding to the operating systems reported by Pandora FMS agents.
To detect vulnerabilities using agents, a database is used that is distributed by default with the PFMS server and associates package and application names with different CVEs. To detect remote vulnerabilities, a database is used that associates CPEs with CVEs. The console uses a database with information about the different CVEs found in the server database to display it to the user and generate reports. The data of the different CVEs are loaded in tpandora_cve table, which has existed since version 774.
Vulnerability Audit Configuration
At the server level
For local vulnerability detection, the Data Server must be activated and the agents must send inventory information software.
For remote vulnerability detection to work the Discovery Server must be activated.
At agent level
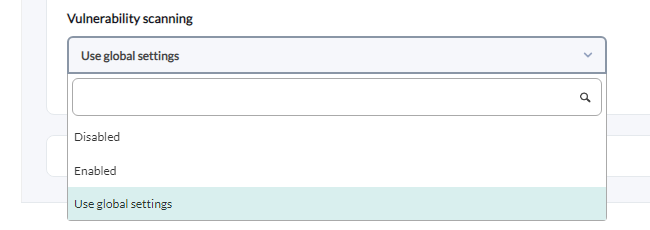
The default configuration (global) is done in the setup. An agent can be manually deactivated or activated or using the global setup configuration, in the advanced configuration section.
Remote Scan Tasks
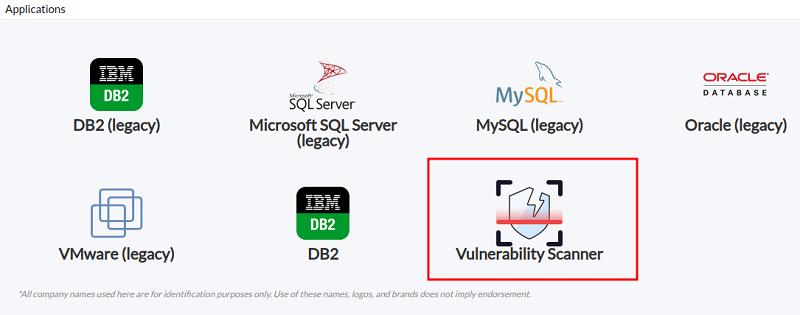
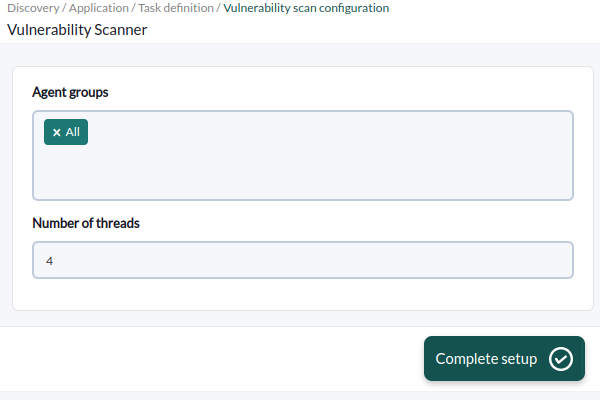
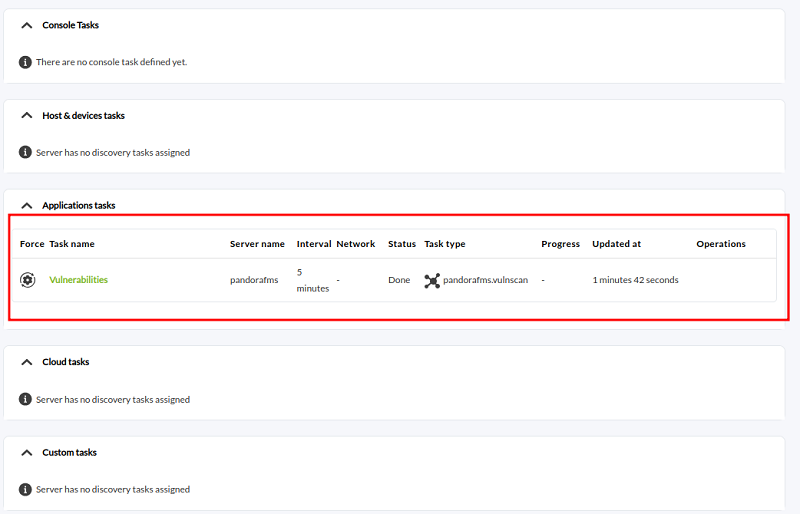
To do this you must go to Discovery and launch a new vulnerability discovery task. You will be asked for one or more groups of machines that already exist in monitoring to launch vulnerability detection on them. The main IP address of these agents will be used to launch the scan. If you do not have monitoring or they do not exist in Pandora FMS, they must be detected first with a normal discovery network detection.
Vulnerability scanning will not create new agents.
Vulnerability data display
Once the system has information, it will be displayed in the Vulnerabilities tab of each monitored system.
It also has (as of version 775) a general dashboard, with several added graphs, such as the Top-10 of most vulnerable systems (worst ranking of vulnerabilities), Top-10 vulnerabilities (most frequent) and other groupings.
These reports have some specific filters:
- By group of machines.
- Attack complexity (low/high/medium).
- Type of vulnerability (confidentiality, integrity, availability…).
- Access vector: Network, Adjacent Network…
- User interaction: none, required, etc.
- Privileges required: None, low…
Scope metrics allow you to quickly filter out vulnerabilities:
Tactical security view
Operation → Security → Vulnerabilities menu.
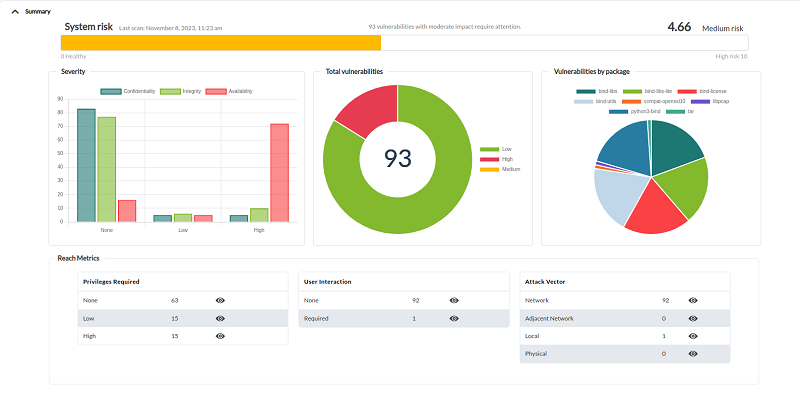
Summary
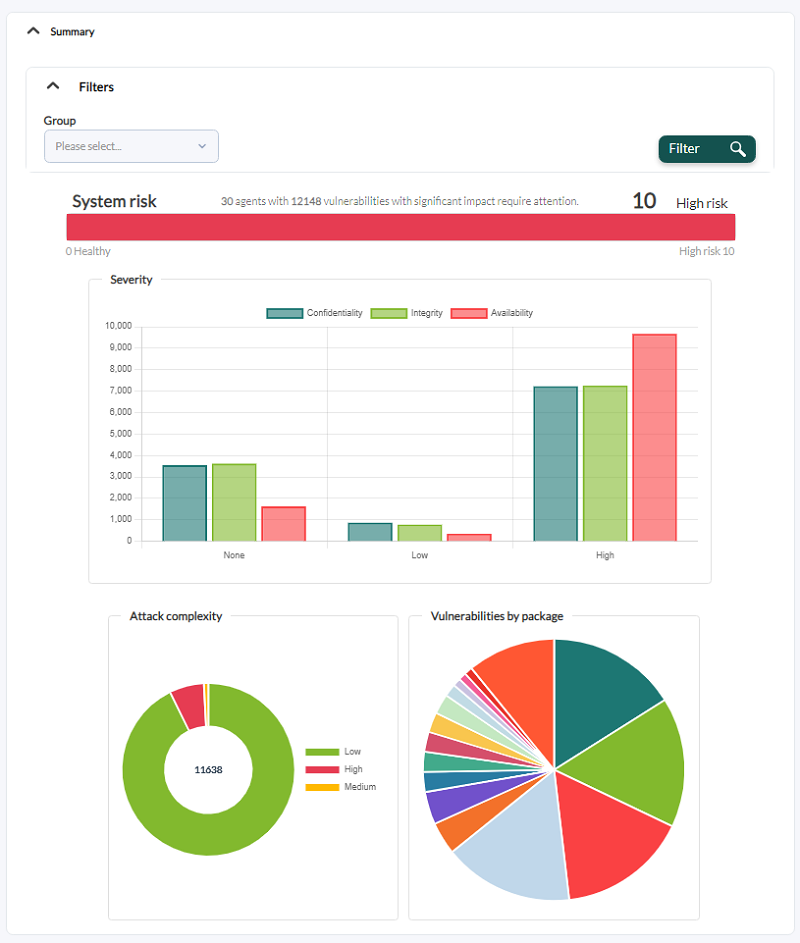
It presents an overall picture of the agents, with graphs summarizing the total system risk as a whole, the severity of the complexity of the attacks and the vulnerabilities presented by each installed software package.
You may filter by agent group, all groups are displayed by default. (All).
Data breakdown
It presents a breakdown of security data, showing the top 10 agents and top 10 software packages with the most vulnerabilities.
Information can be filtered by agent groups and exported in CSV format. Summaries in Privileges required, User Interaction and Attack Vector boxes have display buttons that refer to the audit section.
Audit
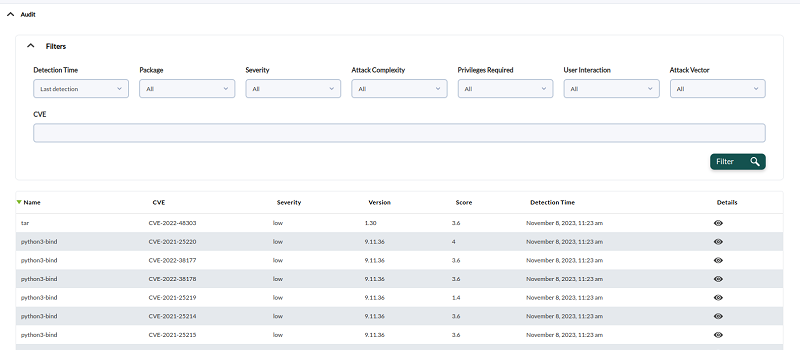
By default it displays all vulnerability information, so it may take some time to load. You will be able to filter by infinite combinations of vulnerability features, including specific CVE identifier numbers.
Once the information has been filtered, each item has a detail display button (eye icon) that will display the corresponding detailed information.


 Home
Home

