


- What Grafana is
- How Grafana works
- What Grafana is used for
- Grafana dashboards
- Grafana data sources
- Monitoring and alerting with Grafana
- Grafana’s observability ecosystem
- Grafana and Prometheus: how they differ
- Advantages of Grafana
- Limitations of Grafana
- Grafana OSS, Enterprise or Cloud: which one should you choose?
- Integrating Grafana with Pandora FMS
- Is Grafana better than an integrated monitoring platform?
- Frequently asked questions
- Conclusion
If you spend enough time staring at raw logs and squint a little, you may start to see the Matrix among the mutterings of those thousands of incomprehensible lines. And with arcane terminal spells beginning with grep or awk, you can find the drop you are looking for in that ocean of characters. But it is inefficient, and nobody, especially our boss or the person we like, is impressed by it. So that they can also gain the knowledge hidden among thousands of data points, there are tools such as Grafana, which use simple charts and attractive dashboards to display the most important information when monitoring.
That is why Grafana is one of the most recognisable tools in IT monitoring, to the point that quite a few people mistake it for monitoring as a whole. However, Grafana is the layer that queries, explores, visualises and triggers alerts based on data residing in other systems.
Therefore, it is not only used to draw attractive charts on its canvas, although that is its best-known feature, but nor can it replace, by itself, everything we need to collect, store and manage our telemetry.
It is important to understand this distinction, because almost everything else follows from it. Today, we will look at what Grafana really is, how it works internally and what it is used for, the advantages it provides, the complexity it adds… and where this piece of the puzzle fits within a monitoring and observability architecture.
What Grafana is
Let us switch into dictionary mode for a moment: Grafana is an open-source visualisation and analytics platform that makes it possible to query, explore, represent and generate alerts based on data stored in a wide range of sources.
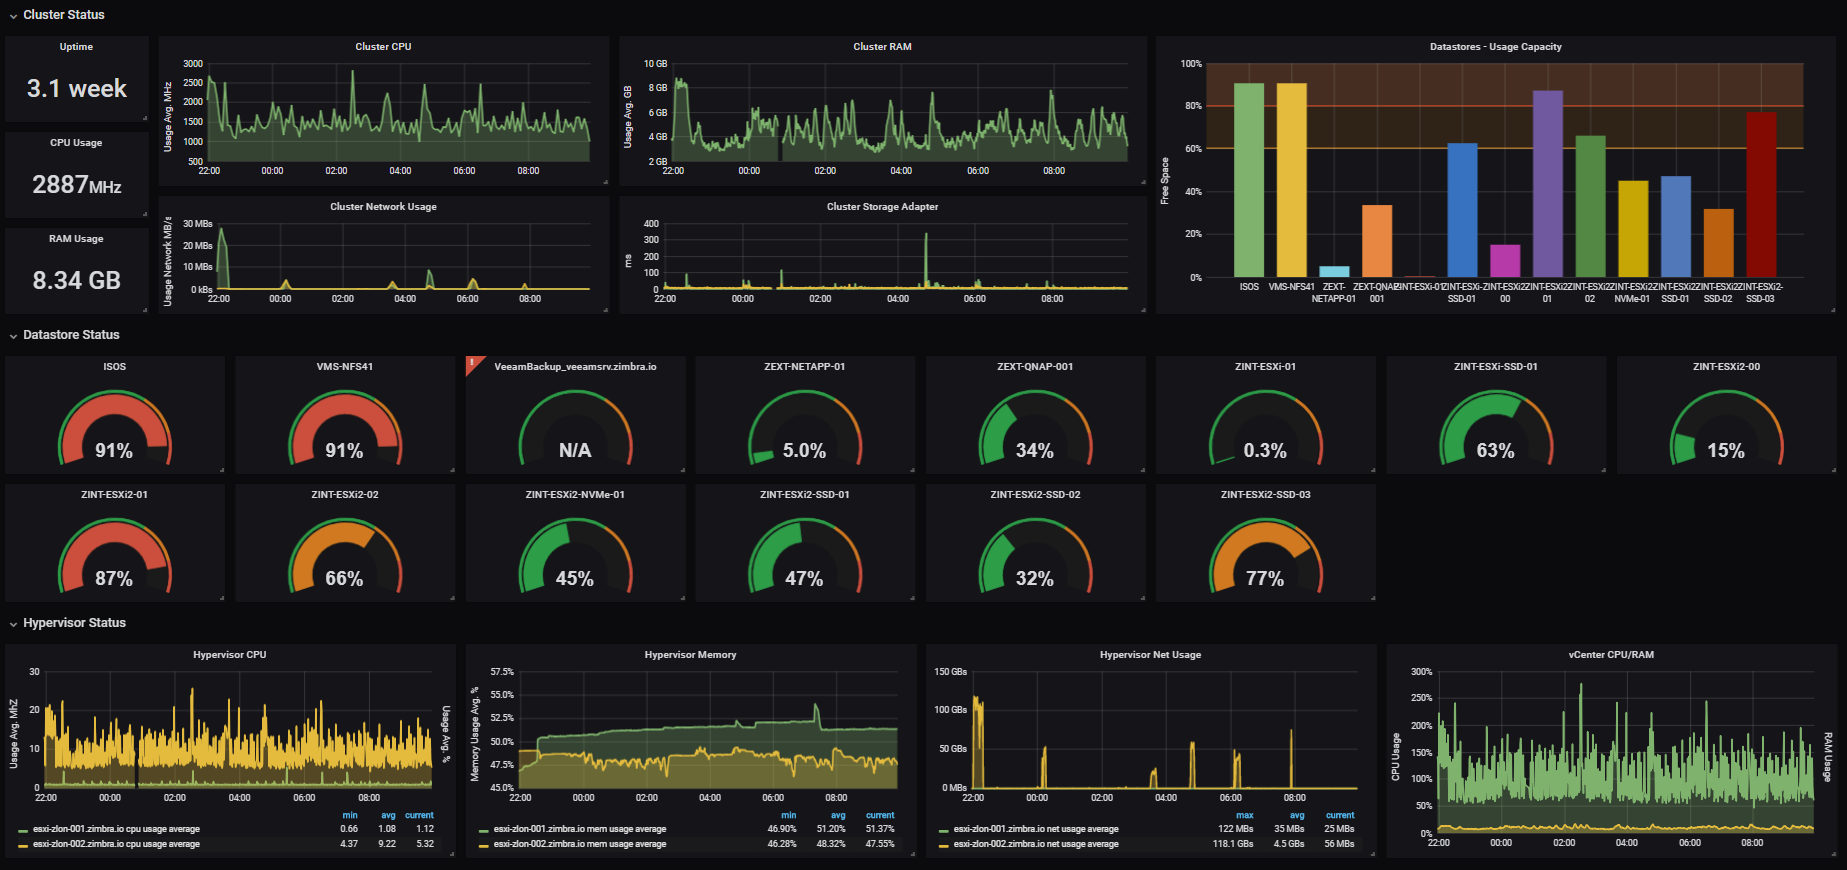
That is why its best-known use is dashboards, those panels full of charts, gauges and traffic lights that decorate the screens of half the IT department. However, its actual scope covers metrics, logs, traces and performance profiles. The official Grafana documentation sums up its guiding principle well: Metrics, logs, traces and profiles, wherever they are.
The fact that it is also open source means two things in practice:
- We can deploy it ourselves without paying a licence fee.
- We can view and modify its code.
Grafana OSS was relicensed under AGPLv3 some time ago, so any old reference to Apache 2.0 belongs to another era, just like grep and awk for those of us who are feeling nostalgic.
From there, we have three flavours of the tool on the same plate:
- Grafana OSS. The open, self-managed edition that includes the essentials: visualisation, data source connectivity and an alerting system. This is the starting point for almost everyone when they first encounter the application.
- Grafana Enterprise. It shares the same foundation, but includes more commercial plugins, additional features and support. It is designed for organisations that need guarantees and connectors not covered by the community.
- Grafana Cloud. It jumps on the bandwagon of everything being subscription-based nowadays, but with the advantage of offering the entire ecosystem as a managed SaaS service. This means we no longer have to deploy and maintain the infrastructure ourselves.
Grafana was born as a fork of Kibana 3 —“Graf” refers to graphs and “ana” pays tribute to Kibana— because, in December 2013, Swedish developer Torkel Ödegaard needed a more flexible tool for creating metric dashboards.
Since then, having started out with a focus on time-series charts, it has expanded far beyond them and become a reference interface for a large part of the observability world.
How Grafana works
At this point, it is worth lifting the hood of all those attractive charts and colours to see what lies underneath, because almost every misunderstanding about Grafana comes from failing to understand its workflow.
The first thing to understand is that Grafana does not generate data in production. Instead, it connects to systems that already contain that data and requests it whenever it needs it.
In simplified form, the process looks like this:
Data source → Query → Panel → Dashboard
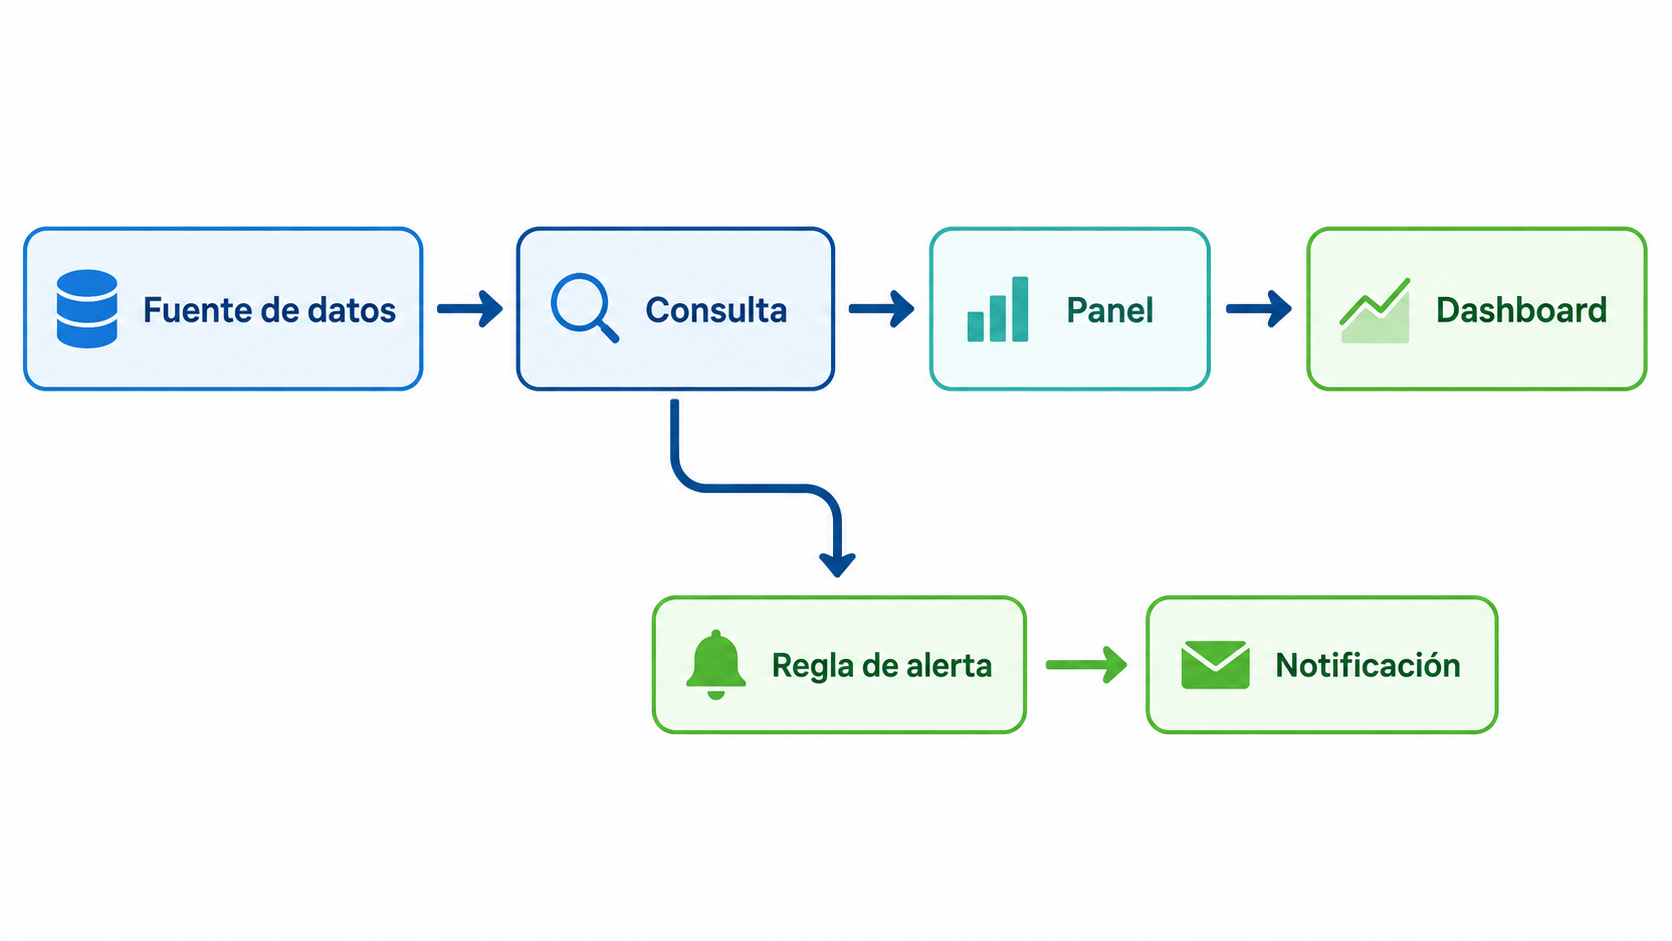
Alongside this process and using that same query, or any other query we define, we can configure alert rules that evaluate a condition and independently trigger a notification.
Let us break down how it works step by step:
- An external system collects or stores the data, such as a Prometheus server, a database or a cloud service.
- Grafana connects to it through a data source, using a connector designed for that specific technology. Many connectors for the most common sources are built in, while others are installed as plugins.
- The user then runs a query, written in a language that the source understands.
- The result appears in a panel, which is the smallest unit of visualisation.
- Several panels are grouped into a dashboard, which provides the overall view, and…
- Separately, alert rules can be defined against that same data source without having to belong to any panel, unlike in previous versions: they run queries, evaluate a condition and independently trigger a notification.
Let us take a quick closer look at the mechanics of the process, because these concepts are often confused.
- The data source is the connection to a data origin.
- The plugin is the translator that speaks its language.
- The query is the specific question we ask.
- The panel is a visual answer.
- The dashboard is a collection of visual answers configured according to our specific information requirements.
- The alert rule is the condition that triggers a notification when something goes off the rails.
Taken together, it is like the HUD of a flight simulator, where the screen displays altitude, fuel and engine speed with pinpoint clarity, but the panel does not invent any of those numbers; they are produced by the engine underneath.
That is why, if we remove the engine, the HUD is left displaying very attractive zeroes while Grafana continues to work as usual, because without a configured data source it has nothing to show us apart from those zeroes.
Each source also comes with its own query editor, adapted to the way it stores information, which can be as powerful as it is inconvenient, depending on the day.
There is one more aspect of its operation that we need to understand: none of this is a static snapshot, otherwise it would be of very little use to us.
Each dashboard has a time range and a refresh interval inherited by its panels. Although a specific panel can override the range with its own relative time setting, the refresh interval applies to the entire dashboard. Grafana therefore reruns the queries at each interval and redraws the picture based on the results it receives.
Consequently, when we see a graph moving in real time, Grafana is not actually “capturing” anything, even though that may be the impression it gives. What it is doing is repeatedly querying the source and updating its representation.
Understanding this helps avoid unpleasant surprises, because it explains why a panel becomes flat when the source stops responding. The reason is that there is silence at the other end of the connection, but Grafana itself continues working as described, which is what causes these situations.
What Grafana is used for
This is the million-dollar question and the one that brings many people here, because Grafana can be used for many things, almost all of them centred on seeing and understanding what is happening within an IT infrastructure.
These are its real day-to-day uses:
- Visualising infrastructure metrics. CPU, memory, disk, network… The daily bread of any system administrator.
- Monitoring servers and applications. Reporting their response times, error rates, queues or latency, for example. This is what separates a healthy service from one that is quietly dying.
- Observability for Kubernetes and cloud-native environments. Monitoring container status, pods that restart without warning or resource consumption by namespace.
- Analysing logs and distributed traces. This makes it possible, for example, to track the footprints of a request as it passes through fifteen microservices before failing in the last one.
- Dashboards for NOCs and operations teams. These are like the large screens in the control room of a spy film, from which teams make sure that the world continues turning in the right direction.
- Visual correlation between different information sources. This allows us to bring together, in a single view, data stored in different places so that it tells us the complete story of what is happening, something that would be impossible to determine from each source separately.
- Alerts and business indicators. These range from a warning about a full disk to a dashboard for the CEO containing the figures that really matter to someone who cannot tell a Docker container from a recycling bin.
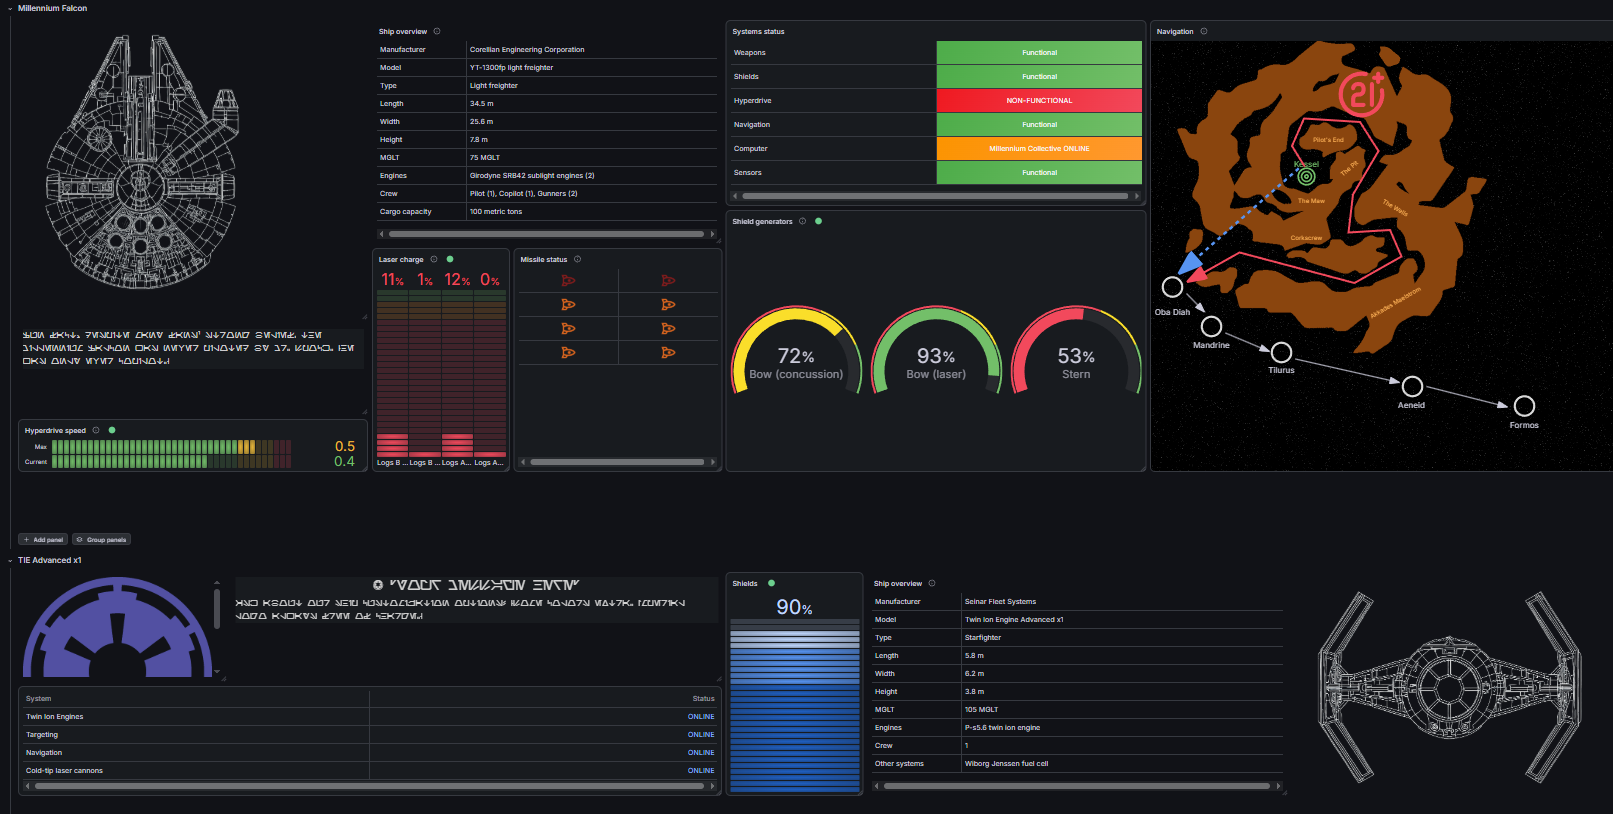
To bring this down to earth, let us imagine an ordinary night shift. One panel shows that the latency of an API has soared, while the panel next to it shows that the memory usage of three containers is approaching its limit. Meanwhile, another panel correlates those peaks with an increase in 500 errors immediately after a deployment.
None of those graphs resolves the incident for us, of course, but together they paint a picture —an awful one in this example— that would have taken us three times as long to reconstruct and fully understand if we had examined each data point and system separately.
That is Grafana’s real job: bringing together on the same screen pieces that exist separately, so that we can see the entire puzzle rather than its individual pieces.
The common thread is variety, because Grafana is not tied to a particular data type or provider. The previous example could have been built using CPU usage, log events, response times or service availability.
That flexibility is its greatest strength, although, as we will see, it does not come for free: the price is complexity.
Grafana dashboards
This is where the tool gets its chance to shine, because this is where it stands out from the rest of the solutions.
Let us remember that a dashboard is an organised collection of panels that show, at a glance, the status of what matters to us. A panel is the individual component that displays a chart, table or gauge, while the dashboard is the composition that brings them together and gives them meaning.
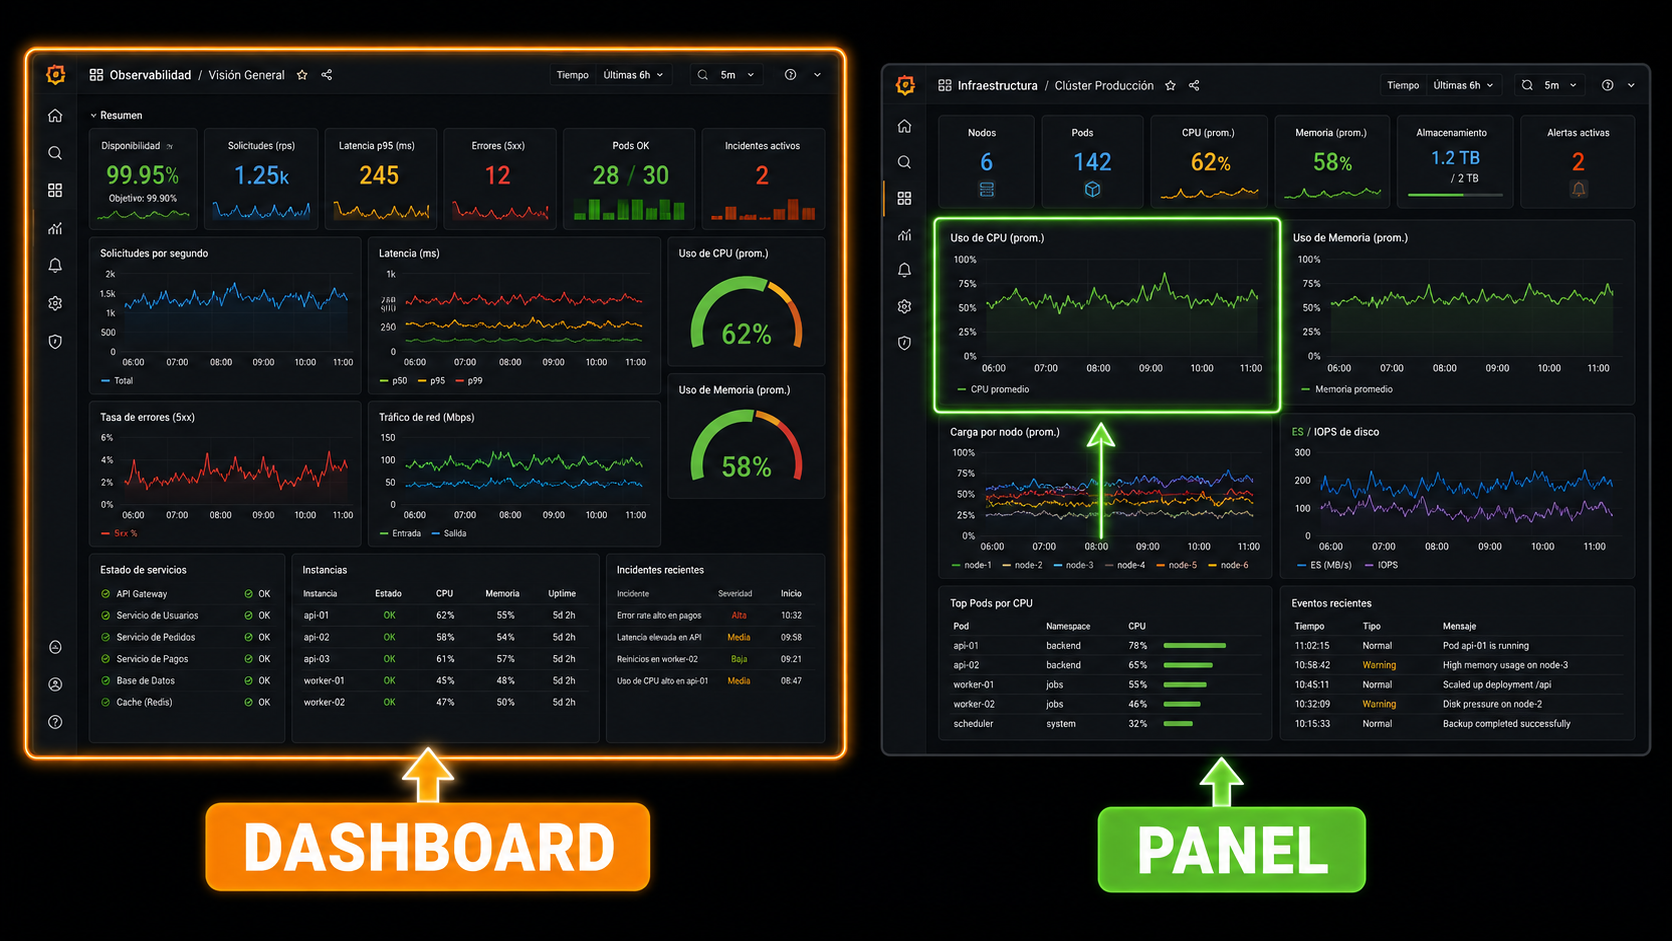
Around this concept, Grafana provides an extensive toolbox, detailed in its dashboard documentation, which allows us to use:
- Different types of visualisation for almost everything: from time series and heat maps to gauges, tables, histograms, status panels…
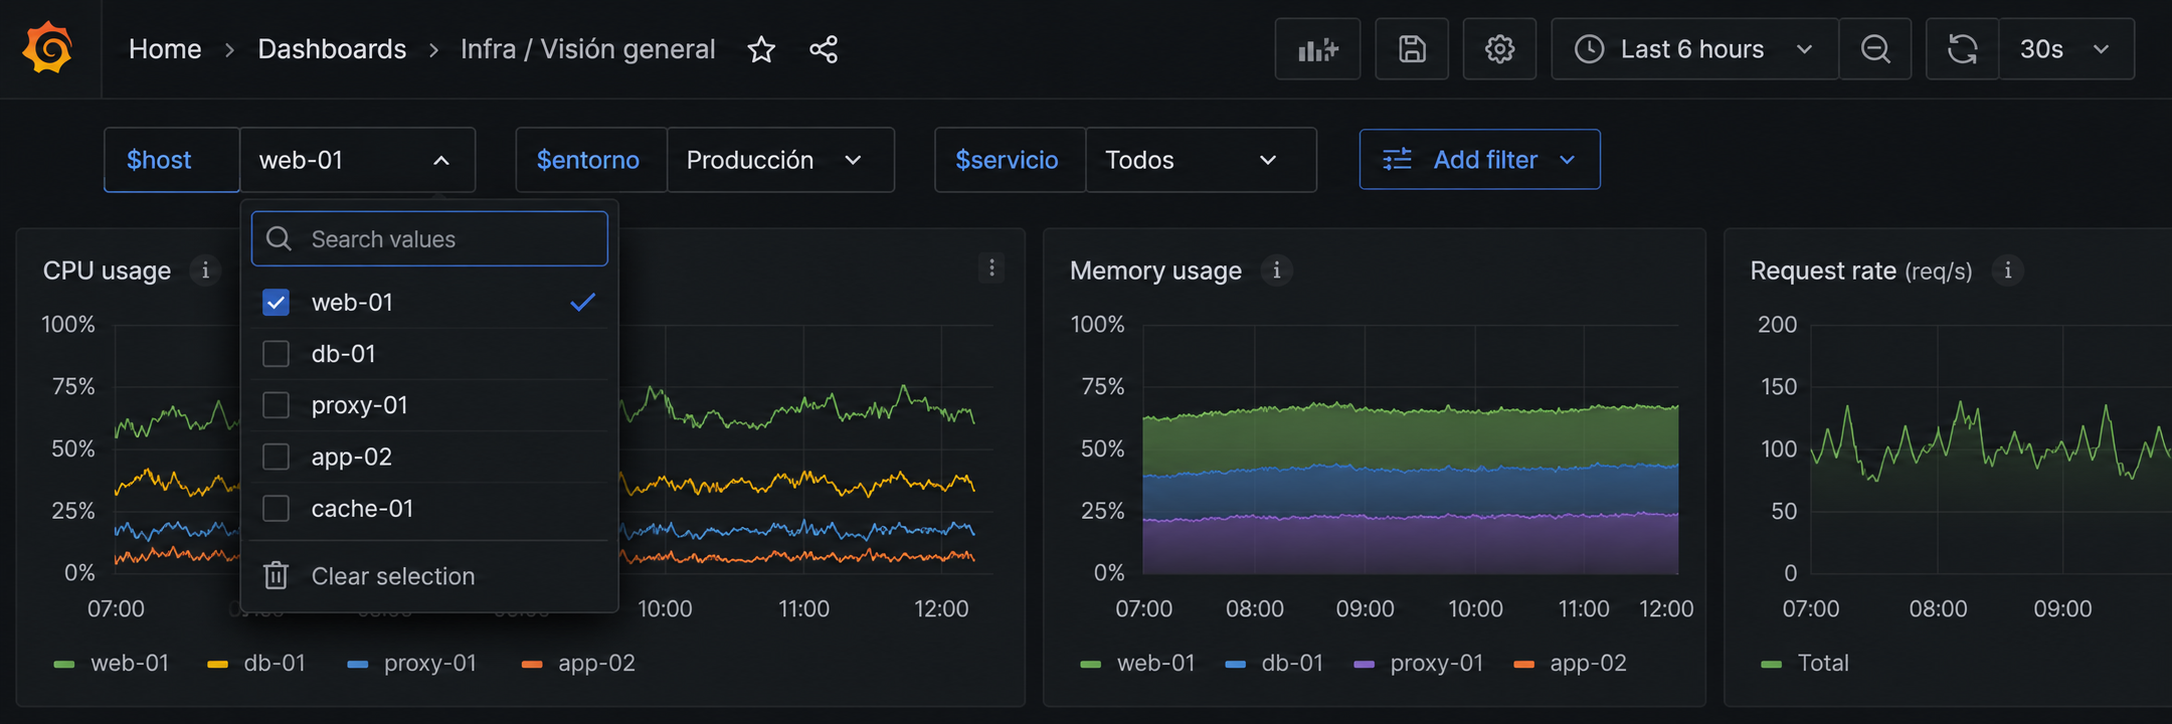
- Variables and filters so that we do not have to clone a panel for every server. Grafana allows us to reuse the same panel by changing a drop-down menu.
- Annotations that allow us to mark on a graph when a version was deployed or when an incident began.
- Templates and community dashboards that we can import and adapt to our IT infrastructure, meaning that we do not have to start from a blank page.
- Permissions and team-based organisation, so that everyone sees what belongs to them without snooping where they should not or interfering with someone else’s work.
Designing a good dashboard involves more craftsmanship than clicking and could fill an entire article. That is why, for a step-by-step explanation, we have a dedicated guide on creating Grafana dashboards with Pandora FMS data, where the process is examined in detail.
For our purposes here, it is enough to understand the fundamental idea clearly: the dashboard is the display case that presents the information, and a display case only looks good when there is quality merchandise behind it.
Which inevitably brings us to…
Grafana data sources
The Little Prince tried to teach us that what is essential is invisible to the eye and, in Grafana’s case, data is the heart beating beneath the surface, even though it is not the part that appears in screenshots.
A data source is the connection to a system that stores information, and each one relies on an external or built-in connector capable of communicating with that specific technology.
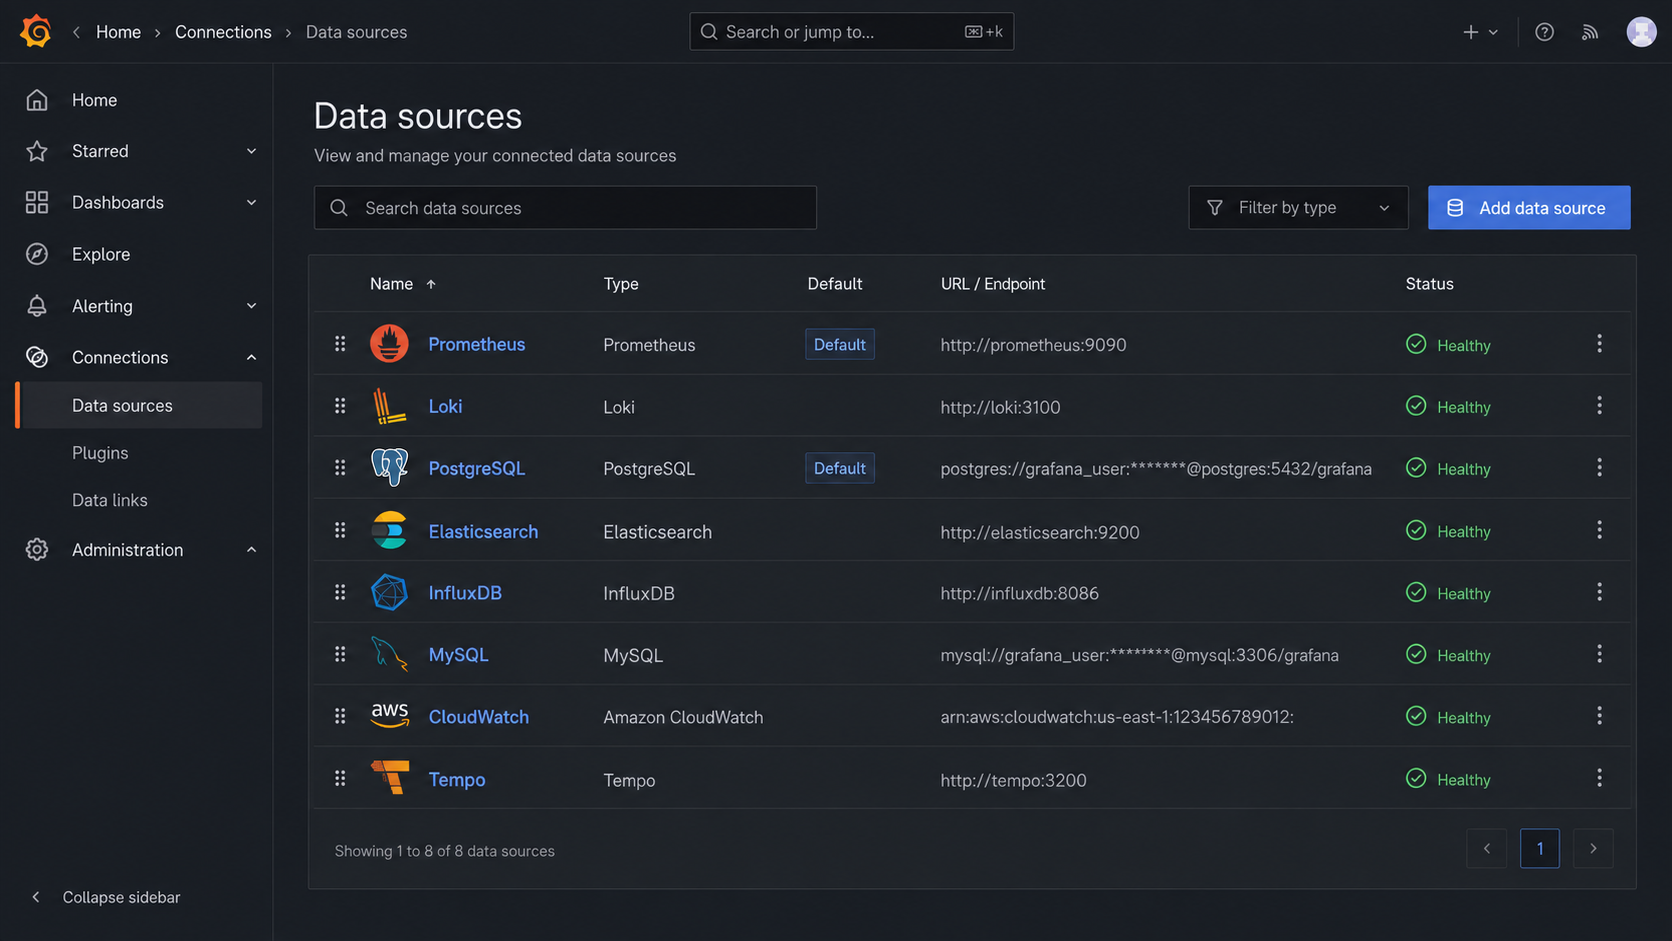
The official data source documentation describes the enormous catalogue from which Grafana can display information, but to demonstrate its capabilities, it is enough to mention the usual suspects:
- Time series and metrics: Prometheus, InfluxDB, Graphite…
- Public clouds: AWS CloudWatch, Azure Monitor, Google Cloud Monitoring…
- Databases: MySQL, PostgreSQL, Microsoft SQL Server…
- Logs and traces: Elasticsearch, Loki, Tempo, Jaeger…
As we can see, it covers almost everything, so there is little point in memorising a list that grows every month. Grafana includes certain main data sources by default —the most popular and widely used ones— and extends the rest through plugins, meaning that it can query metrics, logs, traces, profiles and data from databases or cloud services almost interchangeably.
However, that diversity comes with some fine print, because each source speaks its own query language.
PromQL for Prometheus, LogQL for Loki, SQL for a relational database… Grafana unifies the view, but not the language running underneath. Therefore, to make full use of it, we will also need to understand how to query each source.
Otherwise, it is easy to get things wrong without realising it, because an incorrectly configured source, expired credentials or a resource-intensive query can leave an attractive dashboard displaying incorrect data or, quite simply, nothing at all.
Monitoring and alerting with Grafana
We do not just want charts that impress the people holding the purse strings; we want practical value in our daily work, observability, alerts and elven eyes watching every corner of our infrastructure and pointing out everything they see. In that case, can Grafana be used for monitoring?
Yes, but that means different things depending on whom you ask.
Grafana can query monitoring data, display it in real time, evaluate rules, centralise alerts, send notifications and combine queries from different sources within the same rule. Its alerting system also makes it possible to define conditions across multiple sources and manage every notification from a single view, which is extremely useful when our important telemetry is scattered halfway around the world.
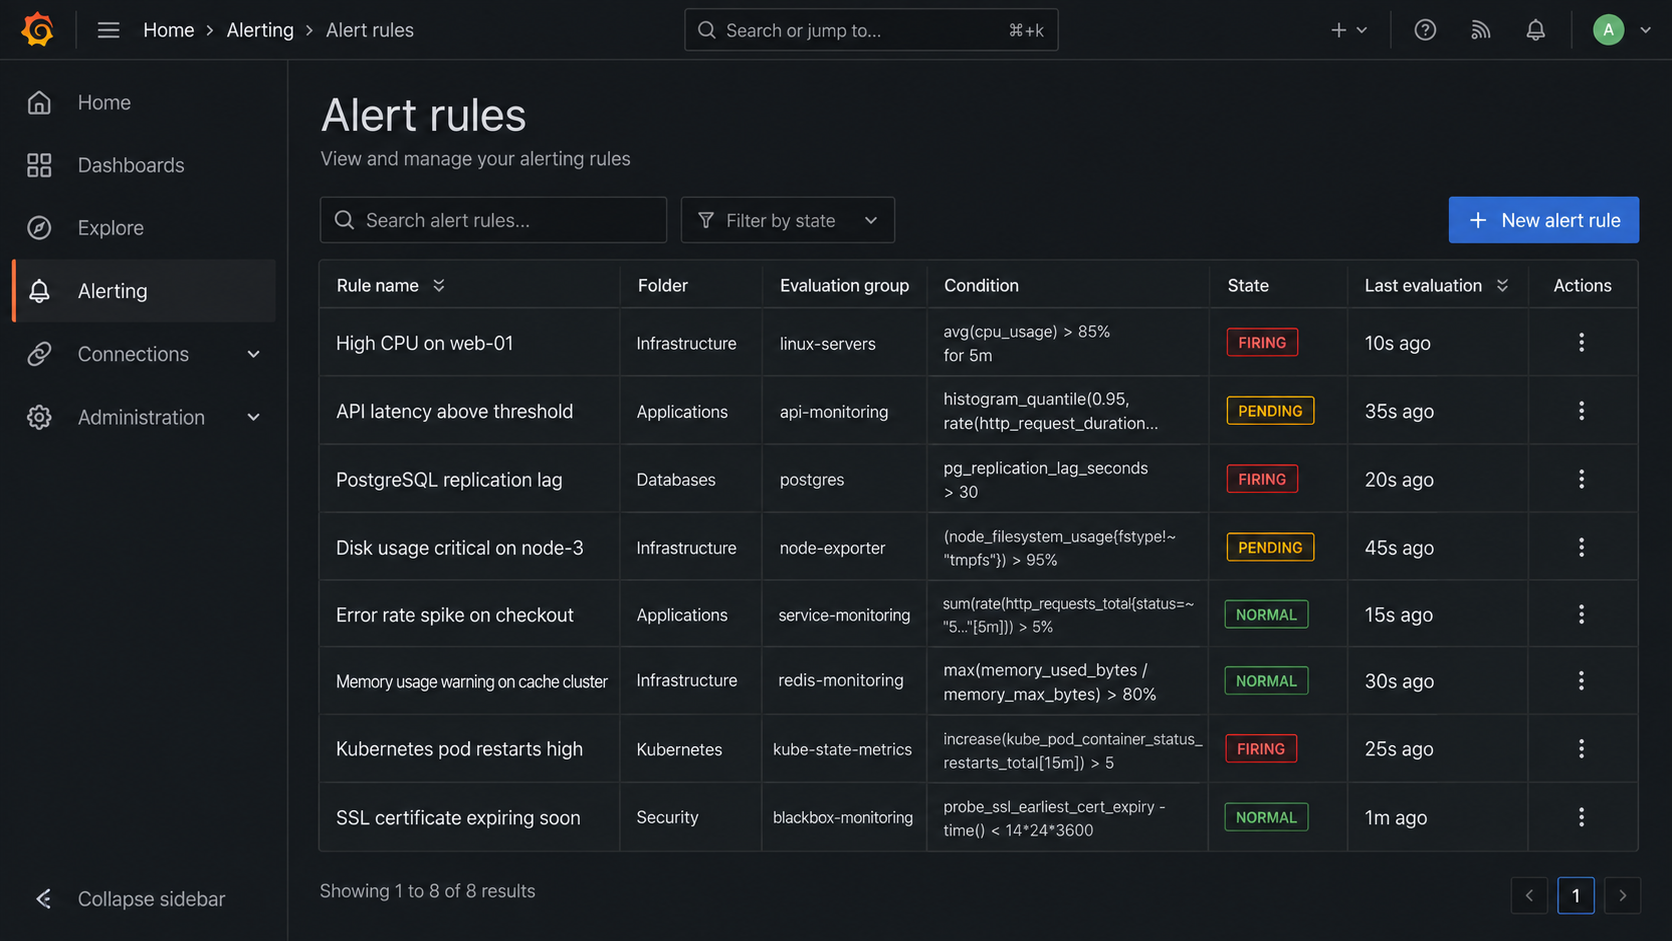
However, I must insist on the nuance that separates those who understand Grafana from those who sell it as a cure-all. Grafana remains the outer layer of paint, and the fact that it can alert us does not remove the need to collect, store and properly maintain the data that feeds it.
An alert will only be as good as the source behind it and, if nobody collects the metric or it is collected incorrectly, Grafana will not warn us about anything.
Grafana’s observability ecosystem
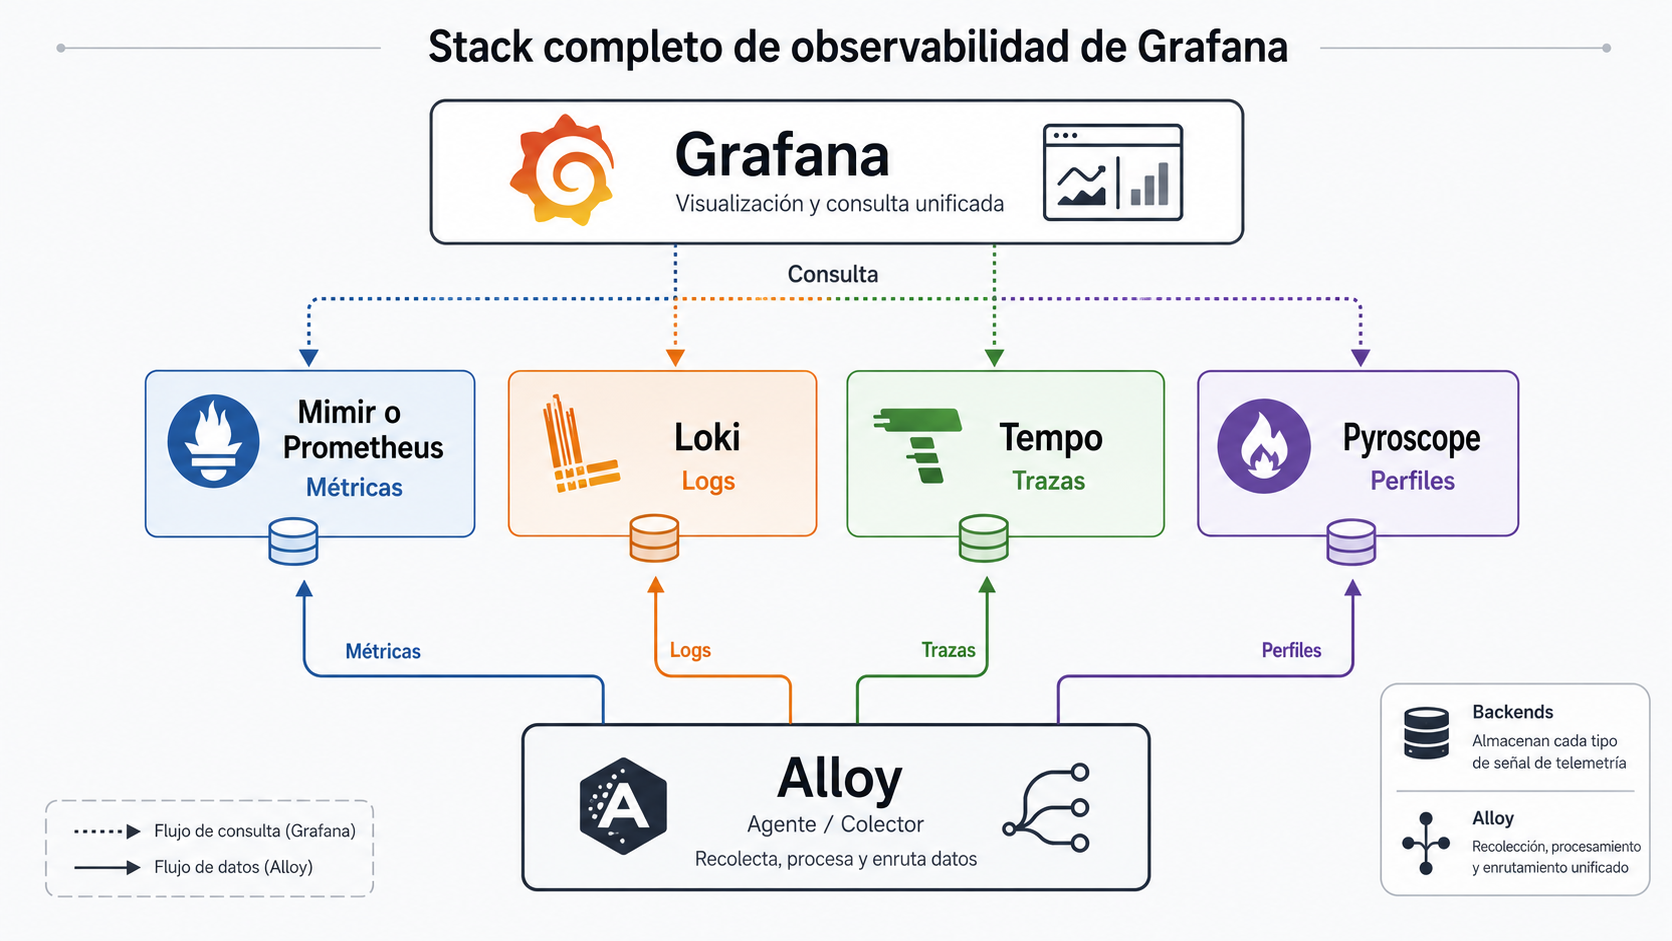
Over the years, Grafana Labs has built a constellation of open-source projects around it that cover every stage of the telemetry journey, also supported by external standards such as Prometheus and OpenTelemetry. It is worth exploring that constellation, even briefly, because it explains why people sometimes talk about the “Grafana stack” rather than simply “Grafana” itself. Within that ecosystem, we usually find:
- Prometheus: the classic solution for collecting and storing metrics, although it does not belong to Grafana Labs and is instead a CNCF project.
- Loki: the backend for logs.
- Mimir: although in Spanish it is used as a meme-like way of saying “sleep”, it actually follows the tradition of naming projects after Norse mythology, referring to the giant responsible for guarding the source of knowledge beneath the roots of the most sacred tree. In practice, it provides scalable, long-term storage for Prometheus metrics.
- Tempo: the backend for distributed traces.
- Pyroscope: continuous performance profiling.
- Alloy: which collects and sends metrics, logs, traces and profiles.
Loki, Tempo and Mimir are complementary storage components, while Alloy acts as a unified collector, an OpenTelemetry Collector distribution that centralises telemetry delivery.
An important warning regarding outdated documentation: if we are coming from older guides, it is best to forget about Grafana Agent. It reached the end of its life on 1 November 2025 and no longer receives support, patches or security updates.
The official recommendation is to migrate to Alloy.
Grafana and Prometheus: how they differ
I have been talking a lot about Grafana and Prometheus, and the concepts are sometimes confused, so I think they deserve their own section to make the role of each one perfectly clear.
- Prometheus collects and stores metrics, which means that, in its relationship with Grafana, it acts as a data source.
- Grafana queries and visualises that data, which means that it acts as a presentation layer.
They work brilliantly together, but neither one necessarily forces us to use the other.
Grafana is promiscuous and can connect to a vast number of data sources other than Prometheus, while Prometheus can also exist independently and feed other interfaces in a consensual and highly useful polygamous relationship for our IT management.
Like any good modern couple, they complement each other without being mutually dependent.
For a deeper look, here we explain how the rest of the Prometheus monitoring architecture fits together, while the official documentation also explains its integration and relationship with Grafana.
For now, let us remember one sentence that clears up 90% of the confusion: Prometheus stores and Grafana displays.
Advantages of Grafana
Grafana has become almost an industry standard because of its superiority in the following areas:
- Visualisation flexibility. Few tools allow us to represent the same data in so many different ways.
- Compatibility with multiple sources. Metrics, logs, traces and databases can coexist within the same panel, no matter how different their origins may be.
- Customisable dashboards down to the last pixel, with a plugin ecosystem capable of extending almost any feature.
- Centralised alerts that combine queries from different sources within a single view.
- Separation between visualisation and storage. This means that we can replace the data engine without rebuilding the visual structure of the panels —although we will still need to adapt the queries— and vice versa.
- Community and resources. Grafana is an active project in excellent health, with open-source code on GitHub, thousands of shared dashboards and answers to almost any question.
- Self-hosted and cloud options, depending on how much infrastructure we want to manage ourselves or delegate to others.
As a flexible visualisation layer decoupled from storage, few alternatives can compete with Grafana. However, it is not the silver bullet for every organisation either, so it is time to talk about…
Limitations of Grafana
In The Lord of the Rings, the palantíri allow those who possess them to see distant things, but anyone who looks through them depends entirely on what lies on the other side of the stone… and more than one person ended up deceived by placing too much trust in what they saw.
A dashboard works in the same way, displaying whatever reaches it. But if that information is incomplete or incorrect, if it is one of Sauron’s tricks or the data is poorly organised, we will see a beautiful lie in real time.
That is why Grafana’s real limitations are:
- It provides no value without properly configured data sources. This is a direct consequence of Grafana being a window into the data store, but not the data store itself.
- A complete architecture usually requires several tools. A collector, storage for metrics, logs and traces… Grafana is only one piece of the complete puzzle we need.
- Installation is easy, but maintaining the stack… That is another matter, because getting Grafana up and running takes only a few minutes, but maintaining high availability, retention, permissions and scalability is a completely different story.
- Queries depend on each data source. Each source has its own language and structure, so I will not stop insisting that mastering Grafana also means mastering the languages spoken by its data sources.
- Dashboards require design and maintenance. After all, a poorly designed panel misleads more than it informs and becomes outdated if nobody looks after it.
- It can create a dependency on specialised knowledge. Someone has to know how to keep all of this running, and people with those skills are not always easy to find, although they are probably always sending out CVs to explore greener pastures.
- It does not replace an integrated monitoring platform. It does not include built-in inventory, discovery, native agents managed from the platform, event management, SLA reports, remote access or advanced network monitoring.
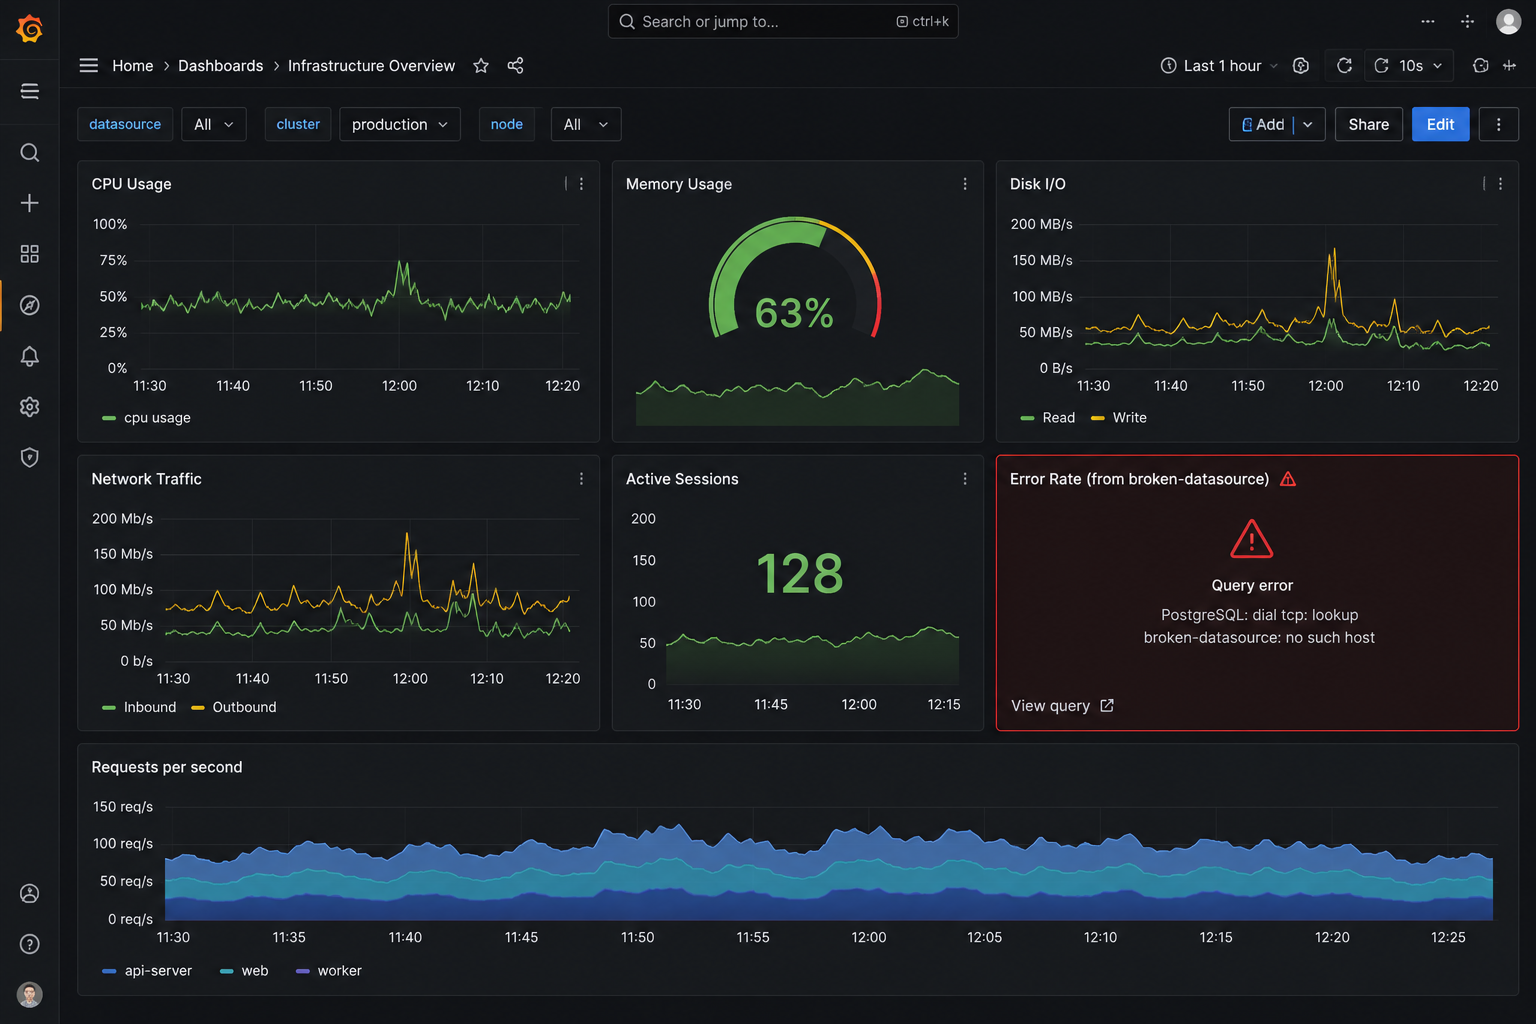
None of this is intended to belittle Grafana, but rather to remember what it actually is and acknowledge that it performs its own role exceptionally well. However, a composable visualisation platform is not an integrated monitoring platform.
Grafana OSS, Enterprise or Cloud: which one should you choose?
How do the different versions of the tool differ? What does each one provide, and which is the most suitable for our particular case?
Let us analyse them with a simple table that will give us a quick answer.
|
Edition |
Deployment |
Main focus |
Ideal for |
|
Grafana OSS |
Self-managed |
Essential open-source features |
Teams capable of operating their own stack |
|
Grafana Enterprise |
Self-managed |
Commercial features, plugins and support |
Organisations with enterprise requirements |
|
Grafana Cloud |
Managed SaaS |
Hosted observability stack |
Teams looking to reduce their operational workload |
I am afraid I cannot include pricing or plan limits, because they change over time and this article would be outdated before reaching its final full stop.
As for the most suitable option for us, as always, the correct answer is that irritating “it depends”, which forces us to take a look at what we have in our infrastructure first. The best choice will therefore depend on how much of that infrastructure we want to manage and what guarantees we require.
- If we have the team, time and willingness to operate it —hehe—, we can choose the OSS edition and deploy Grafana with our own hands.
- If we need commercial backing, then the Enterprise version, obviously.
- If we prefer to forget about the plumbing, then the Cloud edition is the better choice, with all the pipes already connected and free from leaks.
As always, legislation concerning data, security or internal working processes may force our decision, due to a possible requirement to keep sensitive information on our own servers or implement specific security measures. In those cases, Cloud would be almost ruled out, leading us towards OSS or Enterprise, particularly for companies operating in critical or strategic sectors.
Integrating Grafana with Pandora FMS
This is where two philosophies join forces instead of competing, and the key lies in how responsibilities are divided. It is simpler than it may seem, and a Grafana chassis with a Pandora FMS “engine” gives us almost every chance of reaching the podium in IT management.
In this combination, the optimal setup would work as follows:
- Pandora FMS collects and manages the monitoring data. It discovers, measures, correlates, alerts and stores.
- Grafana consumes the data provided by Pandora FMS as another data source from which to build additional visualisations.
- The integration makes it possible to represent Pandora FMS modules and metrics in Grafana dashboards, taking advantage of the best of both worlds.
- In addition, Pandora FMS user permissions determine which data can be accessed, ensuring that security is not left outside the door.
In practice, the connection relies on two complementary components: the Pandora FMS extension, which exposes the data access endpoint, and the plugin installed in Grafana, which consumes it as a data source by authenticating with a Pandora FMS user account.
Broadly speaking, the setup is a dance made up of four simple movements that form the overall process.
I will not describe it exhaustively to avoid turning this into the Bible, but for the complete and up-to-date process, consult the step-by-step guide to integrating Grafana and Pandora FMS.
Step 1. Upload the extension to the Pandora FMS console
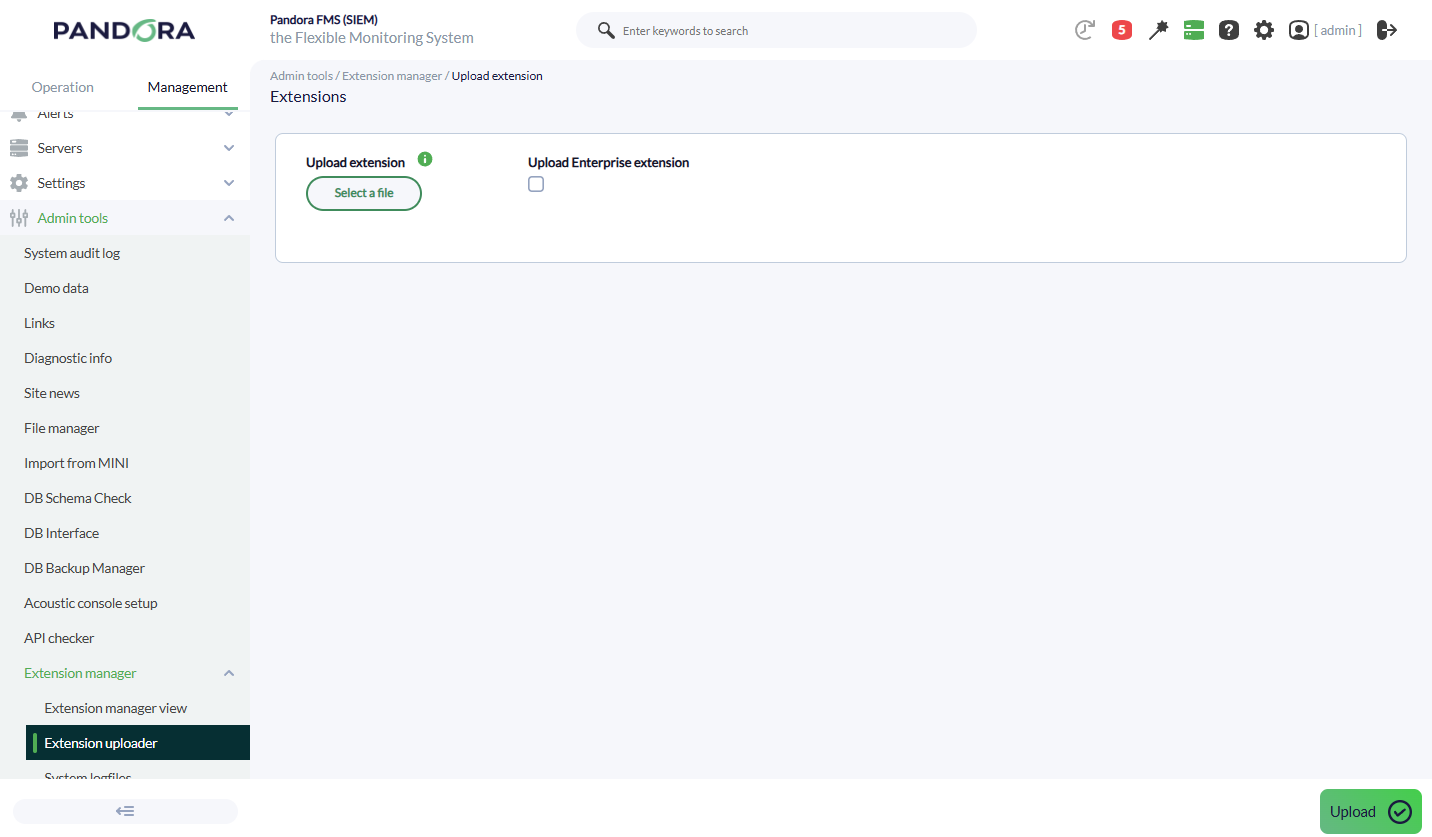
It is uploaded through the extension manager in the console itself and prepares the access endpoint through which Grafana will request the data.
For installations deployed from the ISO, a couple of additional adjustments must also be made to the Apache and PHP configurations, followed by a restart of the services so that the changes take effect. Consult the updated guide linked above for those finer details and the corresponding commands.
Step 2. Install the plugin on the Grafana server
The plugin is extracted into Grafana’s plugin directory, declared in its configuration file and followed by a service restart so that Grafana accepts it when starting up.
Step 3. Add Pandora FMS as a data source

Three things need to be done here.
- Click the button to add a new Grafana data source.
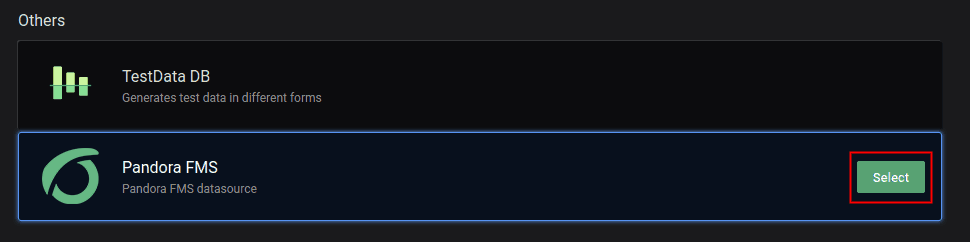
- Select the Pandora FMS plugin.
- Complete the three required fields: the extension URL, which by default will be http://x.x.x.x/pandora_console/extensions/grafana, where x.x.x.x is the IP address or DNS name of our Pandora FMS console, followed by the Pandora FMS username and password.
The connection test immediately tells us whether something is wrong, such as Grafana being unable to reach the machine, the extension address being incorrect or the credentials being rejected.
Step 4. Build the first dashboard
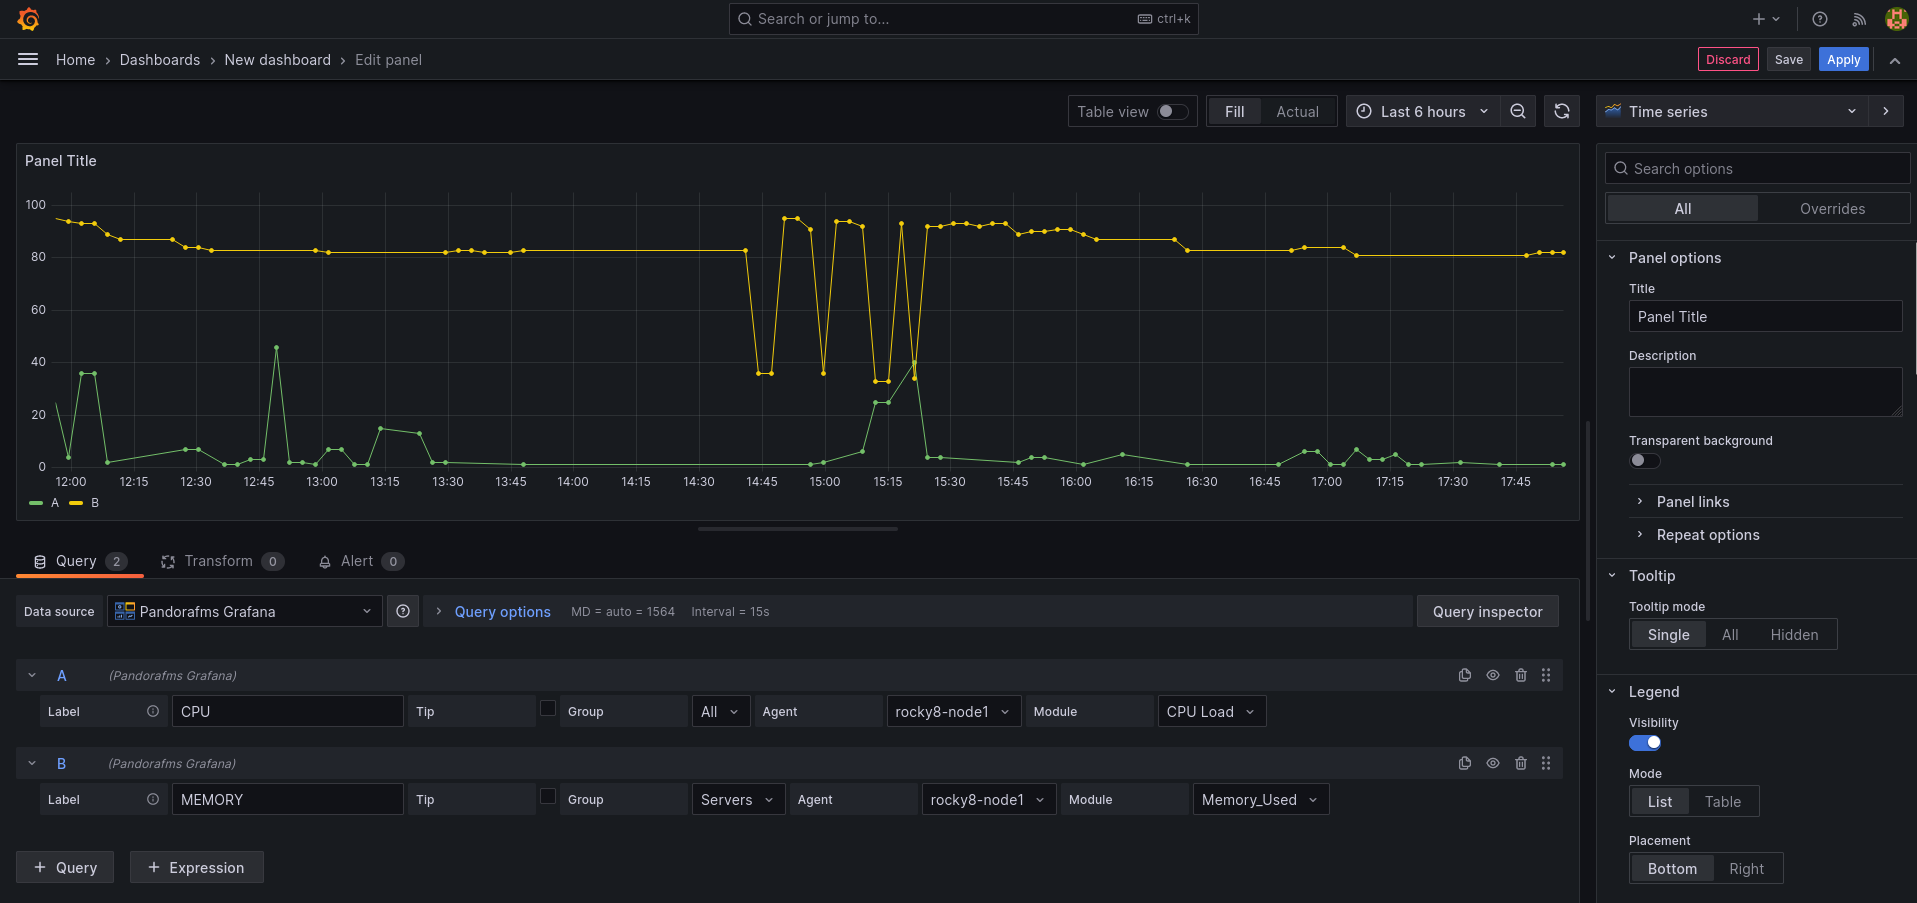
When creating the panel, the Pandora FMS data source is selected, and group, agent and module drop-down menus appear to act as the query editor. Several queries can be included in the same panel to compare modules, and several panels can be included in the same dashboard.
The underlying idea to remember is this: two elite specialists working together in the areas where each performs best. A platform such as Pandora FMS, which collects and governs monitoring with more than twenty years of proven experience, combined with a leading visualisation layer provided by Grafana, which adds another way of viewing the same data.
Is Grafana better than an integrated monitoring platform?
Although the previous combination is optimal, real life has an annoying habit of limiting IT budgets, and combining tools may be redundant in our particular case, meaning that we have to choose one option or the other.
There is no winner in these battles, and the correct answer is once again “it depends”. But do not worry, because here are the decision criteria.
Grafana fits like a glove when:
- We already have data sources for metrics, logs or traces up and running.
- We are looking for maximum visual flexibility and want to represent the data according to our own highly specific preferences.
- We have the resources required to operate a composable architecture made up of several components.
- We work with Prometheus, Kubernetes or OpenTelemetry ecosystems, which almost provide the perfect assist for implementing Grafana and achieving that desired higher level of observability.
An integrated platform such as Pandora FMS is a better fit when what we need is to centralise data collection, discovery and monitoring within a single solution, both with and without agents, together with networks, applications, logs, alerts, reports, inventory, remote access and operational management.
With a monitoring platform, we have everything under one roof, without having to assemble half a dozen projects and pray that they continue communicating with one another after every version change. It is the difference between building our spacecraft piece by piece and boarding one such as Pandora FMS, which is already travelling at warp speed and also has its own fully customisable dashboards.
To compare these approaches in greater detail, here is a comparison of monitoring tools and an overview of Pandora FMS features.
The recommendation, therefore, is to answer this question honestly:
“What is the real requirement in our daily IT management?”.
We each have our own operating model, essential elements that we cannot do without, and regulations and operational requirements that determine the path we must follow, and…
- If we have a dedicated team and a well-established Prometheus ecosystem, Grafana will make the light brought to us by the Titan Prometheus, after whom the tool is named, shine brightly.
- If we want a platform that does almost everything without forcing us to become full-time integrators, we should look towards an integrated solution such as Pandora FMS or another monitoring platform.
And of course, nothing prevents us from using both, as we have seen. In fact, when there are no restrictions, this is usually the best solution.
Frequently asked questions
We have covered a great deal of ground, so let us gather the most common questions to reinforce the key points and leave with a precise understanding of the subject.
Is Grafana a monitoring tool?
Not by itself, but it can form part of a monitoring system, providing alerting, exploration and visualisation capabilities. To do so, it needs sources that supply the data, since Grafana alone does not monitor anything.
Does Grafana store data?
Normally, it does not. What it does is query data stored in external systems. Some products within its ecosystem, such as Loki, Tempo or Mimir, do provide storage backends. That applies to telemetry, which is what 90% of people mean when they ask that question. Grafana’s own configuration is another matter, because dashboards, users, permissions and alert rules are stored in an internal Grafana database, which uses SQLite by default but can also use MySQL or PostgreSQL.
Is Grafana free?
Grafana OSS is open source, and we can use it without paying licence fees, while always considering what deploying open-source software entails and the fact that, for any support we may need afterwards, we will depend on our own ingenuity and the community. Enterprise and Cloud editions are also available. These are paid versions with additional features and support, ideal for companies that absolutely require reliable assistance when challenges arise.
Does Grafana work without Prometheus?
Yes. Prometheus is a very popular data source, but Grafana also supports databases, cloud platforms and other monitoring systems without any difficulty.
What is the difference between Grafana and a dashboard?
Grafana is the platform, while a dashboard is an organised collection of panels and visualisations within it. The platform contains the dashboards, but not the other way around.
Can Grafana monitor networks?
Once again, it is important to clarify the concepts. Grafana can visualise and alert on network data when it receives information from a suitable source, but it does not include all the features of a dedicated network monitoring platform by default.
Conclusion
Let us step for a moment into the command centre of our IT spacecraft. There, Grafana is an extraordinary screen, the enormous main viewer on the bridge of the Enterprise, capable of displaying enemy ships, stellar phenomena or anything else we may need. In the same way, Grafana queries, explores, visualises and alerts better than almost anyone. But its value depends entirely on the sensors feeding it and the computer storing what it displays. When we provide it with good data, Grafana gives us enviable clarity. But when we feed it silence, it returns those beautifully rendered yet completely useless zeroes. That is why Grafana can serve as the interface for an entire observability ecosystem, and it performs that role brilliantly: each tool to its own speciality. What it does not do, by design, is replace a complete platform that collects, discovers, correlates and governs monitoring across every corner of our IT infrastructure. For this reason, Grafana and Pandora FMS do not compete as much as they complement each other. Pandora collects and manages data, while Grafana adds another way of viewing it, which is particularly attractive at a time when user experience is essential and those users are no longer exclusively technical. When what we need is full coverage, we will want an integrated monitoring and observability platform that does not force us to assemble the puzzle by ourselves. In that case, the yellow brick road leads us to Pandora FMS —or to any other monitoring option, since we are not afraid to measure ourselves against anyone. And if we choose Grafana, we now know exactly what that screen is looking at and what lies behind it when it lights up.

Pandora FMS’s editorial team is made up of a group of writers and IT professionals with one thing in common: their passion for computer system monitoring. Pandora FMS’s editorial team is made up of a group of writers and IT professionals with one thing in common: their passion for computer system monitoring.