




- What is a log?
- What logs are used for
- Logs, metrics, events and traces: basic differences
- Most common types of logs
- Examples of logs in Windows and Linux
- Where logs are stored
- What syslog is and why it matters
- What log management is
- Why log centralization is necessary
- What log monitoring is
- Log management vs log monitoring
- Why monitor logs
- Logs and security
- Logs, compliance and business continuity
- Logs and observability
- Common challenges when working with logs
- The total cost of ownership in log management
- Best practices for managing and monitoring logs
- What a log management and monitoring tool should include
- What Amazon CloudWatch Logs is
- How Pandora FMS helps monitor logs
- Frequently asked questions
- Conclusion
“Captain’s log, stardate 47457.1.” Every time Picard said that, he was not narrating for the viewer, but leaving a record. A dated record of what happened, when and how. A log, in short, so that someone (the admiral, the next captain or a Starfleet court, because getting into trouble is unavoidable) could reconstruct the facts without having been there.
That habit is older than computing because when something goes wrong in something important, memory is not enough.
Our systems do the same thing as ancient and future captains, only at a pace no human crew could keep up with. And the fact is that a log, in essence, is nothing more than that: a text entry stamping that an event occurred.
It may not seem like much, yes… Until a production service starts running a fever on Friday at 18:00 and that log becomes the thin red line separating “I know exactly what happened” from “no idea, let’s reboot and pray”.
That habit of analogue origin is now critical infrastructure for any serious IT operation. That is why knowing what logs are, their types, where they live and how they are managed is no longer just for specialists. Troubleshooting, security, performance, audits, compliance… Almost everything that matters in our IT engine rooms depends on being able to look back and know what happened.
So here is the most complete guide to logs.
What is a log?
Let’s get the necessary dictionary step out of the way. Talking about a log or record means referring to the information that an operating system, application, service or device writes down to record an activity, error, event, access or change. It does not define how that information is stored or where, mind you, only that it is stored. The term is deliberately generic, and that is why what matters is not the container, but the content of each line. A well-formed log answers the fundamental questions of any investigation:
- Date and time: the exact when, ideally down to the second and with time zone.
- Source: which machine, service or component generated it.
- Service or application: the specific subsystem behind the message.
- Severity level: whether it is routine information, a warning or a serious error.
- User: who was behind the action (when this applies, of course).
- IP: where it originated from.
- Message: a readable description of what happened.
- Error code: an identifier that makes it possible to look up the problem in the documentation.
- Process: the PID or responsible component.
- Event or transaction identifier: the thread that makes it possible to follow an operation across several systems.
That said, not all logs come with all these fields, and that is where half of the challenges begin, because a log without a reliable timestamp or a clear source is like a witness testifying that they do not know what day it was or where they were.
What are logs used for?
The real usefulness of a log in our day-to-day work is relative, because it depends on who reads it and with what intention. That said, its main uses are shared by almost any organization:
- Detect errors before users notice them and point them out to us with their usual kindness and skill in narrating technical events.
- Investigate incidents and reconstruct the sequence of a failure.
- Audit access and know who touched what for when the finger-pointing begins.
- Analyze performance and identify bottlenecks.
- Identify configuration changes that broke something.
- Understand the real behavior of an application, which may differ from what the documentation says.
- Detect suspicious activity and possible intrusions.
- Meet security or compliance requirements.
- Reduce diagnosis and resolution times.
Here it is worth keeping one idea in mind: the same log serves very different teams with opposing needs.
The system administrator looks for why the service went down, security looks for who entered without permission, audit looks to prove that the process was followed, and DevOps examines why the latest deployment doubled latencies.
Same line of text and four different readings, which is why designing log management with only one of those readings in mind means falling short.
Logs, metrics, events and traces: basic differences
Let’s clear up common confusion, because logs almost never work alone, nor should they. In a modern IT management strategy, they coexist with three other data sources, and mixing them up mentally leads to bad decisions.
- Logs: detailed text records of activities, errors or changes. They answer “what happened and in what detail”.
- Metrics: numerical values measured over time (CPU usage, latency…). They answer “how much”.
- Events: relevant state changes (a service starting, a disk filling up…). They answer “what changed”.
- Traces: the complete path of a request across several services. They answer “where did it go through”.
The trap, and those bad decisions, are hidden in believing that logs alone are enough, because they provide rich context, true, but a log tells us that a request failed without telling us that it spent three seconds in a saturated database that had been asking for help for an hour through metrics because its memory was full.
That is why logs are an essential source of observability, but not the only one.
Most common types of logs
There is no single type of log, just as there is no single type of challenge, so classifying them makes it possible to decide which ones to collect first and in what level of detail.
- System logs: records from the OS, services, boot process, kernel, processes and general errors. The core telemetry that tells us that tells us the basic health of the machine.
- Application logs: errors, warnings, transactions, exceptions and internal software behavior. What our own code has to tell us.
- Security logs: login attempts, denied access, permission changes, privilege escalations and anomalous activity. The guard’s patrol reporting how the perimeter is doing, whether it is being hit or whether enemies have slipped behind the lines.
- Access logs: HTTP requests, users, IPs, response codes, paths, user agents and response times. The who’s who and when of those using our infrastructure, whether humans or processes.
- Audit logs: relevant changes, administrative operations and actions by privileged users. This is the chain of custody and is essential in incidents or strict regulatory requirements.
- Network logs: records from firewalls, routers, switches, VPN, DNS and accepted or blocked connections. These scrolls are essential when cross-referenced with network monitoring.
- Database logs: slow queries, errors, connections, locks, replication and configuration changes, which vary depending on the types of databases in use.
- Cloud logs: records from cloud services, APIs, IAM, storage, compute, load balancers and managed services.
- Container and Kubernetes logs: records from pods, containers, nodes, orchestration events and deployment failures, ephemeral by nature and, therefore, especially treacherous.
Now, this list, rather than being academic, is the inventory that, sooner or later, someone will be staring at at three in the morning with bloodshot eyes.
Examples of logs in Windows and Linux
Theory is great, and then day-to-day operations come along to laugh at it, so let’s make it practical with two systems almost everyone deals with daily. And which, as if our lives were not complicated enough already, represent two opposing philosophies for recording what happens.
Logs in Microsoft Windows
In Windows, logging is almost always unified in the Event Viewer or system Event Viewer.
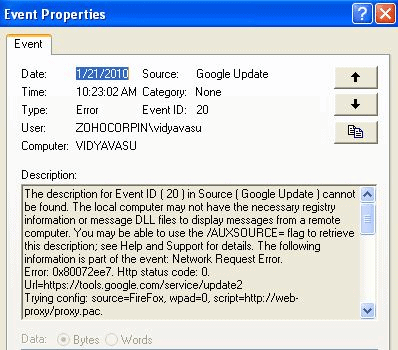
That name comes from the fact that Microsoft does not store logs as separate text files, but as system events accessed through that console or via API.
Each event is classified into categories (mainly system, security and application), with its criticality level, source, event ID and description.
In Windows, everything is ordered, centralized on the machine itself and reasonably predictable for what we usually see in IT.
Logs in Linux (and Unix)
In Linux (and I am also including its Unix cousin here), things are more chaotic but, paradoxically, more convenient. There is not a single log here, but many logs in different formats, yet with one key characteristic: almost all of them are plain text accessible with any tool. They live in the /var/log directory, and this is what a real Linux log looks like, the /var/log/messages from a server that, by chance, we call cylon3 because whoever built it knew that, deep down, any sufficiently complex machine eventually develops a mind of its own: Nov 17 04:19:52 cylon3 systemd: Stopping The Apache HTTP Server… Nov 17 04:19:53 cylon3 systemd: Stopped The Apache HTTP Server. Nov 17 04:19:54 cylon3 systemd: Starting The Apache HTTP Server… Nov 17 04:19:54 cylon3 httpd: AH00558: httpd: Could not reliably determine the server’s fully qualified domain name, using fe80::4637:e6ff:fedd:fa27. Set the ‘ServerName’ directive globally to suppress this message Nov 17 04:19:54 cylon3 systemd: Started The Apache HTTP Server. Nov 17 04:20:41 cylon3 yum[26424]: Installed: php-imap-7.3.24-1.el7.remi.x86_64 Nov 17 05:01:01 cylon3 systemd: Started Session 71 of user root. In just a few lines we have:
- An Apache restart.
- A configuration warning.
- A package installation.
- A root session.
A whole narrative in just a few lines.
Some of the logs that should be present in almost any Linux system (here with their Red Hat family names; in Debian/Ubuntu the equivalents are syslog, auth.log and mail.log) are:
- /var/log/messages: generic system records. Many applications dump their messages here through syslog (which we will see shortly).
- /var/log/secure: system logins, su, etc. Failed attempts appear as invalid password or authentication failure and are pure gold for detecting detecting brute-force spraying.
- /var/log/dmesg: what the kernel generates during boot, even before syslog is available to capture it.
- /var/log/maillog: the mail-sending log of the local subsystem (Postfix, sendmail or other MTAs that speak SMTP).
- /var/log/pandora/pandora_agent.log: the Pandora FMS monitoring agent log if you have it installed, reporting each execution and any possible issues in it.
- /var/log/httpd/access_log: the log of an HTTP server such as Apache.
In modern systems, in addition, much of this goes through journald / systemd, which structures records in a binary format that can be queried with journalctl.
The philosophy changes quite a lot compared to Windows, but the intention does not: to keep a record of everything worth remembering.
Where logs are stored
From the above, it follows that the “where” of a log depends entirely on the system and the environment, and that dispersion is the challenge to solve, because logs may end up in:
- Local files on the machine itself.
- The Event Viewer in Windows.
- The directory /var/log in Linux.
- journald / systemd in systems with that architecture.
- Application-specific logs, in their own particular paths.
- Cloud services, each with its own console.
- Containers and orchestrators, where storage, by design, is ephemeral.
- Centralized platforms for log management.
- SIEM or observability systems.
As we can see, the first uncomfortable truth of this topic appears. By default, our logs are scattered everywhere and nothing has the full picture.
What syslog is and why it matters
This chaos of formats and locations was already making life difficult for the first sysadmins, so the oldest attempt to bring order soon appeared: syslog, which is both a standard and a protocol for recording messages and sending them to a common destination. Born from the long-bearded world of Unix, it expanded to network devices and today it is spoken by everything from a router to a firewall, as well as half the data center.
Its value lies in two concepts:
- Severity, on the one hand, which classifies each message, from simple debug to the emergency that brings the system down.
- Facility, or where it comes from, indicating which subsystem originated it (the kernel, mail, authentication…).
With these two axes, messages from different sources become comparable and routable. The current standard, by the way, is described in RFC 5424 for the more curious.
What is truly useful about syslog is that it allows each device to send its messages to a central syslog server, that kind of global navigation log, instead of storing them only locally.
And that apparently minor gesture of sending instead of storing is the seed of everything that comes next.
What is log management?
Our real challenge is managing logs, because collecting them is trivial. That is why log management is the complete process of taking records from very different sources and turning them into something searchable and useful.
So that those two words do not remain an empty statement, this involves, at the very least:
- Collecting from multiple sources.
- Centralizing in a common point.
- Storing with clear criteria.
- Normalizing heterogeneous formats.
- Indexing so that real searches are possible.
- Searching and analyzing without dying in the attempt.
- Retaining and protecting according to policies.
- Generating alerts on what matters.
- Correlating logs with each other and with other sources.
Almost nothing, which is why the usual confusion is believing that log management means logging into each server via SSH to read files with tail and grep.
That worked when we had five machines named after planets, but in a modern environment we are talking about systems, applications, networks, databases, devices, containers and cloud services generating records at the same time.
Reviewing them manually is the road to the psychiatric ward.
Why log centralization is necessary
In Borges’ Library of Babel, the legendary Argentinian writer described a mythical place containing every possible book, from the deepest wisdom to endless gibberish. Everything said and yet to be said was there, but in practice, finding what mattered was impossible.
Logs scattered across a hundred servers are that Library of Babel. They exist, but hidden away they are useless.
Centralizing records in one place changes the rules and makes it possible to:
- Search across multiple systems from a single place.
- Detect patterns across sources that, separately, say nothing, but together form the puzzle of what we should know.
- Improve auditing and cross-system traceability.
- Facilitate incident investigation.
- Avoid information loss if a machine goes down or is reinstalled.
- Preserve evidence against local deletion or tampering.
- Correlate logs with metrics and events.
- Reduce diagnosis times.
- Eliminate silos and provide cross-cutting visibility.
As Pandora FMS material on infrastructure records rightly points out, fragmented logs create information gaps that become costly at the worst possible time: during an audit, a security incident or a continuity crisis.
That is why having logs scattered around like a teenager’s bedroom is a blind spot with a countdown to explosion.
What is log monitoring?
Storing logs and monitoring them is not the same thing. The former without the latter is like having security cameras with nobody watching the screens. Log monitoring implies a proactive approach that includes:
- Collecting them continuously.
- Analyzing them almost in real time.
- Looking for patterns and deviations.
- Detecting errors as soon as they show their face.
- Generating alerts that are actionable, not just noisy.
- Correlating them with metrics, events and infrastructure status so that the pieces reveal the full puzzle picture.
- Identifying anomalies that no fixed threshold can capture.
- Triggering responses that are operational, manual or automatic.
Otherwise, when the customer calls because something “is not working”, it will be time to put on the archaeologist uniform and start digging.
Log management vs log monitoring
Managing logs is not the same as monitoring them either, although they go hand in hand. However, it is worth separating these concepts because they solve different needs and are evaluated with different criteria.
Log management deals with the data lifecycle, which includes: storage, retention, search, indexing, compliance, centralization and access control.
Let’s say it means having our Library of Babel properly catalogued.
Log monitoring deals with reaction. Alerts, error detection, rules, correlation, reducing times or detecting anomalies all belong to this area.
Here we could say it is the librarian who warns you when someone tries to take a book they should not.
That is why both are needed. Otherwise, management without monitoring is a dead archive (a dusty library), and monitoring without management is noise without memory (like Borges’ librarians going mad because they do not know where to find the right book among the infinite chaos).
Why monitor logs
If I had to justify the investment in monitoring to the bean-counters holding the purse strings, the reasons I would give are as concrete as they are measurable:
- Detect errors before they affect the end user (and, by extension, costs).
- Reduce MTTR, the mean time to resolution, which is where the money is truly felt.
- Investigate incidents with data rather than assumptions.
- Detect suspicious access and possible intrusions.
- Audit changes and finally know who is breaking everything.
- Identify performance issues before they escalate into errors and costs.
- Correlate failures across apparently disconnected systems.
- Meet regulatory requirements.
- Detect recurring patterns that reveal underlying issues.
- Assess impacts and root causes of an incident that has already been closed.
Monitoring logs can mean finding out first ourselves or finding out through the customer, an option that is far too expensive.
Logs and security
Security lives and dies by logs, and our own particular police force will only be as good as the clues it has.
Records are the main source for auditing, detecting unauthorized access, forensic analysis, feeding a SIEM, investigating anomalies, regulatory compliance…
And here we return to cylon3, because time is a flat circle, as Rust Cohle said in True Detective.
The first thing a competent malicious actor does is erase their traces in local logs, exactly like an infiltrated Cylon blends in with the crew and removes any trace of their arrival and origin.
If our logs only live on the compromised machine, we have just lost the only evidence of what happened, and the paranoia so well depicted in Battlestar Galactica about who is the Cylon begins.
But centralization keeps key logs safe.
The attacker may clean up locally, but the copy has already traveled to a server they do not control. And I do not want to veer too far into security, but it is enough to keep this idea in mind: an unprotected log is evidence that the accused can destroy.
Logs, compliance and business continuity
Logs are not just technical ammunition. With the way legislation is evolving, they increasingly answer questions from audit, management or regulators, where “Hmmmm I think it happened like that” is not acceptable.
When something happens, someone with little patience eventually asks:
- What happened.
- When.
- Which system was affected.
- Which user (or process) was involved.
- What impact it had.
- What evidence exists for all of the above.
Pandora FMS’s whitepaper on infrastructure records puts forward a thesis worth internalizing: the person responsible for infrastructure is measured both by their ability to keep systems running and by their capacity to deliver reliable information on time when another area needs it.
That promotes us from plumbers to providers of documented truth, which in our trade means logs.
Logs and observability
An isolated log tells us what failed, but it rarely tells us why. That is why records maximize their value when combined with the rest of the signals in an observability strategy that includes:
- Metrics showing trends.
- Events marking state changes.
- Traces that reconstruct the path of a request.
- Dashboards that combine everything on one screen.
- Alerts that warn in time.
- Topology and dependencies explaining what affects what.
Let’s imagine the bridge of the Enterprise (of course). When something fails in the warp core, La Forge does not just stare at a single console. He cross-checks the temperature reading with the energy flow, sensor status and the security alert. Only then does he know whether he has an engineering issue or sabotage.
Logs are one of those readings, but flying the ship with only one of them is the perfect recipe for crashing into something that had been warning us from another screen for quite some time.
Common challenges when working with logs
If you have been in this field for a while, you know the challenge is rarely a lack of logs. It is the excess, the disorder and the cost of dealing with both that creates challenges such as:
- Too much volume and noise burying the signal.
- False positives that erode our trust in alerts.
- Heterogeneous formats and lack of normalization.
- Storage costs and poorly defined retention policies.
- Privacy and sensitive data that should not be where they are.
- Lack of context to interpret an isolated message.
- Difficulty correlating different sources.
- Incomplete or poorly structured logs.
- Staff turnover that walks out with its severance pay and key knowledge in its head.
- Maintenance of self-managed solutions that devour time.
- Hidden costs of operation and dependency on scattered tools.
The truth is that Pandora FMS material on log collection summarizes it with unusual honesty, making it clear that the challenge is managing the volume, sources, cost and complexity of logs without the project becoming unviable halfway through. Collecting records itself is easy, and collecting them all just in case is returning to the Library of Babel.
The total cost of ownership in log management
When we budget for a log solution, we usually look at two figures: licenses and storage. That is where the favorite human pastime begins, self-deception, because the real cost, the TCO or total cost of ownership, includes much more:
- Initial installation and configuration.
- Continuous maintenance and updates.
- Team training and the cost of staff turnover.
- Time devoted to searches and incidents.
- Long-term storage and retention.
- The cost of errors not detected in time, the highest one and the one nobody writes down in the spreadsheet.
The eternal temptation of the “free” solution goes off the rails here, because a tool with no license cost but two full-time people maintaining it is the most expensive free thing in the world, with the cost simply moved to another column.
TCO is therefore a decision criterion, and using it well prevents extremes such as buying a cannon to kill mosquitoes or, above all, buying the cheap option that ends up costing a kidney in hours.
Best practices for managing and monitoring logs
Finally, some good news: there is no need to reinvent anything, because best practices are fairly well agreed upon and many are included in resources such as the OWASP Logging Cheat Sheet.
Here are the essential ones:
- Inventory log sources before touching anything.
- Define owners: each log with its responsible party.
- Classify by criticality, centralizing only what is relevant.
- Establish severity levels that are consistent across systems.
- Avoid storing sensitive information that is no longer necessary.
- Apply retention policies aligned with regulations and actual needs.
- Normalize formats whenever possible.
- Use actionable alerts and fight alert fatigue mercilessly.
- Correlate logs with metrics, events and traces.
- Review recurring patterns and periodically test searches and alerts.
- Review access permissions to logs, which are also a sensitive asset.
- Evaluate TCO before choosing a tool.
- Avoid capturing “everything” without a strategy behind it.
Careful, because the most subtle trap on this list is the last one.
Capturing everything gives us a false sense of control while driving up costs and burying the signal. More logs does not mean more visibility; sometimes it means exactly the opposite.
What a log management and monitoring tool should include
With a market that changes every quarter and rankings that age as badly as we do in IT, it is impossible to produce a product comparison that stands the test of time.
That is why a list of technical criteria is more useful for judging any candidate ourselves, whether Splunk, Pandora FMS or any other log management and monitoring platform.
So, a good tool should offer:
- Collection from multiple sources and native syslog support.
- Coverage for Windows, Linux, network, cloud and application environments.
- Fast search and indexing capabilities, truly fast.
- Useful configurable alerts and dashboards.
- Reports adapted to different audiences.
- Configurable retention and normalization of formats.
- Granular permission control.
- Correlation with metrics and events.
- Integration with SIEM, monitoring or observability.
- Scalability and cost control.
- Ease of operation for IT, NOC, SOC and MSP teams.
The balance between the items on this list is essential, because if a tool shines in one area while casting a shadow over the others, we will fall for the tool that made the most noise in the demo instead of the most suitable one.
What is Amazon CloudWatch Logs?
Let’s move up to the cloud, where a concrete example of cloud logs is Amazon CloudWatch Logs, the AWS service for monitoring and storing logs. It collects logs from Amazon EC2 instances, AWS CloudTrail, Route 53 and other sources in the Amazon environment, centralizing them in a single highly scalable service.
Its proposal is the one we have already described, but at cloud scale: viewing all records as a single flow ordered by date, searching for patterns or error codes, filtering by content, grouping by fields and archiving securely for later analysis.
It also makes it possible to export that data so that other platforms can manage it externally.
It makes perfect sense when much of our infrastructure already lives in AWS and we want to keep our records within the same environment.
As we can see, no magic and no black box, just pure log centralization applied to a specific provider.
How Pandora FMS helps monitor logs
At this point, the natural question is how to bring this down to earth without building a five-tool Frankenstein.
Pandora FMS approaches logs as another part of monitoring and not as a separate product, and that is its main difference.
Monitoring platforms can collect, analyze and generate alerts from logs, as well as correlate them with metrics and events.
That is where Pandora FMS shines by providing:
- Collection and monitoring of logs from multiple sources.
- Centralization of scattered records in a single point.
- Alert generation based on patterns and not only fixed thresholds.
- Correlation with events and infrastructure status.
- Reports for technical, security and compliance teams.
- Retrospective analysis to investigate incidents that have already occurred.
- Relationship with metrics from systems, applications and networks.
- Real operational value for IT, NOC, SOC and MSP teams.
- Support for reducing diagnosis times.
- Centralized visibility together with the rest of the monitored elements.
And now it is worth being honest, because there is already a queue of people selling smoke.
Pandora FMS does not “guarantee” that you will capture every piece of data or that you will be safe from everything. No serious tool does that, and it is better to run away from anyone who promises it.
What it does allow is to centralize, correlate and alert on your logs within the same place where you already look at everything else, which is exactly what prevents that lost context when jumping between tabs.
The convenience of having logs connected to everything else instead of living on an island can also be based on our own material on log collection, designed so that the project does not become unviable due to volume or cost.
Frequently asked questions
We have covered a lot, I know, so let’s refresh the key questions.
What is a log in computing?
An entry generated by a system, application, service or device to record an activity, error, event, access or change. It will usually include a date, source and message.
What are logs used for?
For countless things such as detecting errors, investigating incidents, auditing access, analyzing performance, meeting regulatory requirements and reducing diagnosis times.
What types of logs exist?
Many, again. System, application, security, access, audit, network, database, cloud and container or Kubernetes logs… Among others.
What is the difference between logs and events?
A log is a detailed record of an activity, while an event is a relevant state change. So, an event can generate a log, but not every log necessarily describes a state change.
What is the difference between log management and log monitoring?
Log management covers the complete data lifecycle (storing, retaining, searching, centralizing), while log monitoring covers reaction, whether alerting, responding…
What is syslog?
A standard and protocol for recording and sending log messages, with severity levels and facility. It is widely used in Unix, Linux and network devices to centralize records.
Where are logs stored in Linux?
Mainly in the /var/log directory (with files such as messages, secure or dmesg). In modern systems, they are also stored in journald / systemd.
Where can logs be viewed in Windows?
In the Event Viewer or system Event Viewer, where we will find them organized mainly into system, security and application categories.
Why are logs important in security?
Because they make it possible to audit access, detect intrusions, perform forensic analysis and preserve evidence. Especially if they are centralized and protected from local deletion, like the kind a competent malicious actor performs right away.
Which logs should be monitored first?
Security and authentication logs, of course, plus system logs on critical machines and application logs for those that support the business. The criterion is: “Critical first, abundant later”.
What should a log management tool include?
To meet the demands of today’s IT management: multi-source collection, syslog support, search and indexing, alerts, dashboards, configurable retention, normalization, permission control, correlation and cost control.
Conclusion
To finish, let’s return to the captain’s log with which we began this episode. The ship may cross a thousand star systems without incident, but on the day something goes wrong, that log is what separates a rigorous investigation from a shrug. Logs are exactly the same for an IT infrastructure, the most direct source for knowing what happened, when and because of what. Managing and monitoring them properly makes it possible to detect errors before they escalate, investigate incidents with data and not just suspicions, strengthen security, reduce resolution times, provide evidence during audits and place each challenge in its proper context, within an observability strategy. Doing it badly (or not doing it at all) leaves our operation at the mercy of the memory of whoever is on call. And memory, in deep space or in production, always fails at the worst possible moment.

Sancho is the one who created and founded Pandora FMS. Among his many hobbies, besides technology and the internet in general, is reading, playing the guitar and sports like fencing or boxing. In his personal blog he dares to write about business and technology issues when he has the time, which is almost never the case.