


What is an SLA?
A Service Level Agreement (SLA) is a document that details the expected level of service guaranteed by a vendor or product. This document generally sets out metrics such as uptime expectations and any payoffs if these levels are not met.
For example, if a provider advertises an uptime of 99.9% and exceeds 43 minutes and 50 seconds of service downtime, technically the SLA has been breached and the customer may be entitled to some type of remuneration depending on the agreement.
What do we want SLAs for?
A Service Level Agreement (SLA) specifies the quality of a service. It is a way of defining the limit of failures or times in which the response to a service is measured. Each service measures its quality in a different way, but in all cases it refers to times, and therefore it can be measured.
For example, if you worked in a restaurant, you would define your customer service SLA with several parameters:
- Maximum time since a customer sits at the table and is served by a waiter.
- Maximum time since you order the drink and it is served to you.
- Maximum time since requesting the bill and paying.
Suppose that in our restaurant, we consider that the most important thing is the initial attention, and that no more than 60 seconds can go by, from when you sit down to when you are served. If we had a fully sensorized business with IoT technology, we could measure the time from when the customer sits at a table until a waiter approaches the table.
That way, we could measure the number of times each waiter manages to serve a customer in the established time. The way to do it can be more or less simple, but let’s keep it simple, suppose that every time they do it in less than 60 seconds they comply and when they do not make it, they do not comply. So if out of ten clients they serve in an hour, they fail only with two, they would be 80% compliant. We could make the average of their entire work day and thus easily compare different employees to find out which one has more “quality” in the metric of “serving a customer when they sit down.”
If we use a monitoring system, we could notify their manager every time that the overall quality of the service drops below 80% and by generating automatic reports, we could each month reward those with the best service compliance percentage and take measures (or fire) for those who are doing it worst.
One of the most important functions of monitoring systems is to measure. And measuring service compliance is essential if we care about quality. Whether we are on the provider side or on the client side.
If you are paying for a service, wouldn’t you like to check that you are actually getting what you pay for?
Sometimes we do well not to trust the measurements of others, and it is necessary to check it for “ourselves.” For this, monitoring tools such as Pandora FMS are essential.
What is the «uptime» or activity time?
Uptime is the amount of time that a service is available and operational. It is generally the most important metric for a website, online service, or web-based provider. Sometimes uptime is mistaken with SLA, but uptime is nothing more than a very common metric in online services that is used to measure SLAs, not an SLA, which as we have seen before is something much broader.
The trade-off is downtime – the amount of time a service is unavailable.
Uptime is usually expressed as a percentage, such as “99.9%”, over a specified period of time (usually one month). For example, an uptime of 99.9% equals 43 minutes and 50 seconds of inactivity.
What are the typical metrics of a supplier?
Those that are agreed between the supplier and the client. Each service will have its own metrics and indicators. Thus, in our Monitoring as a Service (MAAS) we can establish several parameters to be measured, among others, let’s see some of them to better understand how to «measure the service quality» through SLA:
- Minimum response time to a new incident, 1 hr in standard service.
- Critical incident resolution time: 6 hours in standard service.
- Service availability time, 99.932% in the standard service.
When we talk about a time percentage, it generally refers to the annual calculation, so 99.932% corresponds to a total of 5h 57m 38s of service shutdown in a year. We can use our SLA calculator (below to test other percentages).
On the contrary, 1hr would be the inverse calculation, and for this we can use online tools such as uptime.is. By using it we will get that six hours would correspond to:
- Weekly reporting: 99.405 %
- Monthly reporting: 99.863 %
- Quarterly reporting: 99.954 %
- Yearly reporting: 99.989 %
Similarly to the initial waiter example, we can measure compliance with a support SLA by measuring the sum of several factors, if all are met, we are meeting the SLA, otherwise we’re not. This is how Pandora ITSM measures it, the helpdesk component integrated in Pandora FMS. Pandora FMS clients use Pandora ITSM for support, and thanks to it we can ensure that we attend to client requests on time.
How to calculate the service SLA time?
Use our online calculator to calculate a service downtime. For example, test 99.99% to see the maximum downtime for a day, a month, or the entire year.
How can Pandora FMS help with SLAs?
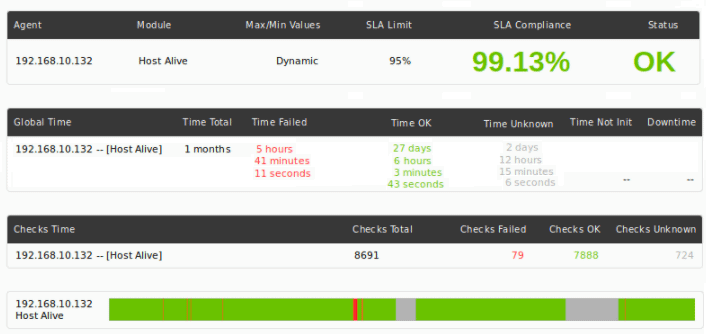
Pandora FMS has different tools to exhaustively control the SLAs of your client/supplier. You have SLA reports segmented by hours, days or weeks. That way you can visually assess where the defaults are.
This is an example of an SLA report in a custom time range (one month) with bands by ranges of a few minutes.
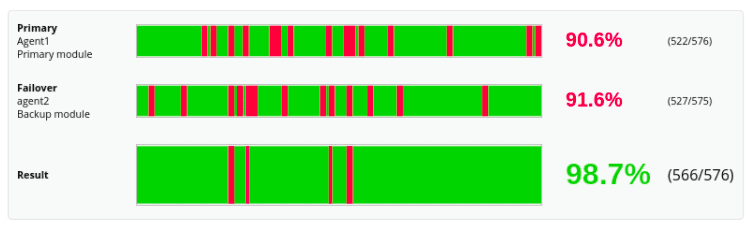
There are reports prepared to show the case of information sources with backup so that you can find out the availability of the service from the customer’s point of view and from the internal point of view:
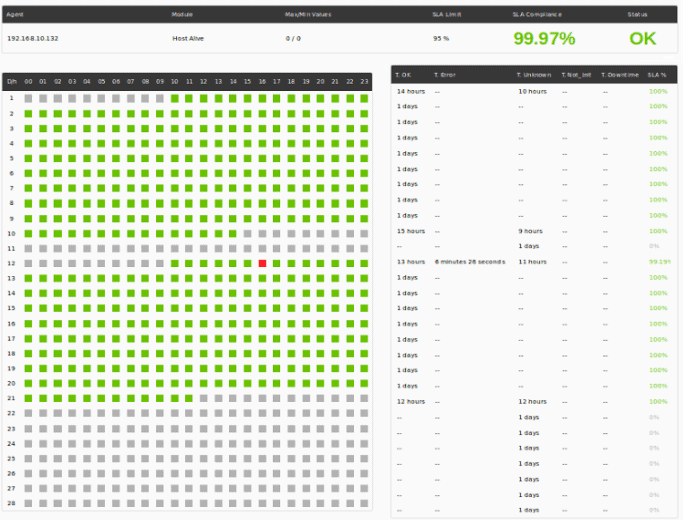
This is an example of a monthly SLA view with detail by hours and days:
This is an example of a monthly SLA report view with a weekly view and daily detail:

This is an example of an SLA report view by months, with simple views by days:

Service monitoring
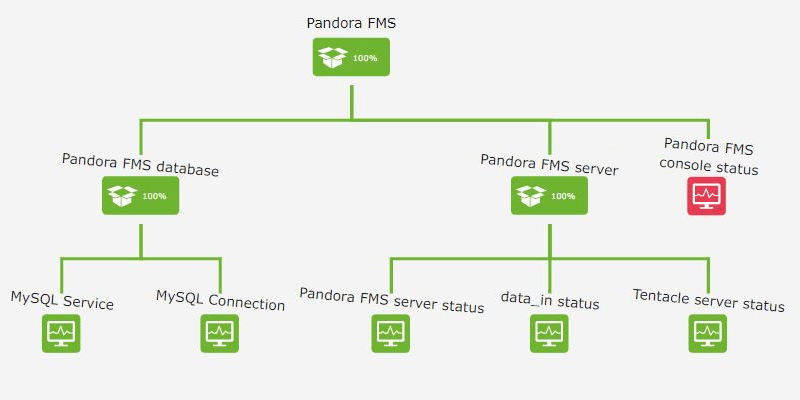
One of the most advanced functions of Pandora FMS is monitoring services with Pandora FMS. It is used to continuously monitor the status of a service, which, as we have seen at the beginning, is made up of a set of indicators or metrics. This service often has a series of dependencies and weightings (there are things more important than others) and all services have a certain tolerance or margin, especially if they are made up of many elements and some of these are redundant.
The best example is a cluster, where if you have ten servers, you know that the system works perfectly with seven of them. So the service as such can be operational with one, two or up to three machines failing.
In other cases, a service may have non-critical elements, which are part of the service and that we want to control, even if the service is not affected:
One of the advantages of service monitoring is that you can easily get the route to failure, literally being able to find the needle in the haystack. When you talk about technology, the source of a problem can be somewhat tiny compared to the amount of data you receive. Services help us determine the source of the problem and isolate ourselves from informational noise. They also allow to monitor the degree of service compliance in real time and take action before the quality of the service for a customer is affected.
Sancho is the one who created and founded Pandora FMS. Among his many hobbies, besides technology and the internet in general, is reading, playing the guitar and sports like fencing or boxing. In his personal blog he dares to write about business and technology issues when he has the time, which is almost never the case.


