Augmentez la puissance de votre surveillance. Pandora FMS s’intègre aux principales plateformes et solutions cloud.
Helpdesk puissant et flexible pour les équipes d’assistance et de service à la clientèle, aligné sur les processus de la bibliothèque d’infrastructure des technologies de l’information (ITIL).
An extensive collection from detailed guides that break down complex topics to insightful whitepapers that offer a deep dive into the technology behind our software.
Expande el poder de tu monitorización. Pandora FMS es flexible y se integra con las principales plataformas y soluciones en la nube.
Potente y Flexible Helpdesk para equipos de soporte y atención al cliente, alineado con los procesos de Biblioteca de Infraestructura de Tecnologías de Información (ITIL).
Software developers and vendors from all over the world are under attack by cybercriminals. It’s not that we’re at a time of year when they’re out and about, barricaded in front of offices with their malicious laptops seeking to blow everything up, no. They’re always out there actually, trying to breach information security, and in this article we’re going to give you a bit of advice on how to deal with them.
No one is safe from all kinds of threats
Whether it’s a half-assed attack or sophisticated and destructive one (as it happen to our competitors from Solarwinds and Kaseya) evil never rests. The entire industry faces an increasingly infuriating threat landscape. We almost always wake up to some news of an unforeseen cyberattack that brings with it the consequent wave of rushed and necessary updates to make sure our system is safe… And no one is spared, true giants have fallen victims. The complexity of today’s software ecosystem means that a vulnerability in a small library could end up affecting hundreds of applications. It happened in the past (openssh, openssl, zlib, glibc…) and it will continue to do so.
As we highlighted, these attacks can be very sophisticated or they can be the result of a combination of third-party weaknesses that compromise customers, not because of the software, but because of some of the components of their environment. This is why IT professionals should require for their software vendors to take security seriously, both from an engineering and vulnerability management standpoint.
We repeat: No one is safe from all threats. The software vendor that yesterday took business away from others may very likely be tomorrow’s new victim. Yes, the other day it was Kaseya, tomorrow it could be us. No matter what we do, there is no such thing as 100% security, no one can guarantee it. The point is not to prevent something bad from happening, the point is how you manage that situation and get out of it.
Pandora FMS and Sgsi Iso 27001
Any software vendor can be attacked and that each vendor must take the necessary additional measures to protect themselves and their users. Pandora FMS encourages our current and future customers to ask their vendors to pay more attention in this regard. Ourselves included.
Pandora FMS has always taken security very seriously, so much so that for years we have had a public policy of “Vulnerability disclosure policy” and Artica PFMS as a company, is certified in ISO 27001. We periodically pass code audit tools and maintain locally some modified versions of common libraries.
In 2021, in view of the demand in the area of security, we decided to go one step further, and to become CNA of CVE to provide a much more direct response to software vulnerabilities reported by independent auditors.
PFMS Decalogue for better information security
When a customer asks us if Pandora FMS is safe, sometimes we remind them of all this information, but it’s not enough. That’s why today we want to go further and elaborate a decalogue of revealing questions on the subject. Yes, because some software developers take security a little more seriously than others. Don’t worry, these questions and their corresponding answers apply to both Microsoft and John’s Software. Because security doesn’t distinguish between big, small, shy or marketing experts.
Is there a specific space for security within your software lifecycle?
At Pandora FMS we have an AGILE philosophy with releases every four weeks, and we have a specific category for security tickets. These have a different priority, a different validation cycle (Q/A) and of course, a totally different management, since they involve external actors in some cases (CVE through).
Is your CICD and code versioning system located in a secure environment and do you have specific security measures in place to secure it?
We use Gitlab internally, on a server in our physical offices in Madrid. It is accessed by people with a first and last name, and a unique username and password. No matter which country they are in, their access via VPN is individually controlled and this server cannot be accessed in any other way. Our office is protected by a biometric access system and the server room with a key that only two people have.
Does the developer have an ISMS (Security Incident Management System) in place?
Artica PFMS; the company behind Pandora FMS has been ISO 27001 certified almost since its inception. Our first certification was in 2009. ISO 27001 certifies that there is an ISMS as such in the organization.
Does the developer have a contingency plan?
Not only do we have one, but we have had to use it several times. With COVID we went from working 40 people in an office in Gran Via (Madrid) to working at home. We have had power failures (for weeks), server fires and many other incidents that have put us to the test.
Does the developer have a security incident communication plan that includes its customers?
It has not happened many times, but we have had to release some urgent security patches, and we have notified our customers in a timely manner.
Is there atomic and nominal traceability on code changes?
The good thing about code repositories, such as GIT, is that this kind of issues have been solved for a long time. It is impossible to develop software in a professional way today if tools like GIT are not fully integrated into the organization, and not only the development team, but also the Q/A team, support, engineering…
Do you have a reliable system for distributing updates with digital signatures?
Our update system (Update Manager) distributes packages with digital signature. It is a private system, properly secured and with its own technology.
Do you have an open public vulnerability disclosure policy?
Do you have an Open Source policy that allows the customer to observe and audit the application code if necessary?
Our code is open source, anyone can review it at https://github.com/pandorafms/pandorafms. In addition, some of our customers ask us to audit the source code of the enterprise version and we are happy to do so.
Do third-party components / acquisitions meet the same standards as the other parts of the application?
Yes they do and when they do not comply we support them.
BONUS TRACK:
Does the company have any ISO Quality certification?
ISO 27001
Does the company have any specific safety certification?
National Security Scheme, basic level.
Conclusion
Pandora FMS is prepared and armed for EVERYTHING! Just kidding, as we have said, everyone in this industry is vulnerable, and of course the questions in this Decalogue are crafted with a certain cunning, after all we had solid and truthful answers prepared for them beforehand, however, the real question is, do all software vendors have answers?
If you have to monitor more than 100 devices you can also enjoy a FREE 30-day TRIAL of Pandora FMS Enterprise. Cloud or On-Premise installation, you choose!!! Get it here.
Finally, remember that if you have a small number of devices to monitor, you can use the OpenSource version of Pandora FMS. Find more information here.
Don’t hesitate to send us your questions, the great team behind Pandora FMS will be happy to help you!
The key is to understand the need for a specialized curriculum.
Too often, job seekers settle for a generic resume that they use to apply for any position, with hardly any modifications.
But here’s the hard truth:
Generic resumes rarely achieve success, especially when it comes to customer service positions!
If you really want to stand out, you need to invest time in updating and customizing your resume for each specific position you apply for.
At present, recruiters and management teams are looking for candidates who can actually demonstrate that they adapted their CV and previous experience, with the aim of showing why they are the best candidate for the position.
This means that you should write your goal, work experience, skills, and other sections of the resume from a customer service-focused perspective.
There is no room for duplicate resumes; each must be unique and outstanding.
But how can you achieve that? Don’t worry, we’re here to guide you through the process of writing a resume that will help you stand out from the crowd and get employers’ attention.
*Remember, your resume is your cover letter and a chance to showcase your passion for customer service. Get ready to impress recruiters and open the doors to a successful career in the exciting world of customer service.
For a specialized resume: highlight your most relevant experience
When it comes to addressing the “past jobs” section on your resume, it’s important that you focus on your most relevant experience rather than following the reverse chronological approach.
This strategy is especially useful when your most relevant professional experience is not your most recent position.
How should you address this situation on your resume?
Ideally, your most relevant work experience should appear first in the employment section of your resume, which means, we insist, that you should not follow the traditional reverse chronological order.
An effective way to achieve this is to divide your work experience into two sections:
“Relevant professional experience” and “Other work experience”, for example.
*Yes, I know they look like nondescript titles, but they’re super specific.
De esta manera, puedes resaltar todos tus trabajos relevantes en atención al cliente cerca de la parte superior de tu currículum, donde es más probable que los reclutadores lo noten, mientras utilizas la otra sección para mostrar que también ha tenido empleos estables en otros campos.
That way, you may highlight all of your relevant customer service jobs near the top of your resume, where recruiters are more likely to notice, while using the other section to show that you’ve had stable jobs in other fields as well.
Now, when describing your previous positions, it’s important to refresh your descriptions using industry “buzzwords.”
You know.
Keep in mind that those who review your resume probably won’t have time to read it carefully.
Instead, they will flip through it for relevant information.
This is where keywords become important.
Also, if you have experience using social media to attract customers, be sure to highlight it.
Increasingly, the ability of customer service professionals to manage companies’ social networks, such as Facebook, Twitter, Instagram, and other platforms, is being valued.
Resume customization: the road to success
In job search, each position has its own particularities and requirements.
Therefore, it is essential to tailor your resume and application for a cashier position differently than applying for a retail supervisor position.
While a cashier resume highlights your cash management and problem-solving skills, a supervisor position requires a focus on leadership and communication skills.
When you are looking for job offers in customer service and you decide to apply, one of the best strategies you can follow is to incorporate all the relevant information of the position into your resume.
*For example, if a job ad for a call center representative is looking for candidates who can work in fast-paced environments and solve conflicts, you should tailor specific parts of your resume to show how you reflect those skills.
This may include specific examples of previous roles, where you worked in high-speed environments or situations where you were entrusted with problem-solving.
The more customized your resume is for the position you’re applying for, the better your chances of receiving a call for an interview.
Also, don’t forget to highlight your past accomplishments!
One of the most common mistakes when writing a customer service resume is not emphasizing previous achievements with specific examples.
This is your time to shine, like Elsa in Frozen, and stand out from the rest of the job seekers.
If you successfully led your sales team, achieved first place in regional sales, or if you received a customer satisfaction award in a previous job, this is something you should definitely include in your resume!
Dedicate a specific section at the end of the resume to highlight special awards and recognitions, and take advantage of the spaces in each job listing to include particular examples of your accomplishments.
Highlighting your job stability and relevant training in the curriculum
In the competitive field of customer service, job stability is an increasingly valued factor by companies.
With such high turnover rates, highlighting your track record of staying in previous positions can make all the difference compared to other candidates with similar skills and experience.
If you’ve worked at a company for several years, take this opportunity to highlight your commitment and reliability on your resume.
*Devote a special section to highlighting your job stability, especially if you’ve been in a position for an extended period.
This will show potential employers that you are someone they can trust and that you have the ability to maintain a long-term relationship with a company.
In case there are gaps in your employment history of more than five years, consider including only the last five years of work experience to avoid highlighting those gaps, especially if your previous jobs are not directly related to customer service.
Also, don’t forget to mention the relevant courses and studies you’ve taken!
Even if you haven’t earned a degree, you can still list the college courses you’ve completed as “relevant courses.”
Examine the classes you have taken and select those that are relevant to customer service work.
For example, a communication course or a foreign language can be very valuable in dealing with customers who speak different languages.
Briefly explain how these courses have helped you develop specific skills in the field of customer service, such as conflict resolution and effective communication.
Resume submission and format
Proper presentation and formatting of a customer service resume are crucial elements in capturing the attention of recruiters and standing out from the competition.
It’s essential to consider both length and design to ensure your resume is effective and conveys information clearly and concisely.
First of all, you should keep in mind that recruiters usually spend little time reviewing each resume.
*Therefore, it is advisable to keep your resume on a single printed page.
Avoid the temptation to include all the details of your previous work experiences.
Instead, focus on the most relevant and outstanding aspects of your journey.
The logical format of your resume is equally important.
Start with your contact details, such as your name, phone number, email address, and home address.
Next, consider including a short statement of objectives expressing your interest in the specific position you are applying for.
This can be especially helpful when applying for a position at a company that is hiring for multiple roles simultaneously.
Subsequently, present your relevant educational and work experience, highlighting those roles and responsibilities that demonstrate your skills in customer service.
Remember to tailor this section to each position you apply for, emphasizing tasks and accomplishments that align with each employer’s specific requirements.
*A list of specific skills could also be very useful!
Include competencies that are relevant to the customer service role, such as problem-solving skills, effective communication, and focus on customer satisfaction.
Also, if you have outstanding awards or recognitions, you can mention them in a separate section to highlight your past achievements.
As for references, unless specifically requested in the application, it is not necessary to include them in your resume.
Instead, you can indicate that references will be available upon request.
Conclusions
If you are looking for an exciting and rewarding career in the field of customer service, it is important that you stand out from the crowd of applicants.
Do not settle for a generic resume, but invest time in customizing it for each position you apply for.
Remember that recruiters are looking for candidates who demonstrate that they adapted their experience and skills to customer service.
Highlight your most relevant experience and use relevant keywords to capture employers’ attention.
Customize your resume for each position, highlighting the specific skills that are required.
Don’t forget to highlight your past achievements and awards received, as this can make all the difference.
In addition, job stability and relevant training are valued aspects in the field of customer service.
Highlight your history of staying in previous positions and mention the relevant courses and studies you have taken.
Finally, pay attention to the presentation and format of your resume.
Keep it on a printed page and organize it logically.
Start with your contact details, followed by a mission statement and your relevant educational and work experience.
Highlight your skills and mention outstanding awards and recognitions in separate sections.
So get off the couch and get ready to impress recruiters and delve into the exciting world of customer service!
With a personalized and well-presented resume, you’ll be one step closer to achieving your dream career and making a difference in people’s lives every day. Just like Wonder Woman!
Good luck and come back to this article to leave a message if you made it!
It’s time, take your things and let’s move on to more modern monitoring. Relax, I know how difficult the changes are for you, but if you were able to accept the arrival of DTT and the euro, you sure got this!
When an issue requiring attention is detected, an event is triggered, which can be notified through email to the administrator or by launching an alert.
Consequently, the administrator responds according to the nature of the problem.
However, this centralized approach to monitoring requires a considerable amount of resources.
You knew it?
Due to the “pull” nature of the requests, gaps are generated in the data and these could lack sufficient granularity.
In response to this limitation, the adoption of a telemetry-based monitoring solution has emerged as a promising alternative.
The day has come: discover more modern monitoring
By making the switch to a modern approach to monitoring, you gain access to smarter and richer solutions in terms of anomaly detection.
This transition represents a great advantage in the field of system monitoring.
In addition, another compelling reason to implement modern monitoring is the growing number of systems that rely on accurate monitoring to enable automated infrastructure operations, such as scaling nodes up or down.
If monitoring fails or is not accurate enough, disruptions can arise in the expected scalability of an application.
Therefore, reliable and accurate monitoring is essential to ensure the proper functioning of the systems.
To improve the efficiency and accuracy of surveillance systems, organizations are exploring smarter, more advanced solutions.
Telemetry vs. Poll: Differences and benefits in modern system monitoring
When it comes to implementing telemetry in surveillance systems, it is important to understand the differences between the streaming and polling approaches.
While streaming telemetry can be more complex, its design offers greater scalability, evidenced by public cloud providers such as Amazon, Microsoft, and Google.
These tech giants manage millions of hosts and endpoints that require constant monitoring.
As a result, they have developed telemetry and monitoring channels with no single points of failure, enabling them to gain the level of intelligence and automation needed to operate at a great scale in their data centers.
Learning from these experiences can be invaluable when building your own monitoring solutions.
In contrast, survey-based monitoring solutions may face scalability challenges.
Increasing the polling interval for a specific performance counter increases the load on the system being monitored.
Some meters are lightweight and can be probed frequently, but other heavier meters generate significant overhead.
Consistent data transmission may appear, at first glance, to involve greater overhead compared to a polling solution.
However, thanks to technological advances, lightweight solutions have been developed.
In many cases, data flows through a flow query engine that enables outlier detection while storing all data to support trend analysis and machine learning.
This architecture is known as lambda architecture and is widely used in applications that go beyond monitoring, such as in the Internet of Things (IoT) devices and sensors.
It provides real-time alerts for values outside normal limits, while enabling cost-effective storage of recorded data, providing deeper analysis in a low-cost data warehouse.
The ability to have a large amount of recorded data allows for comprehensive analyses of transmitted values.
System monitoring: Smart approaches and machine learning for accurate alerts
In the system monitoring area, it is crucial to ensure data quality to obtain accurate and relevant alerts.
Most monitoring tools offer the ability to customize alert ranges.
*For example, you may want to receive an alert when CPU usage exceeds 80% on certain systems, while on other systems a high level of CPU usage may be part of its normal operation.
However, finding the right balance can be tricky:
On the one hand, you don’t want alerts to overwhelm administrators with irrelevant information.
On the other hand, you also don’t want to set too lax thresholds that hide critical issues in your data center.
To address this dichotomy, it is advisable to use intelligent or dynamic monitoring approaches.
These approaches capture a baseline for each system and only trigger alerts when values are outside normal limits for both the specific server and the corresponding time frame.
As more data is collected, many monitoring tools are deploying machine learning systems to perform deeper analysis of the data.
This advanced processing makes it possible to generate smarter alerts based on the specific workload of each system.
Machine learning is used to detect subtle patterns and anomalies that might go unnoticed by traditional alert rules.
However, it is important to note that it is essential to verify that these smart alerts work correctly and provide the expected alerts.
Extensive testing and result validation is necessary to ensure that alerts are generated accurately and in a timely manner.
*That way, a more efficient and reliable surveillance system will be achieved.
Monitoring continuity: Key strategies and approaches for detecting problems in systems
As your organization seeks to implement smarter monitoring, the crucial question arises:
How do we detect problems or outages in our monitoring systems?
As automation connected to these systems becomes increasingly reliant, monitoring becomes an even greater challenge.
There are several measures that can be taken to ensure monitoring continuity:
First, it is critical to create redundancy in the infrastructure, either by deploying virtual machines or leveraging platform-as-a-service (PaaS) services across different data centers or cloud regions. This ensures that, in the event of failures at a point, alternative systems are in place to support monitoring.
Another option is to establish a custom or secondary alert mechanism that verifies the status of the primary monitoring system and acts as an additional security layer.
It is also possible to implement an alert process, which generates alerts at regular intervals, and have a scaled mechanism that issues an additional alert if the process is not activated as expected.
In addition to these approaches, it is important to ensure that the alert mechanism covers all application layers and it is not limited to just one.
*For example, it is necessary to perform tests and monitoring in the web layer, the cache storage layer and the database, to detect any failure or anomaly in any of them and receive relevant alerts.
Keeping online supervision requires a proactive and solid approach in terms of architecture and strategy.
By implementing these security and verification measures, it is ensured that any problems or interruptions in monitoring systems are quickly detected and addressed, allowing a timely response to maintain the proper functioning of critical systems.
Conclusions
Taking the leap to more modern monitoring is a smart and necessary decision to ensure proper system functioning.
Although the changes may seem intimidating, remember that you survived the Ibook and egg-free mayonnaise, so this should be a piece of cake!
Telemetry is presented as a promising alternative, offering smarter solutions and more accurate anomaly detection.
In addition, the implementation of redundancy measures, custom alert mechanisms and extensive testing at all layers of the application will ensure reliable and timely monitoring.
So get ready to embrace modern monitoring and leave outdated methods behind!
Remember, in the world of monitoring, to be modern is to be more modern than the average human.
And you’re ready to be the “cool kid” of monitoring!
Do you know Pandora FMS monitoring system?
La solución de monitorización total para una completa observabilidad
Contacta el equipo de ventas, pide presupuesto o resuelve tus dudas sobre nuestras licencias.
Hello again, Pandoraphiles! Today on our beloved blog we want to introduce you to a video. You know that from time to time we do just that, don’t you? Bringing back some video from our channel, the nicest and most relevant one, no question, and break it down a little bit in writing.
All of that so that you may have the book and the audiobook, so to speak.
Well, today we are going with… drum roll:
Please accept marketing cookies to watch this video.
In this article, as in the video, we will guide you through the installation process of Pandora FMS environment, using the handy online installation script.
With this tool, you can quickly set up your system and start taking advantage of all the monitoring and management possibilities offered by Pandora FMS.
Before we begin, make sure you meet the following requirements to ensure a successful installation:
First of all, your machine must have access to the internet, since the installation script requires access to multiple URLs and official repositories of the distribution you are using.
Likewise, check if you have the “curl” command installed, which usually comes by default in most distributions.
It is important to have the recommended minimum hardware requirements, for optimal system performance.
When you are ready to start the installation, make sure to run the commands as root user.
Finally, make sure you have a compatible OS. In this case, the installation can be done on CentOS 7, Red Hat Enterprise Linux 8, or Rocky Linux 8. If you’re using a Red Hat distribution, make sure it’s activated with a license and subscribed to standard repositories.
In the specific case of this video/article, we created a machine with Rocky Linux 8.
If you already have all the other requirements, just check that you are actually running the commands as root user, and proceed with the execution of the online installation tool. This process will install the latest available version of Pandora FMS.
Installation
Now wait for the installation process to finish.
Once the installation process is completed, you will be able to access Pandora FMS console through your browser.
In the video, in addition, we present you with a valuable addition:
We will check out the environment variables that you may modify prior to installing Pandora FMS.
Among the variables that you may adjust there is:
The time zone, through the TZ variable.
The database host, as well as the database name, username, and password.
You may also specify the database port and password of the root user, which is “pandora” by default.
In addition, you are given the option to skip checking for a previous Pandora FMS installation, skip the installation of a new database, or the recommended kernel optimization.
These options allow you to adapt the installation to your specific needs.
Likewise, there are variables such as MYVER or PHPVER that allow you to define which version of MySQL and PHP you want to install.
With MySQL, you may specify “80” for MySQL 8 or “57” as the default option for MySQL 5.7. In the case of PHP, you may specify “8” for PHP8 or “7” by default for PHP7.
Continuing with the customization of Pandora FMS environment, you will also have the option to define the URLs of the RPM packages of Pandora FMS server, console and agent.
By default, these URLs point to the latest available version, ensuring that you are always using the latest improvements and bug fixes.
It is important to note that there is also the possibility to indicate whether you want to install the packages of the latest beta version available.
However, it is recommended to use this option only in test environments, as beta versions may contain experimental features and may not be as stable as stable versions.
If you want to install specific packages, this option will be automatically ignored.
Would you like to find out more about Pandora FMS?
Working in the field of software monitoring may seem boring or too technical, but let me tell you that there is more fun and excitement than one might imagine at first.
Not that we’re all day doing barbecues and celebrating, but once we almost did our very own Olympics in the office! Kind of like The Office, you know.
*Long live Michael Scott.
Anyway, join me on this journey for a day in the life of a software monitoring expert, where code lines mingle with laughter and soluble coffee.
Our protagonist, whom we will affectionately call “Captain Monitor”, will face in this pseudo-documentary of flora and fauna, a day full of technical challenges and unexpected surprises.
From the moment he opens one of his lazy, rheum-covered eyes to the moment he closes his latest generation laptop, his life is a roller coaster ride of hilarious emotions and situations.
Early morning
Let’s start with the morning rush hour, exactly when Captain Monitor faces the dreaded flood of alerts in his inbox.
While trying to classify and prioritize alerts, he comes across one that says:
“The main server has become an orchestra of mariachis who just got completely wasted, from the Tenampa Hall to Plaza Garibaldi!”
Yes, you read that right:
It turns out that a “fellow” prankster decided to play a little joke on him and change the alert tones to Lucha Reyes rancheras.
But the surprises don’t end there!
Late morning
During a team meeting, Captain Monitor discovers that his charming cubicle companion has turned his desk into a jungle of cables, pins, modems and other electronic devices…
Between the giant monitor and the stacks of hard drives, the Captain seems to be lost in a kind of modern version of Alan Parrish’s Jumanji.
No matter how much he insists that monitoring modern software doesn’t actually require a work environment of such high technological sophistication, his partner continues and continues to pull plugged-in tinkerers to mock up his particular digital fantasy world.
Early afternoon
In the midst of testing and system tweaks, Captain Monitor also faces the challenges of dealing with “forgetful users.”
Yes, that user who calls all the time with problems that could be solved with a simple reboot.
But our hero doesn’t give up easily and becomes the master of basic reset instructions.
Sometimes he even dreams, as he sleeps in the toilet at nap time, of a life where he doesn’t have to say:
“Have you tried to reboot your device yet?”
Deep Afternoon
But it’s not all chaos and micro-ulcers in the world of software monitoring. Captain Monitor, who as you guessed works in the Support Department, also has his moment of glory when he manages to detect and solve a critical problem of global scale before it causes a collapse in the system of the floral commissioning company he monitors.
In that moment of triumph he feels like he’s on the main stage of a rock concert, with the crowd cheering and the fireworks bursting on top.
“Yes, this is the life I have chosen and I like it!,” exclaims to himself.
Just before the end of the day
At the end of the day, when not all danger is over, but he starts just ignoring it anyway out of pure exhaustion, Captain Monitor relaxes and shares some funny anecdotes with his colleagues in the break room.
They all laugh their asses off and share similar stories of technical madness and tense situations with customers.
It is, more than ever, in those shared moments when Captain Monitor realizes that, despite the challenges and the three thousand crises he suffers daily, there is a special camaraderie among the experts in software monitoring.
They are a close-knit, adventurous, cool community!
Here we go again
And so, the next morning, we are confident that Captain Monitor will rise and shine with renewed energy, ready once again to face another challenging day in the exciting world of software monitoring.
Because while there may be times of frustration and stress… There is nothing quite like the satisfaction of discovering and solving problems to look good with the boss!
Put on your seatbelts, intrepid developers! In this era of technology trends and digital-first strategies, organizations are jumping on board the microservices train with Dockercontainers.
Well, it’s like a magic box that wraps your app with everything it needs to actually work, like a file system, tools, and even a roadmap to reach multiple platforms.
It’s like your software has its own travel-ready backpack!
Microservices: the new superhero team of programming
Today, developers are using Docker to build microservices, which are like the Avengers of the software world.
These microservices are small pieces of code that work together to perform specific tasks. For example, imagine a pizza chain that uses microservices to take orders, process payments, and coordinate deliveries across the country. It’s like having a league of pizza-efficient superheroes working together!
The star role of docker engine and his gang
When we talk about Docker, we can’t help but mention Docker Engine, the leader of this container gang.
Docker Engine is responsible for building and running the containers. But before you can do that, you need a Docker file.
Think of it as the script of a movie that defines everything necessary for the image of the container to come to life. Once you have the Docker File, you may build the container image, which is like the main actor running in the Docker engine.
Docker Compose and Docker Swarm: The adventure companions of Docker
The fun doesn’t end there!
Docker offers more adventure companions, such as Docker Compose and Docker Swarm. Docker Compose allows you to define and run applications in containers, like the movie director who coordinates all the scenes.
And then there is Docker Swarm, which converts a group of Docker servers into one, as if merging the Power Rangers to form a megazord. It’s every director’s dream to have a united team ready for action!
Docker Hub feast and Open Container Initiative (OCI) party
But wait, we’re not going to stop our analogies, there’s even more! Docker Hub is like a developer food buffet, filled with containerized microservices ready to be devoured.
Do you need a web server? A database? You’ll find a bit of everything here!
It’s like a party where all the main services are invited. In addition, Docker has created the Open Container Initiative to ensure that the packaging format is universal and open. It’s like ensuring that all guests follow the rules of etiquette.
AWS ECS: Amazon’s Container Management Service to the rescue!
If you are playing in the world of Amazon Web Services, you have at your disposal Amazon EC2 Container Service (ECS), which is a highly scalable and safe container management service.
With ECS, you can easily deploy and manage your microservices in Docker containers in the Amazon cloud. Imagine having a team of assistants take care of all the infrastructure and logistics, while you focus on developing and deploying your containerized applications.
Dare to build your own microservices architecture with Docker!
Now that you know the basics of Docker, microservices, and associated tools, it’s time to venture out and build your own microservices architecture with Docker.
Remember that microservices allow you to split your application into separate components, making it easy to scale and maintain.
With Docker, you can package and deploy each microservice in a container, taking full advantage of the flexibility and portability this technology offers.
Get ready for a new way to develop apps!
Docker and microservices are revolutionizing the way we develop and deploy applications.
With their modular approach, scalability, and portability, this combination has become a popular choice for many organizations.
Whether you’re building a complex enterprise application or a simple web application, consider adopting a microservices architecture with Docker to take advantage of the benefits it offers.
It’s time to take the leap and discover the exciting world of containerized applications!
Once you have built your microservices architecture with Docker, new possibilities will open up for your application development.
Here are some additional ideas for you to consider:
Container orchestration: In addition to Docker, there are tools like Kubernetes and Docker Swarm that allow you to efficiently orchestrate and manage your containers in production. These tools will help you scale your services, distribute the workload, and make sure your apps are always available.
Continuous Implementation (CI) and Continuous Delivery (CD): With Docker, you can easily integrate your microservices into a CI/CD workflow. This means you can automate the process of building, testing, and deploying your containers, streamlining the development lifecycle and allowing you to launch new features faster.
Monitoring and logging: As your applications grow in complexity and scale, it’s critical to have monitoring and logging tools in place to maintain good performance and troubleshoot issues. Tools like Prometheus, Grafana, and ELK Stack are very popular in the Docker ecosystem and will help you monitor and analyze the performance of your containers and microservices.
Security: When using Docker containers, it is important to keep security best practices in mind. Make sure to apply patches and updates regularly, use reliable and secure images, and consider using vulnerability scanning tools to identify potential issues in your container images.
Conclusions
Docker and microservices are ever-evolving technologies, and there’s always more to discover. Keep learning about new tools and approaches, participate in communities and conferences, and stay on top of the latest trends. The world of containers and microservices is full of exciting and challenging opportunities!
Would you like to find out more about Pandora FMS?
The total monitoring solution for full observability
Contact our sales team, ask for a quote or solve all of your doubts about our licenses.
Today, in those much needed training videos, we will delve into the exciting and mysterious universe of basic monitoring of computers with Linux operating systems. Ready to unlock the hidden secrets of your devices? Well, let’s go!
Please accept marketing cookies to watch this video.
Before you dive into this adventure, make sure you have Pandora FMS environment installed and running.
Done?
Well, now we will focus on how to monitor those Linux computers that allow you to install the software agent devoted to this operating system.
The first point is to install the software agent on the Linux computer you want to monitor.
For that purpose, follow a series of magic commands that will install the necessary dependencies.
Who said monitoring didn’t have its own spells?
Once dependency installation is finished, go into software agent installation.
That’s when true magic begins.
Pay attention!
Configure the agent to point to your Pandora FMS server through the “server_ip” parameter.
In addition, activate remote configuration by changing the value of the “rimout_config” parameter to 1.
If you want to give it a personal touch, you may also assign it a specific group using the “group” parameter, which is “Servers” by default.
Take advantage, here you can be the director and assign roles to your agents!
Once you’re done with all these configurations, save the changes and launch the Software Agent with the command “/etc/init.d/pandora_eiyent_deimon start”.
Can you see Linux computer monitoring coming to life?
Now you can see how your agent appears in the console of your Pandora FMS server, in section “Resources, Manage Agents“.
If you go into the main view or the module view, take a look at the information that the software agent obtains by default from Linux systems.
CPU, RAM and disk space? You won’t miss a byte!
But wait, there’s more!
You may also enable the inventory plugin for detailed information.
Just go to the agent plugins view and turn on the inventory light bulb.
Afterwards, you’ll just have to wait for the next agent interval, or if you can’t resist it, manually restart it to receive the inventory data.
The information will be within reach!
But that’s not all.
Let’s add a touch of excitement to this story!
Imagine that you receive a critical alert from your agent and need to act immediately. Don’t worry, Pandora FMS has the perfect solution!
Just go to the “Alerts, Alert List” section and click “Create”, you may create a custom alert.
Choose the agent you want to monitor, select the appropriate module (you may choose intriguing names like “Host Alive”!), and set an action to notify you by mail when the module is in “Critical” status.
Isn’t it great?
Now you can solve the most high-priority cases in the blink of an eye!
But wait, you want more secrets unraveled?
Then here is another tip for you.
Discover predefined local components and learn how to create modules from them.
Go to “Settings, Templates, Local Components” and dive into a world full of possibilities.
If you’re a Linux lover, you may filter and explore local components specific to this operating system.
Now select a local component and create a new “data server module” module. Add the local Linux component you like the most and bring your new module to life. You’ll just have to wait for the next agent interval or, if you’re impatient, manually restart it to see the results.
Conclusions
Basic Linux monitoring with Pandora FMS is not only effective, but also exciting and fun.
So don’t wait any longer, sharpen your monitoring skills and let the action begin in the world of Pandora FMS!
Remember, in the video description you will find useful links that will guide you through each step.
Today, on Pandora FMS blog, we’re going to get parabolic, not like the antennas flooding your city’s skyline corrupting the sky with their 3G poison, no. Parabolic parables. Like Yisus.
Thus, through a sweet story that your mental voice will read in a engulfed way, we will reach an incredible inflated conclusion of moral and good vibes. Let’s get there with the narration about the secret life of software!
The secret life of software: mischief and monitoring
There was once a little software called Glitchinator that worked in a boring office of a gray and monotonous building. The decoration was as exciting as a chess contest:
The air conditioning made a somewhat particular noise, something between some frozen fries thrown suddenly into the pan and a symphony orchestra that plays the same note over and over again. The rest of the software employees, CrashMaster, Crisistracker, FaultFinder… walked through the room like zombies with blank eyes.
People did not speak, only dipped their tea bags of chamomile and emitted sounds very similar to the redundant typing of a 21st century typewriter.
“If you’ve ever wanted to experience what it would be like to work in a tomb, this office is the perfect place for you.”, Glitchinator used to say.
Of course Glitchinator felt trapped in a routine of coding and programming, with no excitement or adventure in his life. It was all about washing peripherals, ironing the screen, polishing icons… and on Sunday mornings vacuuming the hard drive.
But something changed one night when all the employees went home and Glitchinator, for the first time, was left alone in the office after returning from a walk on the terrace to some files.
“Why let your files be sedentary?”
Right there gray started taking on color and Glitchinator felt free.
What to do now that no one was watching him, that no one was judging him?
Could… could… could it become a naughty show?!
“Hell yeah!”
So he went crazy. He took off his shirt, rolled up his pants and changed all the fonts in the Word documents on his partner Boris DefectDestroyer’s computer, which left him moderately baffled the next day.
Afterwards, he became emboldened and changed the icons on the desk of the boss’s PC, Mr. MalwareMangler, which left him equally confused. He always likes to have the trash icon at the top right corner of the screen.
But that wasn’t enough for Glitchi.
He wanted to do something even bolder. So he decided to pay a visit to the printer, there he lowered his pants and began to print sheets with “funny” images:
Pictures of kittens with birthday hats.
An avocado with headphones,
And a hundred memes with phrases like “I’m compiling, please don’t talk to me”, “Keep Calm and Debug On”, “Error 404: humor not found!”.
He left them scattered all over the office.
Glitchinator felt like a fish in water, at its own pace, without any restrictions. But what he didn’t know is that his secret affair wasn’t going to last that long.
The S.W.A.T. team descended through the cork panels of the office roof and pointed their open-source lethal weapons at Glitchi.
Someone made the phone call
Fortunately for Glitchi, after the illicit beating, the toughest guy among IT’s S.W.A.T. team found one of Glitchi’s “antics” somewhat amusing, I believe it was the avocado with headphones.
It was hilarious.
After the pleas and whining of the poor software, the team patted him on the shoulder and told him that it is okay to let go from time to time, to do something that breaks the immutability of daily lives, but as long as it did not endanger the security of his company to the point someone had to call the S.W.A.T.
From that good or bad afternoon, depending on how you look at it, Glitchinator became a model software, always doing what it had to do and avoiding any kind of childishness that could bring him closer to a photocopier.
He even gave up alcohol!
Conclusions
Have you been able to get a glimpse of the lessons of this extravagant parable?
We’ll give you three options.
The moral of the story is that monitoring is crucial to keeping computer programs under control. Without it, they can make dangerous roadblocks and put your company’s security at risk.
The moral of the story is that it is important to be open and willing to receive the Word of God. It also teaches us the importance of perseverance and overcoming difficulties.
The moral of the story is that we are all sinners and can make mistakes in our lives, but there is always an opportunity to repent and start over.
Want to know more about the monitoring software that can save your company from neurotic guys like Glitchinator?
The total monitoring solution for full observability
Contact our sales team, ask for a quote or solve all of your doubts about our licenses.
Pandora ITSM has a history that goes back several years. It was developed by Pandora FMS, the famous software company based in Spain. Today, Pandora ITSM has become one of the most powerful tools with extensive global experience in monitoring servers, applications and networks.
External API and automation with Pandora FMS
Both products are standalone; however, Pandora ITSM can be integrated into Pandora FMS, allowing you to leverage their combined power.
Application Programming Interface
This technology, better known by the acronym API, is the one that enables communication between Pandora ITSM and Pandora FMS, and even third-party applications.
This is achieved by using user credentials, both to perform data queries and to perform task creation and writing actions, such as incidents.
Since security is a fundamental aspect, the API has two additional measures to prevent brute-force attacks, that is, repetitive attempts to guess usernames and passwords. The first step requires you to set a specific password in order to use the API.
The second and most important measure is the possibility of establishing a list of IP addresses authorized to use the API. That way, any request that comes from outside this list will be immediately discarded.
Decreasing repetitive tasks
The main advantage of using the API in both systems is the automation of routine tasks that must be performed dozens or even thousands of times. This allows hired staff to focus on really important tasks, such as providing custom responses to customers or planning new processes to close tickets and collect them later, classifying them appropriately.
Deadline compliance
Another important advantage is the ability to schedule automatic actions for certain dates, even at the most favorable times. For example, you can schedule instructions to be sent to the API during lower workload hours, such as early mornings. This allows you to take advantage of the optimal moments to execute tasks without manual intervention.
According to results, additional actions
Since the API can return messages of success or failure in the “conversation” in formats such as XML or CSV, it is possible to execute additional conditional instructions after receiving a response. This enhances operations and provides the feeling of having more staff constantly and relentlessly available to perform their tasks.
In aspects such as hardware and software inventory management and control, it is really necessary to use an API, since the huge number of items involved makes it almost impossible to perform it manually.
Reporting
Another aspect that benefits from the use of APIs is the creation and forwarding of periodic reports. By providing real-time information at any time, it is ensured that the reports generated reflect the most up-to-date situation.
New Options
Pandora ITSM API is open to develop new features quickly since it was built with the flexibility of Pandora FMS in mind.
Conclusions
Integrating Pandora ITSM and Pandora FMS through an external API has revolutionized server, application and network monitoring. This technology enables efficient and safe communication, with additional security measures to prevent brute force attacks.
Automating routine tasks and scheduling automatic actions at optimal times has freed staff from repetitive tasks, allowing them to focus on more important tasks and provide personalized responses to customers.
In addition, the API provides the ability to execute additional conditional actions and obtain real-time information to generate updated reports.
Hardware and software inventory management is greatly simplified thanks to the API, overcoming the limitations of a manual approach.
And finally, the Pandora ITSM API remains open to new features, allowing agile and flexible development to adapt to the constantly evolving needs of Pandora FMS.
Since the Covid pandemic began, the word “hygiene” has ceased to be only for germaphobes and has become the holy grail of health.
Washing hands and wearing masks has become as normal as breathing (literally).
But did you know that your computer systems also need some love and hygienic attention?
That’s right!
Cyber hygiene is the new mantra to keep your data and networks healthy and safe from cyberattacks.
So, get ready to discover the 7 best practices that will help you keep your organization safe from cyber chaos. Because if your net fails, there is no disinfectant to save you.
Cyber hygiene keys to protect your data
1) Monitor and control your inventory as if you were Big Brother!
If you don’t know what you have, then you have no idea what you’re protecting.
To make sure your data is safer than Fort Knox, you need to keep a watchful eye on all the junk and software in your company.
Yes, even those devices brought by your enthusiastic employee on “Bring Your Own Device Day.”
Document everything from the software they use to the color of the cables.
If you detect suspicious software, sound the alarm and make sure to keep track of every hardware failure.
Don’t give cyber villains a break!
2) Don’t be a slacker, patch that software at once!
Did you know that outdated software is the “winter refuge” of cybercriminals?
According to a study (totally scientific, of course) conducted by the Ponemon Institute in 2020, 42% of data breaches were caused by the laziness of not applying available patches.
Hackers are out there looking for outdated software to sneak into your network.
Don’t welcome them!
You need a process that reviews and updates all your software in the background, without upsetting your brave end users.
3) Back up, don’t be a (data) loser!
Losing data is as painful as breaking a mirror with your head while an umbrella opens from your mouth (seven years of bad luck included).
Not only can users unintentionally delete files, there are also hardware issues, power outages, and those ruthless malware attacks.
Ransomware, for example, is like virtual hijacking, they ask you for ransom for your data! Save your company time, money and tears by making regular backups.
Automate the whole process to avoid human error and maintain a backup program with the precision of a Swiss watch!
4) Do not give permissions to anyone, be fussier than your father with culinary innovations!
Humans are the cause of 95% of cybersecurity problems, according to the prestigious “Obviously” World Institute.
So, if you don’t want your network to be as safe as an unlocked door, you need to carefully control who has access to what. Manage user permissions as if you were a guardian of Death Star 4 who does not want the slaughter of 1, 2, and 3* to be repeated.
But wait, assigning permissions manually is a slow and boring process. Instead, use an IT management solution that does all the dirty work for you and automatically assigns usage rights.
*Yes, there is a third in the last Star Wars trilogy.
5) Say goodbye to “123456” and welcome strong passwords!
According to a (very scientific) survey conducted by Google in 2019, 65% of users use the same password for everything.
Even IT professionals are to blame for this digital laziness!
Do you want hackers to crash your network? Of course not.
Raise awareness among users about strong passwords and the importance of changing them regularly.
But come on, let’s face it, nobody likes to rack their brains thinking about complicated passwords and then forgetting them instantly. Use a password manager to automatically generate strong passwords and store them in an encrypted database.
6) Multi-Factor authentication for hackers to cry virtual tears!
Passwords are actually like play dough locks in the digital age, easy to open for evil hackers!
So don’t just rely on them to protect your data. Implement Multi-Factor Authentication (MFA) and make hackers rip off virtual hairs of frustration.
Ask users to verify their identity through different factors, such as one-time passwords sent by text or email, personal security questions, or even facial recognition.
Make hackers feel it’s easier to climb mount Everest with a pressure cooker on your head heating lentils than it is to get into your network!
7) Don’t play Russian cyber roulette, use a cybersecurity solution!
There are many cybersecurity options out there, but here are a few key points to consider:
Find a solution that can detect known and unknown threats. In addition, you need a solution that can automatically repair any infection and clean up any traces of malware. Make sure it’s compatible with all your devices and operating systems, because you don’t want to leave anyone unprotected. And of course, make sure it’s lightweight and doesn’t slow down your devices.
Conclusions
If you want to save time and effort, consider adopting a cybersecurity framework.
Rely on the collective wisdom of thousands of professionals and let their expertise guide you in implementing a robust cybersecurity program.
Because honestly, who has the time to reinvent the wheel of cybersecurity?
Remember, maintaining proper cyber hygiene does as much good as washing your hands after you’ve helped give birth to a cow in the herd.
So, follow these 7 golden keys and keep cybercriminals at bay.
Don’t let them infect you with the cybernetic neglect virus.
Your network and data will thank you!
Would you like to find out more about Pandora FMS?
The total monitoring solution for full observability
Contact our sales team, ask for a quote or solve all of your doubts about our licenses.
In a world where technology is ubiquitous, network security is of paramount importance.
Every day that goes by, cybercrime evolves and becomes more sophisticated. They improve the materials of their balaclavas and spend more on incognito sunglasses.
In 2015, the damage caused by cybercrime already cost the world 3 trillion dollars, since then the figure has only multiplied.
No wonder companies are looking for ways to protect themselves against cyberattacks, don’t you think?
Anyone can claim that network blind spots are one of the biggest security challenges companies face in their efforts to safeguard data.
This makes visibility a crucial aspect for any security system.
*In particular, poor Managed Service Providers (MSPs) should exercise extreme vigilance as they are the custodians of customer data.
The best kept secret: What is network visibility?
Understanding network visibility is critical to protecting any organization from cyberattacks.
It is a way to be aware of the existence of all the components within your network, allowing you to monitor performance, traffic, big data analytics, applications and managed resources.
But, why stop there?
A complete monitoring solution can give you even more control to make changes based on the metrics you’re monitoring.
With increased visibility, MSPs can improve your customers’ security posture by identifying telltale signs of network compromising.
In addition, better visibility leads to better analytics, allowing MSPs to make informed decisions about the data protection strategies they need to implement.
A good monitoring solution should provide visibility into every part of your network, including your customers’ networks, to ensure that all aspects are monitored and all vulnerabilities are detected.
However, MSPs can only achieve maximum protection by combining their network visibility with effective security tools.
In other words, visibility alone is not enough to protect a network.
It is essential to have the right tools in place to detect and respond to security incidents in real time.
Without these tools, MSPs simply monitor their customers’ networks without being able to act on the information they receive.
Why is network visibility important? Learn how to protect your information in the digital world
Let’s repeat it once more:
Cybercrime is an ever-present threat, as we discussed, and network blind spots only increase the likelihood that attacks will succeed.
Visibility solutions provide valuable help by allowing MSPs to detect vulnerabilities and respond quickly to prevent potential breaches.
By monitoring network traffic, a visibility solution can identify and alert you to any performance bottlenecks.
This means that unexpected behaviors, such as unacceptably slow response times, can be detected immediately, allowing technicians and system administrators to take appropriate action.
Visibility also extends to application monitoring.
As an MSP, you’re likely to rely on multiple applications as part of your services.
With granular network visibility, for example, you can gain valuable insights into how your applications are affecting performance and connectivity.
This information allows you to filter critical app traffic to the right tools and monitor who and when uses each app. You can then make your applications’ performance more efficient, reduce server processing power, and minimize bandwidth usage.
In addition, a good visibility solution should be able to provide centralized control and visibility across all of its customers’ networks.
The right software will allow you to monitor and manage all of your customers’ networks from a single dashboard, allowing you to identify network blind spots across all of your customers’ networks.
With this centralized control, MSPs can ensure that their customers’ networks are always up to date and that vulnerabilities are detected and fixed quickly.
Challenges in network visibility?
As MSPs strive to keep pace with the rapidly evolving network visibility landscape, it is imperative that they take several challenges into account.
One of them is the constant evolution of security threats.
It’s not like cybercriminals are sitting on a couch all day doing nothing. They are always looking for new ways to compromise networks, and MSPs must stay ahead of the curve by implementing advanced security measures.
One of the most significant threats to network visibility is the increase in encrypted traffic.
Many popular websites and apps now encrypt their traffic to protect user privacy, making it difficult for MSPs to monitor such traffic.
As a result, MSPs must implement tools that can decrypt and inspect that traffic without affecting network performance.
Another major challenge for MSPs is the sheer volume of data that modern networks generate.
With the rise of cloud computing and IoT, there are more endpoints and devices than ever before.
This makes it difficult to collect, store and analyze all the data generated by these devices.
MSPs must implement tools that can manage this volume of data while providing accurate information about network performance and security.
Finally, MSPs must cope with the increasing complexity of modern networks.
With so many different components to consider, from mobile devices to cloud services, it’s easy to feel overwhelmed.
MSPs should choose their tools carefully, selecting those that can provide full visibility into all network components.
Visibility is a critical issue for MSPs, but it is not without challenges.
To stay ahead of the curve, MSPs must implement advanced security measures, tools that can manage the volume of data generated by modern networks, and tools that can provide complete visibility into all network components.
With these measures, MSPs can ensure that their customers’ networks are safe and working optimally.
Conclusions
Let’s be concise:
Network security is crucial in a world where technology is ubiquitous and cybercrime is rapidly evolving, so Managed Service Providers (MSPs) must be vigilant and understand network visibility to protect organizations from cyberattacks.
Network visibility is important to detect vulnerabilities and respond quickly to prevent potential breaches, by monitoring network traffic to identify unexpected behaviors, detect performance bottlenecks, and monitor the use of critical applications.
MSPs face several challenges in the evolution of network visibility, such as the constant evolution of security threats, and need to implement measures to stay ahead of the curve, combining network visibility with effective security tools to detect and respond to security incidents in real time.
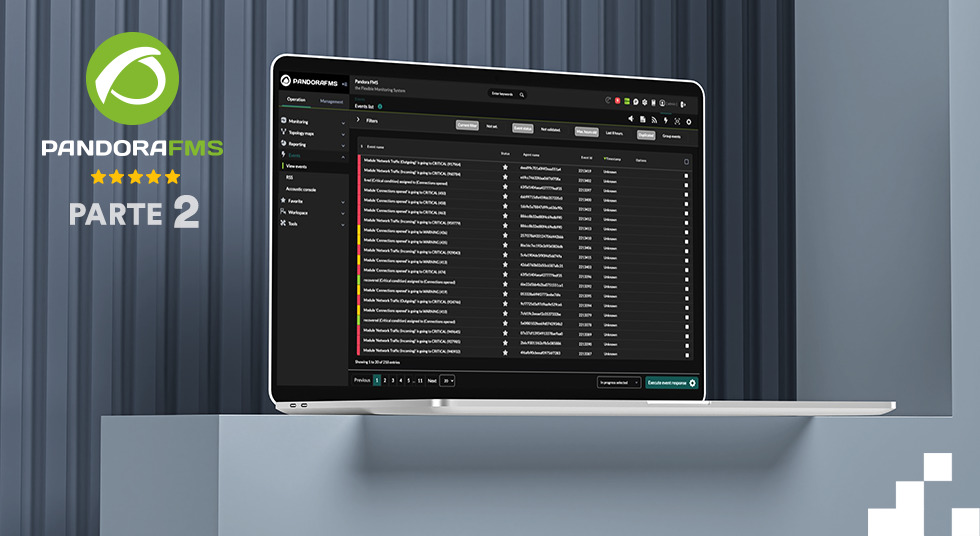
Today, in Pandora FMS blog, we will continue with the feat of presenting the best features of Pandora FMS 2022-2023. I talk about “continuing” because this article is the second part of a great first episode. If you haven’t read it yet… go ahead, here we’ll be waiting for you, and besides, I’m not in a hurry.
First of all, you can now set up a history database for your Metaconsole, as if you were a real data archive.
In addition, if you have any issues with your agents, do not worry, because the new schedule downtimes allow you to disable only the modules that are giving you trouble.
But that’s not all, access to the console has also been improved, now you may restrict access through an IP filter for each user.
As for reports, a new option has been added to filter by agent group and/or module group.
You may also schedule the report forwarding alert action. Do you have a critical module? Well, send a report to solve the problem like a real professional!
And if network maps are your thing, you’ll love knowing they’ve been upgraded with automatic refresh features, the removal of the Pandora node, and the ability to link multiple maps to a dummy node.
Last but not least, Pandora FMS now offers support for Ubuntu 22!
Yes, I know, it’s crazy! But do not forget that it is only available in nodes and with some features in experimental phase.
Version 766
Version 766 arrived loaded with features that will not leave you indifferent.
The first of them has to do with the history database and SNMP traps, in which you may now store both in the node and in the Metaconsole.
In addition, for the most demanding ones in terms of security, you can now configure a custom password policy, with all the requirements you need to keep your credentials safe.
Of course, it will only be applicable if you have the local authentication method configured in your console.
But not everything is about safety in life, you also have to take into account the time we spend on certain tasks. That is why in this new version a feature was added for status scaling based on time in modules, which means that you can choose the maximum number of intervals a module may be in warning state before switching to critical state.
A really good deal for those who want to make the most out of the performance of their modules.
In addition, if you are one of those who use many shared credentials on their devices, you can now configure SNMP and WMI credentials in the credential store and use them in the agent wizard or in those types of modules.
And for those who seek perfection in terms of design, you will now have the option to enable maintenance mode when modifying a visual console, so that other users know that you are working on it.
Conclusions
Although the latest Pandora FMS version, 767, being an LTS version, has only included performance improvements and error correction, we cannot fail to highlight the wonderful features that we had already announced in previous versions, such as status scaling based on time, the possibility of storing SNMP traps in the history database, the configuration of password policies and the ease of use thanks to the option of shared credentials.
These features have undoubtedly made Pandora FMS a market-leading network monitoring tool. (And if you haven’t tried it yet, feel free to contact us to request a free 30-day Trial!)
And here’s our review of Pandora FMS!
If you liked it, do not forget to click Like and Subscribe in our channel to stay tuned with all the news.
And as always, any suggestions, questions or ideas… leave them in the comments below.
Thank you for joining us and see you in future learning videos!
Would you like to find out more about Pandora FMS?
The total monitoring solution for full observability
Contact our sales team, ask for a quote or solve all of your doubts about our licenses.
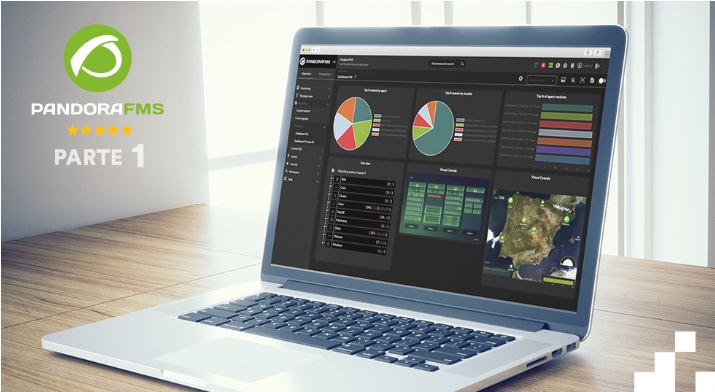
Today, in Pandora FMS blog, we want to present you with a video, as nice as you will find it, from our channel, in which we share with you with a sensual and velvety voice Pandora FMS best features for 2022-2023.
*This article will be divided into two parts so you don’t collapse with that much interesting information.
Starting with version 760, Pandora FMS significantly improved its installation process.
Instead of using ISOs, you now have online installation scripts that allow you to install Pandora FMS and all its components with a single run.
In addition, this same version is the one that started including support for Red Hat 8, Rocky Linux 8 and Alma Linux 8 operating systems.
Hard to believe, right?
On the other hand, in the Alerts menu, you will find a renewed tool to schedule alert notification.
You may set multiple schedules in a single day with the advanced mode, or choose only one with the simple mode.
In addition, it also has a new automatic graph for modules based on a histogram that will allow you to see the changes in the module status in the time range you want. Without a doubt, a very helpful tool for your day to day.
Version 761
Pandora FMS version 761 also comes with very interesting news.
For example, you now have two new Module Agent reports, with which you can see the name of the agent and the current value of the modules you select, in addition to the current status of the module, group and last contact.
But that’s not all, a new type of report called “Custom Graphical Representation” was also added, with which you may customize SQL executions or create graphs with your own macros and show any information you want from your environment.
As for views, a new one was added, called “heat map”, which will allow you to see the general status of your environment interactively, being able to filter by agent group, module group or label.
Version 763
Pandora FMS version 763 brought lot of other improvements. One of the main ones is the new method for displaying the service map.
Now, with “Sunburst”, you will be able to see your services in a circular way instead of the common tree shape.
There is also a new widget in the dashboards section, with which you may quickly see the number of agents that belong to each operating system and their current status.
And if that was not enough, event replication was deleted from the command center, which provides higher fluidity and scalability when working with these events.
Version 764
Pandora FMS version 764 is undoubtedly one of the most convenient ones.
Very interesting features related to the Satellite server have been added.
From now on, you can manage the whole configuration of your Satellite servers from Pandora FMS console itself, change any configuration or parameter in the configuration file of the Satellite server itself or even restart the service remotely from the console.
In addition, this version also includes improvements in event management, allowing greater flexibility in event creation and management and their associated actions.
Integration with ticketing systems, such as OTRS or RT, has also been improved, allowing more efficient incident management.
Another of the most notable novelties is the inclusion of a more advanced alert system, which allows you to define alert thresholds based on different metrics and actions to be taken when these thresholds are exceeded.
Conclusions
These new Pandora FMS features for 2022-2023 are like a superhero based in your city, ready to protect your environment from any danger and make your job much easier.
With easier installation, revamped alert tools, new custom reports, and improved event management, this new version is all you need to take your monitoring tasks to the next level.
So if you’re sick of dealing with complicated installations, unclear graphics, and useless alerts, Pandora FMS is the solution for you!
With its powerful combination of features and ease of use, there is no other monitoring software that can compete with it.
Would you like to find out more about Pandora FMS?
The total monitoring solution for full observability
Contact our sales team, ask for a quote or solve all of your doubts about our licenses.
In our beloved “world of technology”, bugs are allowed. In fact, they are so allowed that software bugs have ended up being like a plague of Cretaceous locusts that reappeared today, after a genetic experiment, to devastate everything*.
*Registered idea for a possible film set in the moors of Jaén. Do not copy us, you saga in evident decline Jurassic Park.
These software bugs we’re talking about can range from minor annoyances to catastrophic events, and have plagued experts since software was born.
The thing is, every once in a while, some random software bug appears and it is so weird or completely absurd that it becomes a bloody legend.
So in this article, we’ll take a look at four of the funniest ones and try to figure out what went wrong.
Are you in?
The funniest software bugs in history
The Killer Typo, one of the most mythical computer errors
Let’s start with one of the most infamous software bugs in history: The Killer Typo.
This bug made headlines in 2003, when a Canadian Space Agency programmer accidentally entered an incorrect variable into a computer program.
The program was to control the Mars Climate Orbiter, but instead of converting the metric system data to imperial units, it left them in decimal metric.
This caused the orbiter to fly too close to the planet’s surface, where it burned up in the atmosphere.
How did it happen?
It turns out that the programmer used an older version of Microsoft Excel which, by default and in turn, used imperial drives, while the program itself used metric drives.
The result was a catastrophic error that costed the Canadian Space Agency $327.6 million.
What have we learned?
Always double-check your variables before sending a billion-dollar spaceship hurtling to another planet.
The Blue Screen of Death. All famous computer scientists have been there
The Blue Screen of Death is a classic software bug that has existed since the dawn of the PC era.
It points to that dreaded moment when your computer crashes and displays a blue screen with a cryptic error message that makes no sense to anyone outside the software developer community.
It’s a frustrating error, yes, but in a way it is also funny.
So what causes the Blue Screen of Death?
It could be many things actually, from faulty hardware to faulty drivers or conflicting software. But whatever the cause, it’s always a headache for end users.
What have we learned?
That repeatedly hitting the side of the monitor waiting for an answer is just one of the many forms of uselessness that human beings show.
The Millennium Bug. Yes, it’s what you’re thinking
Ah, The Millennium Bug.
Do you remember it?
It was supposed to be the end of the world as we know it, as computer systems all over the planet were going to malfunction when the clock struck midnight on December 31, 1999.
The reason?
Most computer systems only stored the year in double digits (for example, “99” instead of “1999”), so they could not distinguish between 2000 and 1900.
It was a failure known for years, but which caused panic and chaos as the new millennium approached.
In the end, most of the time it turned out not to be a problem, but it is still remembered as one of the most exaggerated and overrated software bugs in history.
What have we learned?
We are old enough if we remember that.
The Invisible Mouse. Great programmers of history will remember it in the future.
Finally, let’s take a look at a more recent bug that caused some confusion for users of Windows 10.
Back in 2018, an error was discovered that made the mouse cursor disappear when users tried to move it.
The cursor would still work normally, but it was impossible to see where it was on the screen.
What was the cause?
It turns out it was related to a conflict between certain display drivers and a Windows 10 feature that allowed users to customize the size and color of mouse cursors.
The bug was eventually fixed, but not before causing some headaches to users who couldn’t figure out where their mouse had gone.
What have we learned?
That the essential can be invisible to the eyes, as that smart-ass guy, the Little Prince, said.
What have we learned from this article?
In conclusion, software bugs can be frustrating and even costly at times, but they can also be downright fun if they don’t happen to you.
“In this bleak world where technology has become a vital necessity, IT Service Management (ITSM) has become a key tool for many businesses.” It sounds like the introduction to a dystopian novel, doesn’t it? Easy, it’s not like that, today I didn’t get up very like Aldous Huxley.
We will rather answer the question: What is ITSM exactly?
Don’t you worry, I will not get too involved with the technicalities, you already know what we’re like, I will explain it to you in an easy way and worth prizes such as the Nobel Prize for scientific dissemination.
Imagine that ITSM is the detective of a company. It’s the tough guy who helps the organization understand how technology works in the business and how it can become more efficient. But to be a good detective, ITSM needs three elements: people, processes, and technology.
People are important in ITSM because they are the ones who use the company’s IT services. End users, employees, customers, and external vendors are all people who need the company’s IT services to do their jobs.
The implementation of ITSM helps define the roles and responsibilities of each user group, and ensures that everyone understands how they can contribute to improving the management of IT services.
Processes are also important in ITSM. And we’ll go crazy inserting an analogy into another analogy. Inception!
If ITSM were a hamburger, the processes would be like hamburger mince.
Processes are the different stages that the company’s IT services go through, such as incident management, IT asset management, and change management. A good ITSM implementation will help the company define these processes and ensure that they are followed correctly.
If we continue with the hamburger simile, technology is like ITSM’s hamburger cheese. It is the ingredient that holds everything together with its caloric value.
Technology allows the company to automate its processes and improve access to service providers and end users. Automation reduces errors, brings consistency and service metrics based on critical success factors.
Although if you got lost in the middle of my great allegory of detectives and hamburgers I leave you here a more academic and cheeseless definition:
ITSM is the acronym for Information Technology Service Management, which refers to a set of practices, policies, procedures and tools used to plan, design, deliver, operate and control the information technology (IT) services that a company offers to its internal or external customers.
ITSM is based on the service management approach and focuses on customer satisfaction, continuous improvement of services and efficient management of IT costs and resources.
ITSM includes processes and areas such as incident management, problem management, change management, asset and configuration management, service level management, and capacity management.
Implementing ITSM enables companies to improve the quality of their IT services, increase the efficiency and effectiveness of their processes, and reduce the risks and costs associated with information technology management.
Now that we know what ITSM is, what are the keys to its implementation?
Well, there are some key requirements that need to be met.
First, the roles and responsibilities of end-users must be defined.
Secondly, the processes to be followed must be defined, such as incident management, IT asset management and change management.
And finally, the right technology must be implemented to automate these processes and improve access to IT services.
When implementing new ITSM processes, the key is to adapt to the specific needs of your business.
If your IT support team is always working on the same problems, finding the root cause and solving it is undoubtedly the best option.
For example, if storage space is a recurring problem, deleting files every time the hard drive reaches its maximum capacity is not a long-term solution.
Instead, installing a hard drive with greater capacity would be a more effective solution over time.
In ITSM, the incident management process becomes problem management.
In this example, the lack of storage space is the incidence, while the storage capacity of the hard drive is the underlying problem.
But the implementation of ITSM processes depends not only on the tool used, but also on a culture change.
It’s important for end users to see the IT team as a service provider, rather than just another department of the company.
Key points to consider when implementing ITSM processes are team maturity and size, identifying specific issues, and selecting the right framework.
Each framework has its own structure and processes, so the choice will depend largely on the problems to be solved.
Once ITSM has been implemented, what are the advantages and why is it important?
There are many benefits to implementing ITSM.
ITSM processes are key for companies looking to optimize the management of their IT services and improve customer satisfaction.
Clearly defining service delivery goals, publishing an IT Service Catalog, and creating well-trained and enthusiastic support teams are just a few of the ways ITSM can benefit a company.
In addition, a good ITSM implementation can ensure quick troubleshooting, saving end users time and reducing help desk workload.
This, in turn, can reduce IT service provision costs and increase service availability and trust.
Last but not least, ITSM ensures compatibility with different regulations or legal regulations, which is crucial for companies looking to comply with security and privacy standards.
In short, implementing ITSM processes can provide a number of benefits to businesses, from better management of IT services to greater customer satisfaction and greater compliance with legal regulations.
But what about ITIL?
ITIL is a very popular ITSM framework, but it’s not the only option.
There are other frameworks and standards, such as COBIT, ISO 20000, MOF and USMBOK, that can also be used to manage IT services.
The main difference between ITIL and other frameworks is that ITIL is very prescriptive and specific about how IT services should be managed, while other frameworks are more flexible and allow companies to customize their processes according to their specific needs.
Despite the differences between ITSM and ITIL, both are important for IT service management.
ITIL is a good choice for companies looking for a more detailed and structured solution, while other frameworks may be better suited for companies that need a more flexible and customized solution.
Conclusions
What else can we say, the implementation of ITSM is fundamental for the efficient management of IT services in companies.
Like a seasoned detective, ITSM helps the organization understand how technology works in the business and how it can be more efficient.
With the right definition of roles and responsibilities, well-defined processes, and implementation of the right technology, ITSM can improve the quality of IT services and increase end-user satisfaction.
Whether using ITIL or any other framework, ITSM is a key tool for any company that wants to stay competitive in the increasingly technological world in which we live.
And remember, if you ever have problems with your company’s IT services, don’t worry, because ITSM is here to help you solve the mystery and make everything run smoothly!
As the famous detective Sherlock Holmes once said, “when the impossible has been removed, what remains, however improbable it may seem, is the truth”. And the truth is that ITSM is a powerful tool to improve the management of IT services in your company.
Friends, welcome to the world of software development! There have been more changes here in recent years than in Lady Gaga’s wardrobe during her Super Bowl halftime performance! You know, Agile, DevOps, the Cloud… These innovations have enabled organizations to develop and deploy software faster and more efficiently than ever before. One of the key DevOps practices is automated deployments.
In this article, we will discuss the importance of creating and monitoring strong automated implementations.
Traditionally, software deployment was a manual process that implied manifold steps and was prone to human error.
Automated implantations, on the other hand, allow organizations to implement software automatically without human intervention, reducing the chances of errors.
Automated implementations also offer the following advantages:
Faster deployment:Manual implementation is a slow process that implies manifold steps. Automated implementation reduces the implementation time and allows companies to implement software more frequently.
Coherence: Automated deployments guarantee that the deployment process is documented and can be repeated, which reduces the chances of errors caused by human errors.
Downgrade: Automated deployments allow organizations to return to the previous software version quickly and simply if some problem arises.
Profitability: Automated implementations reduce the need for manual intervention, which can be expensive and time-consuming.
Improved tests: Automated deployments can be tested in a test or pre-production environment before going into production, reducing the likelihood of problems arising.
Steps to create strong automated implementations
Creating strong automated deployments involves the following steps:
Defining the deployment process: Define the steps needed to deploy the software, including dependencies, configuration settings, and environment requirements.
Automating the deployment process: It uses tools like Terraform, Ansible, Jenkins, and YAML to write the deployment process as code, store it in source control, and test it.
Add doors and approvals: It adds doors and approvals to require external approvals, perform quality validations, and collect status signals from external services before the implementation can be completed.
Develop a rollback strategy: Develop a rollback strategy that includes feature indicators and bluish-green deployments to roll back to the previous version of the software easier should any issues arise.
Implement automated monitoring: Implement automated monitoring of system metrics such as memory usage, disk usage, logged errors, database performance, average database response time, long-duration queries, simultaneous database connections, and SQL query performance.
Test and refine: Test and refine the automated deployment process, making the necessary adjustments.
Monitoring of strong automated deployments
Automated implementations must be accompanied by automated monitoring.
Organizations must monitor system metrics such as memory usage, disk usage, logged errors, database performance, average database response time, long-duration queries, simultaneous database connections, and SQL query performance.
Mature monitoring systems make obtaining a baseline prior to implementation easier as well as spotting deviations after the implementation.
Holistic hybrid cloud monitoring tools that alert organizations to errors or abnormal patterns are an important part of feature flags and bluish-green deployments.
They are the indicators that allow organizations to find out whether they need to deactivate a feature or return to the previous production environment.
Tools and processes
Although implementation and monitoring tools alone do not guarantee the success of the implementation, they certainly help.
It is also important to create a DevOps culture of good communication, design reviews throughout development, and thorough testing.
Automated deployments are just part of the DevOps lifecycle, and organizations can decide at what point in the cycle automation it adds value and create it in small chunks over time.
Automated deployments reduce the risk and effort required. Their high return on investment often makes them a great place to start automating considering DevOps best practices.
Conclusion
Automated deployments are an essential part of the DevOps culture. They reduce the likelihood of human error, allowing faster deployment.
Closing the circle with a reference to Lady Gaga:
Automated deployments are like having Lady Gaga’s costume assistant as your personal assistant – there’s no room for error!
Have you ever heard the saying: “Poor planning on your part does not imply an emergency on my part”?
But don’t worry, we’ve got you covered. In this articWell, let’s just say Bob Carter, the man who said it, was clearly not in the customer service business.
When we talk about dealing with clients, poor planning on their part can quickly turn into an emergency on your part.
And believe me, there’s nothing nice about an emergency with a client.
le, we’ll show you some examples of why a customer’s bad planning IS your emergency.
So sit back, have a coffee, and get ready to learn how to handle annoying last-minute customer requests like a pro.
Customer disappointed for buying something wrong? Learn how to turn their experience into a positive one
Have you ever had a customer reach into their pocket too quickly and buy something without really understanding what they were getting into?
Maybe they thought they were buying the latest model car, but it turns out they actually bought a unicycle.
Well, maybe it’s not such an extreme case, but you know what I’m talking about.
Now they’re disappointed and angry, and they probably take it out on you and your product.
It’s not their fault they didn’t dig out enough information, is it? No, you are to blame.
But fear not, my friend. There’s a way to turn that frown upside down.
First, you need to be actively involved in solving the problem. And no, we don’t mean rolling up a newspaper and slapping them on the face (although it can be tempting) so they don’t do it again.
Maybe you have exactly what they need, but they don’t have the right subscription to access it. Or maybe you have a partner who can offer the missing service, integration, or customization to close the gap.
In any case, you have to help them see the light and make sure they don’t leave with a bad taste in their mouth.
Of course, they may eventually opt for another product or service, but that doesn’t mean their experience with you can’t be positive.
Who knows, they might even become advocates for your brand and recommend you to other people.
So, the next time a customer buys something without understanding it, don’t panic.
Take an active part in solving the problem and make sure they leave with a smile on their face.
The key to success: Adapt communication to your client
Have you ever had a customer who didn’t take advantage of updates and now has a lot of technical issues?
You may have warned them several times and through several means, but they didn’t understand the message.
They were still using the outdated version of their product while you had moved on to the next big update.
Don’t be afraid because not everything is lost. It’s time for you to roll up your sleeves and help them!
After all, if your client did not understand what you warned him about or did not act accordingly, that is still your communication problem.
And let’s face it, sometimes you have to be like a scratched record to reach people.
If you help them catch up, you can make sure that this interruption is simply a setback in the service, and not an opportunity for your customer to run out of your services for a few days and take the chance to take a look at your competitors. Nobody wants that, right?
So, the next time you have to deal with a customer who crossed the line with the update, don’t fall into despair.
Help them get back on track and minimize downtime and wasted resources.
It’s about keeping them happy and making sure they keep using your product or service.
Improve your customers’ satisfaction with communication tailored to their learning style
In today’s world, communication is key. And when it comes to instructing your customers, it’s no exception.
Despite providing clear documentation and countless blog posts about your service, there is always some dumb client who seems unable to read/decrypt the instructions.
And, unfortunately, that can make everything fall apart.
Tasks that fail, problems that are not communicated, and queries that are overlooked.
It’s a nightmare for both you and your functional illiterate client.
But this problem has a solution. Just as each person has a unique personality, each client has a unique way of learning.
It’s up to you to find the communication method that works best for them, whether it’s through text, images, videos, or hands-on training.
If you adapt your communication methods to your customer’s preferred style, you will not only have a more engaged customer, but also a happier one who will no longer be stressed about having systems down or wasting money.
So go ahead, communicate with your whole heart and prevent those instructions from falling into disrepair.
Budget errors: When customers underestimate costs
“Here comes the wet blanket of exorbitant budgets.”
It is especially serious when the customer has not foreseen the costs of additional functions or users.
Maybe you thought you just needed a basic service, but your team expands and suddenly you have to pay for more users than you expected. And those costs multiply faster than a gremlin when you throw him into the municipal pool.
Or they may, I don’t know, not realize that the extra features cost more, and now they’re having a hard time. And not to mention when a specific function is used to the point of overflowing the established budget…
Handling a customer’s complaint about pricing can be a decisive situation. But if you want to retain your customers, you have to address their budget issues head-on.
Flexibility is key.
Can you offer them a more suitable plan or find ways to reduce costs without compromising service?
Remember that a good customer relationship means being prepared to deal with your emergencies, even if it means helping them cope with their own bad planning.
Because, after all, we are all humans trying to cross budget minefields together.
Conclusions
All in all, planning is essential, but even the best laid plans can get twisted.
Your customers may encounter unforeseen problems and have to modify their plans.
It is crucial to cover their backs in these situations.
When you show them that you are willing to solve problems with them, it will build trust and loyalty that can last a lifetime.
Remember that emergencies do happen, but if you can make your customers feel like their emergencies are your emergencies, you’ll create engaged and grateful customers who will likely stick around.
So, be prepared for the unexpected and stay alert to pivot when your customers need it.
Is your Windows getting out of hand? Doesn’t it know how to behave in front of guests? Is it like those children usually other people have who break down to cry as if they were boiling them?
In addition, thanks to software agent installation, you can have total control of your Windows servers.
Pandora FMS offers you full monitoring of Windows servers so you may have the information you need to solve problems in real time. You no longer will have to guess what the hell is going on, with Pandora FMS you can quickly identify problems and fix them effectively.
If this sounds too good to be true… wait until you see our video, the one below, where we will show you in detail all those advantages! Join us on this tour and find out how Pandora FMS can help you take control of your Windows systems easily and effectively!
Please accept marketing cookies to watch this video.
I know, I know, you loved the format! Well, if so, do not miss our next video on our channel. To date we have more than 1700 subscribers. Slick to be a channel specializing in software monitoring, right?
Let’s face it, enough chit chat, without monitoring, your computer walks on a tightrope, 30 floors high and without safety net: a false movement and BAM! It’s over! Brains omelette for the pigeons of your neighborhood!
Therefore, today, in the sacred and glaucous Pandora FMS blog, we bring you a series of testimonies, of real cases, sent by our esteemed users, where we ask them to tell us their miseries in exchange for taking the only moral possible:
Monitoring your computers is extremely important
Ramontxu Ortega, Software Engineer: “It’s like a glass of juice for your servers”
“I am the father of a small kid. His name is Antonio. I know him, quite a bit I would say, and under no circumstances would I give him a glass of juice without a lid and hope that everything goes well.
I once did. I trusted him. Big mistake. He accidentally spilled all the juice on my collection of origami figures based on the characters played by Bernard Hill. (Titanic, The Scorpion King, Lord of the Rings, The Kid…)
Well, just as I can’t trust my son, you can’t operate your servers without monitoring software.
Monitoring software is that snap lid that will make your figurines not end up soaked. I can forgive Antonio. He’s 11 years old and has balance issues, but performance issues from not using monitoring software are inexcusable.”
Jackie Breslin, Quality Assurance Engineer: “It’s like going to the dentist. More or less”
“My old dentist was named John, John I don’t know what else.
He had a small dental clinic outside Chippewa Falls. John had the most cutting edge equipment and believed his equipment was in good working order.
However, one day, while a patient (ME) was in the middle of an endodontic procedure, the dental drill suddenly stopped working. John was forced to give a tremendous outcry of outrage that frightened both the patient (ME) and half Chippewa Falls.
He interrupted the process of course and changed the poor patient’s appointment for another day, prompting frustration and hatred from both the patient and staff.
What I mean to say with all this useless stuff is that you have to ALWAYS follow up the use and performance of your computers.
Imagine that John’s inoperative had some kind of magic software that would detect problems in his drills before they got stuck in the teeth of his clients.
Good monitoring software is key to maintaining the health and longevity of your equipment.
Invest in monitoring software. Prevent failures. Ensure proper performance.
I mean… don’t be like John.”
Mauricio Núñez, DevOps Engineer and CEO: “Maybe it’s like checking the weather”
“There we were, like a good tech company that had just launched its first product. Excited about the product and confident that everything was working properly. There was no need to put more money into monitoring. Maybe later on…
One morning, two or three days after starting up, I decided to check the company’s website from my phone. Nothing, it was down. Completely. Panicked, I called my team to find out what was going on. It had fallen due to a sudden traffic increase. We didn’t expect such a thing.
I had to check the time before I left home, so to speak.
After all, just as sunscreen protects you from burns, monitoring software protects your equipment from unexpected drops from traffic spikes.
What an analogy, right?
I can do it with the rain too: if I had looked at the weather, I would have known that I had to carry an umbrella (or, in this case, a monitoring software) to protect the startup from unexpected rain (or, in this case, from traffic spikes).
I should have devoted myself to writing.”
Julia Salas, Professional Marketing: “It’s like playing hide and seek”
“Once, as a child, playing hide-and-seek with friends in the dark, I got scared the shit out of me. Literally. I was always afraid of the dark, what I did not know is that it got way worse when it was my turn to seek when playing hide and seek.
That day I closed my eyes, counted to ten and began to look for everyone in that abandoned house.
I did it terribly wrong, every time I was going to reveal someone I was paralyzed by fear. People noticed and decided to give me a break.
Except for Sara. Sara found the perfect hiding place.
She went into a two-door closet in the basement. We looked for her everywhere. Obviously no one was going to open that nineteenth-century closet. We even called her on the phone when we got tired. She had turned it off.
Anxiety got to me and I had to go do my business in the surrounding countryside.
Now I work with software-monitored surveillance programs that would have found Sara in no time.
Monitoring software is good for more things. Spotting security threats, detecting hardware failures, good use of resources… I would only use it to find something you didn’t know was there. Like damned Sara, who came out of her hideout hours after, dust-covered and with a smile on her face.”
Would you like to find out more about monitoring software?
The total monitoring solution for full observability
Contact our sales team, ask for a quote or solve all of your doubts about our licenses.
Pandora FMS has changed a lot since its inception, and you, dear reader, may have noticed it. Through effort and hard work it has grown older and become someone strong and capable.
As you know, a tool, hard as well as flexible, that recognizes, connects and interprets different types of technologies to present them in a single environment.
A system monitoring software that has gained lots of popularity in the market and has just launched its new interface.
New Pandora FMS Interface: more accessible and updated
The new interface is a project in continuous development that seeks to enhance the homogenization of all the platform’s visual elements.
More accessible to new and old users and also more modern and dynamic to the perception of the market, where it rivals large competitors.
One of the biggest goals in the project has been to reduce the time and effort required by average users to learn how a new feature works.
Pandora FMS should be used at a more smooth and easy level.
The fewer frustrating barriers users find, the greater the preference Pandora FMS will have in the market.
Pandora FMS user interface improvements for a more intuitive monitoring experience
Lighter and fresher color palette
By reducing the visual load and vivid colors, we were able to highlight the important elements of each screen. Graphs and data have become the protagonists by keeping a palette reserved for them.
Actions such as buttons, selectors, and forms are clearer and simpler.
Quick eye scanning is more effective at finding the things you need.
Unified iconography
Icons have been redesigned from the ground up to share the same graphic line of colors, line thickness, sizes according to their usefulness, and visual style.
But most importantly, each icon has been reviewed to make sure that the design is as clear and distinctive as possible, and that it really represents the context or idea you want to convey.
We have standardized our icons so that they are easily recognizable even if you have never worked with a monitoring tool.
Homogeneous content structure
We have implemented an organizational criterion that stays the same no matter what type of screen you use. This would greatly reduce the learning times of the platform since you do not have to “learn” to use each individual screen.
The goal is that users, after seeing the basic forms from the beginning or interacting with the first data tables, can instinctively use all the other features because they are presented in the same way.
You will also be able to identify what type of screen you are on without having to detail the content, preventing you from getting lost within the platform.
With the new structure we have also changed the side menu
We divided the sections according to their group and modernized the way you navigate between screens. All of this in order for each user to have the links they really use, removing visual overcrowding from the screen.
That extra touch that goes beyond
The new interface will also begin to implement life quality for users. Transitions between screens or states are implemented, Copy UI and Content UX principles are applied to humanize the tool and speak less archaic jargon, graphic elements are added as illustrations that best explain an abstract concept, etc.
Conclusions
Pandora FMS has managed to create a new interface that is not only effective, but also accessible, modern and easy to use.
You no longer have to worry about spending hours learning how a new platform works or trying to decipher complicated data and charts.
With Pandora FMS, you’ll have everything you need in one place, presented in a clear, homogeneous and easy-to-understand way.
As many of you may already know, G2 Grid® reports are the result of real user ratings and reveal which solutions have the most satisfied customers and the largest market presence.
The unwavering commitment and tireless efforts of Pandora FMS team have led the company to receive this important recognition.
“We are delighted to receive this recognition from G2. It is a validation of our team’s dedication and hard work to deliver exceptional monitoring solutions and meet the needs of our customers”, said Kornelia Konstantinova, Chief Marketing Officer at Pandora FMS.
The recognition of G2
Pandora FMS has been recognized in several reports, including the top 10 in 10 of them, and has ranked among the top three in three reports.
The tool ranked among the top ones in categories such as:
Enterprise Results Index for Enterprise Monitoring
Small-Business Usability Index for Application Performance Monitoring (APM)
Enterprise Relationship Index for Enterprise Monitoring
Relationship Index for Server Monitoring
Mid-Market Relationship Index for Enterprise Monitoring
Small-Business Grid® Report for Enterprise Monitoring
Relationship Index for Log Monitoring
In addition, the company has been awarded 27 badges (badges) for its excellent performance.
Therefore Pandora FMS arises as the clear winner in monitoring software solution comparatives.
With an astonishing rate of 93% in Recommendation chances and a score of 98% in the Right product direction, it overcomes its competitors by a significant distance. Among them Centreon, Nagios XI, Zabbix, Splunk…
when it comes about Complying with requirements, Pandora FMS receives a score of 94%, one of the highest among all of the solutions. It addition it takes an outstanding place in Ease of Negotiation with a rate of 94%, Ease of installation 88%, and in Support quality with a score of 90%.
Although other software solutions have certain strengths, none of them can hold a candle to the steady excellency in all categories Pandora FMS keeps.
Even in the categories it does not hold the first positionsit is still quite competitive, as demonstrated by its 85% in Ease of administration and its 90% in Ease of use.
With a score of 88 in Net Promoter Score (NPS), it is clear users are more than satisfied with Pandora FMS.
We strive to provide a high-performance monitoring solution that meets your needs, and your ongoing support drives us to keep improving and growing.
We are very grateful for your dedication and loyalty, and look forward to continuing to be your trusted partner in monitoring your network and systems.
“Anyone with experience in large deployments in the real world knows that the best word to describe them is: the jungle. In this type of environment, monitoring’s flexibility is tested, since you can face all kinds of exotic systems. Pandora FMS just does the job everywhere. Windows? Linux? * nix? Embedded? RTOs?
We were able to use Pandora FMS on devices where all other vendors failed to provide a solution.
What I like most is that I know that with Pandora FMS we can forget about the target environment to monitor.”
-Hugo V.- Owner.
“It’s amazing how many options it offers from the very beginning. We wanted to monitor our applications in different environments and operating systems (Cloud, on-premise, legacy OS) without having to make big organizational changes, and it was not difficult at all.”
-Daniel Jose F.- Online Media.
“As far as I know, Pandora FMS is the only tool that allows you to monitor the whole computer park, linking it with statistics, maps and one of the most complete IPAM tools on the market.
It allows you to have in a single management console all the information necessary for efficient management.”
-Pedro G.- Small-Business
Conclusions
The recognition of Pandora FMS in so many reports and on such an important platform as G2 is only a small proof of the company’s commitment to excellence in monitoring software.
Because that is what we do here, we provide exceptional monitoring solutions that meet the needs of our customers.
With this recognition, Pandora FMS establishes itself as one of the world’s leading monitoring software companies and continues to demonstrate once more its ability to deliver high-quality monitoring solutions.
Thank you!
Would you like to find out more about Pandora FMS?
The total monitoring solution for full observability
Contact our sales team, ask for a quote or solve all of your doubts about our licenses.
It has been a veeeeery long time since we discussed a technical concept from an ingenious allegory. Many people send us emails asking us why, and we have to admit that… it’s true, everything is quite more fun with fantastic allegories. So be it then! At the request of our fans. Let’s talk today about ITSM and Monitoring Support through an invented event from which we can then draw a technical lesson.
ITSM and monitoring, that perfect match made in IT heaven
Once upon a time, in the unlikely IT realm of angels, there was the arrival of a new recruit named Gavril.
As soon as he crossed the golden threshold, Gavril was amazed by the grandeur of the environment. Little blue birds on golden clouds, swirling rainbows on radiant fruit trees, etc. In addition, he had heard great stories of how IT angels were responsible for maintaining the flow of information and data in the kingdom, and he was eager to be part of this noble work.
The very morning he arrived, before he could even leave his suitcases in his cloudy cabin, the chief angel approached him, Michael.
-“Gavril, I have an important task for you,” Miguel told him.
-“No formalities, man/woman* You can call me ‘Gavi’. But tell me, what is it, Miguel?” asked Gavril, with emotion in his voice.
*IT angels are hermaphrodites.
-“You see, Gavril, I know you just arrived, I have it all here noted down and all that, but I want you to explain to the other angels what ITSM and Monitoring Support is,” Miguel replied.
-“Hmm…’ITSM and Monitoring Support’?” asked Gavril strangely.
-“Yes, Information Technology Service Management and Monitoring support,” Miguel continued. “As you verywell know, it is a discipline to manage and provide computer services to customers in a structured and efficient way. Support monitoring is a critical component of ITSM, as it helps ensure that IT services are working properly and that any issues are detected and solved quickly. Right?”
Gavril swallowed the large bolus of saliva he had in his throat and nodded.
Miguel continued:
-“In ITSM, support monitoring is usually carried out through a combination of automated tools and manual processes. The goal is to identify issues before they become serious problems and solve them as soon as possible.”
-“Right, but doesn’t this sound a little complicated for a first day? I mean, I think. I just got here and… You know, I’m willing to learn, like a lot, but…” Gavril said sweating.
-“Well,” continued Miguel, cold and demanding like a grumpy father, “as I say, the key to ITSM is to improve the overall quality of IT services. By monitoring support and quickly addressing any issues, ITSM helps ensure IT services are always available and performing at the expected level. This, in turn, helps improve user experience and reduce the risk of business disruption. Don’t you think so, Gavril?”
Gavril was already wondering if there would be some kind of express form to get out of the kingdom, in fact, clouded by the possibility of escape, he got completely lost as Miguel explained some other benefits of ITSM, including how it helps improve IT support team efficiency, it promotes better communication and collaboration, and it is aligned with the needs and objectives of the business.
-“However!,” warned Miguel trying to get his partner to pay full attention again, “implementing ITSM can be a challenge. One of the main challenges is selecting the right tools and processes to monitor support. There are many different tools and processes available, and it can be difficult to determine which will be the most effective for a given organization.”
-”Yes… yes… I understand perfectly,” Gavril replied, “I will make sure to take these challenges into account when explaining ITSM and Monitoring Support to the other angels. Can I go now?…Please?”
And that’s how Gavril took in, by strict obligation, since he could not escape, the task of educating the other angels. Although first, of course, he contacted the people of Pandora FMS forum, since they always help him with this type of burden.
Also, who could know more about ITSM and Monitoring Support than the most cutting-edge company in monitoring software?
So finally “Gavi” came to the stage of the Sacred Court of the IT Kingdom and made the concepts simple and easy to understand, with particular emphasis on the importance of effective management of IT services.
It was quite surprising to Miguel, who had it in for him quite obviously.
Sure, the other angels were impressed by Gavril’s knowledge and appreciated his humor and wit in presenting the information*.
*Not like here on our blog, where you won’t even leave me a congratulatory comment 🙁
In the end, Gavril was even praised by Miguel, who climbed onto a stool to applaud and everything. And from that day on, Gavril was known as “The F Master in ITSM and Monitoring Support” in the realm of angels.
Moral of the story?
Is there any lesson?
I don’t know, maybe that ITSM and Monitoring Support may seem complicated, but with the right approach (given by some Pandora FMS member, like me, and a little humor) they can be easily understood and appreciated by everyone.
Want to find out more about Pandora FMS?
The total monitoring solution for full observability
Contact our sales team, ask for a quote or solve all of your doubts about our licenses.
The Congress & EXPO ASLAN2023, organized by ASLAN Association, took place last week at the Palacio de Congresos de Madrid – IFEMA, and brought together more than 7,500 professionals from the digital sector and cybersecurity in Spain.
And, after all the stuff we shared on social media surely you know that Pandora FMS was there!
Learn all about Pandora FMS’ success in ASLAN2023
The event had a whopping +100 exhibitors, each with its very own proposal of innovative solutions. In addition, the organization especially strengthened the presence of strategic vertical sectors at the exhibition.
Not to brag about it, but among the most outstanding solutions presented at the event there was MADE, a monitoring system for large amounts of data that uses Artificial Intelligence and automatically adapts to each management environment.
The tool has been developed by ourselves, in friendly collaboration with researchers from the University Carlos III of Madrid.
As we are restless minds in need of details, we had the courage to talk to Kornelia Konstantinova, CMO at Pandora FMS, and Sancho Lerena, CEO of the company.
Good afternoon, Kornelia!
Tell us, what impact do you think Pandora FMS’ participation in ASLAN2023 had and what was the response of those attending the event like?
It’s still early to talk about results in the short or medium term, but there’s something I can tell you: we exceeded our expectations in terms of the interest generated.
There was a huge flow of visitors and we were able to show our product to a wide audience. Also, to very relevant people!
We got to know some clients face to face, as well as partners with whom we usually communicate digitally.
We also came into contact with other companies in the sector, which we hope will open opportunities for collaboration and synergies.
What was the most difficult challenge to address when preparing your participation in this massive congress?
Without a doubt, the most difficult challenge, not only for us, I think for any exhibitor, is to develop an effective marketing strategy to attract the attention of visitors.
There are many exhibitors who participate and we must differentiate ourselves from the rest, whatever it takes. To that end, you have to be very creative of course and innovative, as well as develop a clear and effective message.
Then, of course, there is logistics, which is always a hustle and bustle.
What do you think is the marketing vision of Pandora FMS in terms of its role, in the long term, in the digital innovation industry in Spain and internationally?
We are the only manufacturer of Spanish Monitoring Software.
In the long term our goal is to consolidate ourselves as leaders in the industry in Spain and internationally.
To achieve this goal, our approach is based on developing and delivering advanced, customized solutions that meet the unique needs of our customers.
At Pandora FMS, we closely follow the latest trends and technologies on the market to stay always at the forefront of our sector.
Our commitment to continuous innovation. And it allows us to adapt to the changing needs of our customers, providing solutions that not only meet their current requirements, but also allow them to anticipate the future needs of their companies.
Therefore, we establish solid relationships with our customers, to understand their needs and offer customized solutions that fit their specific requirements.
We believe that close collaboration with our customers is key to our long-term success.
And now something lighter, any remarkable anecdotes of the days lived in ASLAN2023?
Actually, several. From the overflowing capacity of the first day, where many visitors had to queue to get in, to the amazement of everyone by the numerological studies of our beloved David! The mysterious magician we brought to our stand to predict, through his arts, the future of visitors.
Great, let’s go with Sancho!
How is it going, Sancho? Let’s get to the nitty gritty. We would like to know how the idea of creating the famous MADE system came about and what the development process was like.
There is a lot of techno chatter regarding Artificial Intelligence. So we wanted to offer something useful, understandable and that could be implemented right away, without having to assimilate what runs underneath.
The truth is, it is a rather complex challenge to try to make easy on the outside what is extremely complex on the inside.
And what features make MADE a unique tool on the market and what advantages does it offer to companies?
Especially the fact that we had international Artificial Intelligence researchers from the University Carlos III of Madrid to create something different from the usual solutions on the market.
Made is a practical approach to a complex problem but has a basic approach:
How to detect anomalies on data that we can not give more information about.
Well, Pandora FMS can handle dozens of thousands of numerical series, all different, because they all represent the “soul” of each connected device. Made studies each pattern separately, analyzes its behavior over time and like a data psychologist, is able to warn when something is not right.
You can’t diagnose the problem, but you know something isn’t right!
What was the collaboration like with the University Carlos III of Madrid in the development of the MADE solution and what did the university contribute to the project?
I think it was a very smooth process.
We had already tried to participate in other research projects and we really wanted to collaborate.
The university brings the state of the art of the world’s leading AI techniques.
Tell us, what impact do you think Pandora FMS’ participation in ASLAN2023 had and what was the response of those attending your presentation like?
I think Aslan is a good national showcase to show national and multinational companies who we are and the scope of our project.
In addition, thanks to the presentation, we were able to show face to face, what we do and how we can help all types of companies with Pandora FMS.
Any remarkable anecdotes of the days lived in ASLAN2023?
I met some people, senior managers from important companies, and I was pleasantly surprised (like, I really freaked out) because they had a technical profile even more geek than mine.
There is hope when large companies still look to technicians for their foundation to build business.
Thanks a lot!
What about you? Want to find out more about Pandora FMS?
The total monitoring solution for full observability
Contact our sales team, ask for a quote or solve all of your doubts about our licenses.
No, we are not talking about a tutored Pilates session or a recipe for the best Bacalhau à Brás. Nor do we bring you the trick to get past the chieftain of the desert of Elden Ring.
But today we will see how the Event Hubs plugin works in Microsoft Azure, as well as the prerequisites that you will have to meet in your Pandora FMS environment and the configuration necessary in Azure to be able to make use of the plugin.
Azure and the plugin’s operation for Event Hubs
But before we get into the good stuff and you click on our video…
Please accept marketing cookies to watch this video.
A little more about Azure, in case you are not up to speed
Microsoft Azure is a cloud computing platform that provides a wide range of services and tools for businesses of all sizes.
One of the most popular services on Azure is Azure DevOps, which is a comprehensive suite of tools for modern software development.
In this section, we will take a closer look at Azure DevOps and other related services like Azure Cloud, Azure Pricing Calculator, and Azure Status.
Azure DevOps: Streamlining Your Software Development Process
Azure DevOps is an all-in-one platform for managing the entire software development process.
It includes tools for project management, source control, continuous integration and deployment, testing, and release management.
With Azure DevOps, teams can collaborate more effectively and deliver high-quality software products with greater speed and efficiency.
Azure DevOps includes several key features, including Azure Boards, which is a project management tool for tracking and managing work items, bugs, and issues.
Azure Repos is a powerful code repository that supports multiple programming languages and integrates with popular development tools like Visual Studio and Eclipse.
Azure Pipelines provides continuous integration and deployment (CI/CD) automation, allowing teams to streamline their build and deployment processes.
Azure Cloud: Scalable, Reliable, and Secure Cloud Services
Azure Cloud is a cloud computing platform that provides scalable, reliable, and secure cloud services for businesses of all sizes.
With Azure Cloud, businesses can leverage a wide range of services and tools, including virtual machines, storage, databases, and more.
One of the key advantages of Azure Cloud is its ability to scale up or down based on demand.
This means businesses can quickly and easily provision resources as needed, without having to worry about maintaining expensive on-premises infrastructure.
Azure Cloud is also highly reliable, with built-in redundancy and failover capabilities to ensure uptime and availability.
In terms of security, Azure Cloud provides a range of security features, including multi-factor authentication, role-based access control, and encryption.
This helps businesses to protect their data and applications from unauthorized access or data breaches.
Azure Pricing Calculator: Plan and Estimate Your Azure Costs
Azure Pricing Calculator is a tool that helps businesses plan and estimate their Azure costs.
With the Azure Pricing Calculator, businesses can select the services they need and estimate the monthly cost based on usage.
The Azure Pricing Calculator includes a wide range of services and tools, including virtual machines, storage, databases, and more.
Users can select the services they need, choose the region where the resources will be deployed, and estimate the monthly cost based on usage.
Azure Status: Real-Time Service Health Information
Azure Status is a service that provides real-time information about the health of Azure services.
With Azure Status, businesses can stay up-to-date on any service issues or outages, as well as view historical information about service disruptions.
Azure Status provides a range of information, including service health status, incident updates, and historical data. Users can also subscribe to notifications to receive updates about service issues and outages.
Here at Pandora FMS blog we like to get up early, prepare a cup of pennyroyal mint and while it settles, do a couple of stretches, wash our face and start the day defining strange words worth something for our readers. Today it’s time for: Telemetry!
Do you already know what telemetry is? Today we will tell you
Shall we get straight to the point?
Straight to the point then it is!
Telemetry, roughly speaking, is what automatically measures, collects and sends data from remote sources, thanks to devices that collect data.
It then transmits that data to a central location where it is analyzed and you can then consider your remote system as supervised and controlled.
Of course telemetry data helps, while controlling security, to improve customer experience and monitor application status, quality and performance.
But let’s go further, what is the true purpose of telemetry?
As can be understood, the collection of telemetry data is essential to manage IT infrastructures.
Data is used to monitor system performance and keep actionable information on hand.
How do we measure telemetry?
Easy-peasy!
Through monitoring!
Monitoring tools measure all types of telemetry data.
They start with server performance and head towards actionable infinity.
Some types of telemetry data
It all starts with a small signal that indicates whether a server is active or inactive.
Then it tends to get complicated.
Event and metric data already includes the CPU utilization of a server, including peaks and averages over different periods.
For example, a type of telemetry data to be monitored includes server memory utilization and I/O loading over time.
*This data is particularly important when using server virtualization.
In these situations, statistics provided by virtual servers may not reveal problems with CPU or memory utilization; instead, the underlying physical server may be underutilized in terms of physical memory, virtualization, CPU, and I/O connectivity with peripherals.
Finally, user requests over time and concurrent user activity on standard deviation charts should be included in server-specific metrics.
This will reveal how your systems are being used in general, as well as information about server performance.
Telemetry Data Monitoring
Now that we’ve taken a look at servers and their telemetry, let’s dig a little deeper into some of the fundamental components of their physical application.
This includes:
Network infrastructure.
Storage infrastructure.
Capacity.
Overall bandwidth consumption.
As any experienced IT guy can warn you:
Quantifying network monitoring beyond the strictly commonplace is important.
Measuring network traffic in bits per second across LANs and sub-LANs within your application infrastructure should always be part of monitoring network utilization.
To predict when packets will be lost and when storms may take place in your network, it is essential to understand the theoretical and practical limits of these segments.
The utilization of the segment’s bandwidth over time in multiple network areas must be revealed by network monitoring.
Monitoring certain network protocols will also provide a more detailed view of application usage in real time and, perhaps, of performance issues for certain features.
Likewise, monitoring requests to certain network ports can also reveal any security gaps, as well as routing and switching delays in the relevant network components.
In addition to monitoring raw network usage, it is necessary to monitor the storage systems connected to the network.
To show storage usage, waiting times, and likely disk failures, specific telemetry is required.
Again, it is important to monitor both overuse and underuse of storage resources.
Some basic application telemetry monitoring data
It is very important to monitor the telemetry that can involve access to the database and its processing, monitor the number of open database connections, which can be triggered and affect performance.
Tracking over time allows you to spot design decisions that don’t change as application usage grows.
It is equally crucial to control the number of queries to the database, their response times, and the amount of information circulating between the database and applications.
Outliers and averages should also be taken into account.
Uncommon latency can be concealed or hidden if only averages are controlled, but these outliers could still have a negative impact and irritate users.
Your monitoring strategy should always take into account tool exceptions, database errors or warnings, application server logs looking for unusual activity…
And that’s just the beginning!
Your monitoring software
Having a solid monitoring strategy is crucial, but so is having a well-thought-out reaction strategy that incorporates:
Determining, understanding and initiating root cause analysis.
A written communication strategy that includes the names and contact details of those responsible.
Identifying easy solutions to restore the program in the short term.
A research strategy to prevent future problems.
Telemetry Monitoring Elements
Some telemetry monitoring elements that you may use:
Dashboards or other real-time system information and telemetry tools.
Technologies for analyzing records safe for use with production systems.
Business intelligence to retrieve data from records, such as usage trends or security issues during specific time periods.
Tools that automate risk detection, recovery, and mitigation to get rid of manual labor.
Using a centralized system and working with a software vendor, you may set in place a robust monitoring strategy that will be developed over time and become more comprehensive.
And there, my friend, is where we come in!
Want to know more about Pandora FMS?
The total monitoring solution for full observability
Contact our sales team, ask for a quote or solve all of your doubts about our licenses.
You still didn’t know it? Pandora FMS gets ISO/IEC-27001
Security is not a technology, it is a way of thinking and acting, we could even say that it is an attitude.
For years we have attended international fairs and events where computer security is offered as specific products.
Many people may think that by buying products you reinforce your company’s security, but no, that is only a small part of it.
Security is about changing the way we manage the whole organization, from how we share information to how we use systems.
Pandora FMS has always been aware of that and you may see it in our security architecture guide, our GDPR compliance guide -which is also valid for regulations such as PCI/DSS- and of course, because as a company we are certified with ISO 27001.
Certification ISO 27001 provides us with important backup towards our national and international clients, many of whom request information from us about our business continuity plans, the security of our development and implementation processes, what protection measures of information privacy we have in force and how we control the information available to our suppliers.
We understand that for them it is as important or even more than for us and having a certification that strongly supports us is something to be proud of.
Many of our clients are pharmaceutical companies, financial institutions – some over a century old – and government entities.
Due to confidentiality contracts we cannot mention their names, but large and small, to a greater or lesser extent, everyone is concerned about aspects related to information security.
Today we can proudly say that not only do we also care about it, but that we have proven our commitment.
But what is ISO/IEC 27001?
ISO/IEC 27001 is a standard for information security (Information technology – Security techniques – Information security management systems – Requirements) approved and published as an international standard in October 2005 by the International Organization for Standardization and by the International Electrotechnical Commission.
It specifies the necessary requirements to set, implement, maintain and improve an information security management system (ISMS) according to what is known as the “Cycle of Deming”:
PDCA – acronym for Plan, Do, Check, Act.
It is consistent with the best practices described in ISO/IEC 27002, formerly known as ISO/IEC 17799, with origins in the BS 7799-2: 2002 standard, developed by the British standards body, the British Standards Institution (BSI).
In just a few decades, computers have gone from having few functions and filling up entire rooms to becoming portable necessities for business and leisure. However, on its own and not connected to the internet, an electronic device can only do so much.
Most things we rely on technology for require communication between multiple devices—which is where internet protocols come into play.
What does TCP/IP stand for and how is it used in practice?
From sending a simple message to streaming a film or answering transferred calls online, internet use has become so commonplace that we rarely give our actions a second thought. But for all this online activity to be possible, there’s a lot taking place behind the scenes. Let’s start by talking about TCP/IP—the framework most commonly used to transmit data over the internet and other networks.
TCP/IP stands for Transmission Control Protocol/Internet Protocol. The job of TCP/IP is to ensure all communication traveling through the network reaches the intended recipient. It does this by breaking data down into smaller units (packets), which are then reconstituted upon reaching their final destination.
Is there a difference between TCP and IP?
Originally designed by scientists Vint Cerf and Bob Kahn in the 1970s, the Transmission Control Protocol suite has since become the standard method to transfer information. As the name suggests, there are two parts to the picture, and both are equally as important.
The latter part of the TCP/IP abbreviation stands for Internet Protocol. The Transmission Control Protocol and Internet Protocol each take care of a different issue to reach a common goal—the successful transmission of data across a network.
IP operates within what’s known as the network layer, while TCP works within the transport layer. In other words, IP locates the address for delivering data, and TCP takes care of transferring it, as well as correcting errors along the way to ensure successful end-to-end delivery.
To give a real-life example, imagine you’re planning a mass email marketing campaign. You’ve collated a list of email addresses (similar to the IP addresses used by the Internet Protocol to locate intended destinations). By delivering your messages to the recipient, the software through which you send the emails functions much like Transmission Control Protocol.
Lacking either email addresses or suitable software would impede information transfer; similarly, TCP and IP have to work together to be effective.
What constitutes the TCP/IP protocol suite?
We’ve now established why TCP/IP can’t function without one another, but the closer you look, the more complex the protocol suite gets. It consists of many supporting models that are fundamental to its function, such as:
Internet Control Message Protocol (ICMP)
Whenever a problem materializes during data transmission, it’s the ICMP’s role to send out error messages and operational information.
Internet Group Management Protocol (IGMP)
IGMP allows for multicasting i.e sending out the same data to multiple devices at the same time.
Address Resolution Protocol (ARP)
As a communication protocol, ARP helps connect the internet layer address to the link-layer address.
File Transfer Protocol (FTP)
FTP allows for transferring files from a client to a server. For instance, this protocol is what enables us to access data stored in the cloud—look up ‘what is an iPaaS’ to find out more.
Hypertext Transfer Protocol (HTTP)
Commonly known as HTTPS’ ancestor—only with less data security—HTTP is what makes the interaction between the client and the webserver possible. It’s often considered the foundation for data communication.
Simple Mail Transfer Protocol (SMTP)
SMTPs allow computers and servers to exchange data so users are able to send and receive electronic mail.
What are the four layers of TCP/IP?
TCP/IP is comprised of the following four layers, each of which has a unique set of properties and functions that contribute to the optimal function of the TCP/IP system.
Network interface layer
Also called the ‘network access layer’, this part of the TCP/IP model is where a connection between a physical network and a device is formed. The network interface layer defines how data should be sent and received over the network.
In physical devices, such as routers, the network interface layer plays an extremely important role in connecting the device to other users of the network who can then transmit data packets.
In everyday use, laptops and smartphones rely on the network interface layer to connect to wireless networks and access necessary functions such as online messaging or entertainment apps.
Internet layer
The second layer, also known as the ‘network layer’, combines various protocols (such as IP, ICMP, or ARP) to effectively transfer data sequences across the internet.
In the internet layer, each device is identified through a unique IP, which allows the packets to be sent to the correct address.
For instance, when sending an email, the message is cut up into packets to be rebuilt into its original coherent form in the recipient’s inbox.
Transport layer
The transport layer maintains control over the amount of data to be sent and where it’s sent to. To eliminate errors in inter-system communication, the transport layer engages in flow control, error correction, sequencing, segmentation, and de-segmentation.
When data gets lost in transmission, the expert troubleshooter that is the transport layer requests the packet be rerouted and received correctly. It also takes care of the efficient flow of information throughout the network by breaking up data into manageable segments.
It’s important to note that all information sharing comes with safety risks—if you’re concerned about privacy, spam call blocking software could be worth looking into.
Application layer
Within the topmost application layer, the user gets to interact with other software applications ranging from file sharing to remote desktop services.
Conclusion
The world of data transfer is extremely complex, with many factors combining to ensure that information leaves and arrives in the right shape and form to the correct recipient.
Internet protocol suites, of which TCP/IP is the most commonly used, are what make online communication possible. This is comprised of four layers and relies on a variety of supporting models to transfer data across the network in a reliable and efficient manner.
The formula of teleworking, extended among many companies from the phenomenon of Confinement, caused by the pandemic, has given rise to a new model of labor relations.
A system already called “hybrid” because it combines teleworking with conventional physical presence.
Don’t feel guilty, teleworking works!
According to Microsoft studies on labor trends, it is advisable to keep flexible options for remote work.
Surveys of 30,000 workers in 32 countries show that almost 73% want to work remotely, at least 60% of their time, while 45% consider changing to jobs that allow them to alternate commuting to their offices with working from elsewhere, through coworking, working at home or in the office itself.
In a technology company, specialized in monitoring systems such as Ártica PFMS, this situation has become an opportunity to significantly improve the work environment.
We have managed to establish a flexible work system for employees, about 50, that is bearing fruit.
There has been an increase in productivity.
Rotation has decreased noticeably because no one feels overwhelmed.
It is highly valued to avoid costs and transport time.
No one is against it and most people are grateful for controlling their time and having options for conciliation and fulfilling their tasks.
Teleworking has been imposed spontaneously because employees have so desired and also because the company management has taken care to channel it and bring it to a successful conclusion.
Both interests have been combined in search of work harmony, investing in a reconfiguration of the physical space and work procedures, in which each employee manages their own responsibility with the option of teleworking and attending to the office physically when deemed necessary.
Meetings are scheduled every week and are carried out through a technological communication system that allows a telematic meeting where the company’s professionals, either as a whole or by department:
Commercial (Sales and Channel).
Development.
Testing and Quality.
Support.
Projects.
Human Resources.
Administration and finance.
R&D.
All contacts are made with a very defined agenda, thus avoiding wasted time.
Each individual knows when to intervene and what to report.
The chairman is fully involved and at each meeting sets the guidelines to be followed, answers questions and queries and makes decisions.
Another achievement that we appreciate is that everyone has adopted a greater teamwork spirit.
Schedule and workplace flexibility, along with useful training, is the perfect combination to retain talent.
Now we have noticed that in one year we have had “0” rotation due to this new system that we implemented.
Agile room
It is a room equipped with cutting-edge technology that allows combining simultaneously telematic meetings and face-to-face meetings.
Agile, short meetings can be held, no more than 15 minutes, in which there is spontaneous conversation among the attendees.
Also, there is now a space designed for online training, so that we ensure knowledge updating, keeping the same performance standard we had in face-to-face mode.
In the training room, the teacher can display screens showing the contents to be explained.
Their image is combined with screenshots in which you can read texts with higher quality than the traditional power point.
Students can interact by microphone with the teacher and other colleagues, without having to resort to written chat questions.
We took an approach to what is called “learnability”, which is the curiosity and ability to learn new skills to stay employable in the long term.
Resetting the old workplace model
We have overcome the traditional model of massive in-person workplaces, a tradition from Taylorism, in which a huge room housed a myriad of aligned employees, who worked without looking up from their affairs and where it was difficult to communicate with the rest of the colleagues.
That breadth of space has been transformed into a friendly environment.
We have invested in connectivity to have high quality and safe telecommunication.
We have overcome the idea that the private office was a privilege for bosses where there were all sorts of comforts for them.
Now the office is a large office with sofas, armchairs, large windows where you can find the privacy for a call anywhere, warm lighting and screens to connect with whoever you want.
There is a coffee room for a snack and where any professional of the company can come whenever they want it.
That change implies a whole evolution in the way to communicate with each other and improve work performance because we all feel comfortably responsible for what we must do, with no additional pressures.
We are the ideal place to work because employees can choose, according to their mood, their obligations and their tasks within the company, between teleworking or attending a nice environment.
Conclusions
All in all, this new teleworking structuring has allowed us to create a disruptive model where the employee enjoys their freedom of choice, while they allow the company to control the performance of each employee, settling down clear goals for work and measuring in real time their fulfillment.
Finally D-Day! Today we will explain, in a simple video, how you can monitor Oracle instances.
For that we are going to use our Discovery feature, which allows you to connect remotely to applications to bring information and to add it to your Pandora FMS agents.
Do you know the Oracle tasks configured in Discovery?
Please accept marketing cookies to watch this video.
As you have seen, the Oracle tasks configured in Discovery allow you to connect to remote Oracle instances to monitor them and to generate module blocks with important information.
Today we focus solely on Oracle, but it is necessary to emphasize that the Discovery menu also allows you to monitor other applications.
Let’s get real. Not all metrics are useful metrics
Today we will talk about metrics in the context of an organization’s environment and goals. Therefore, measurements will always be related to:
History data.
Trends.
Usage patterns.
Typical lines.
Common bases.
Current values.
This context has always provided important and obvious benchmarks when comparing and analyzing an IT environment’s performance.
Thus you will determine “what is right”, “what is wrong” and what you just don’t care about.
Some metrics do not tell the whole truth
We know that availability is usually calculated by dividing the actual measured availability by the total possible availability of a certain interval.
0.9999 availability, for example, is considered a satisfactory result by most standards. Buuuuut, depending on when it takes place, that little downtime can be insignificant or important.
It is not the same if there’s inactivity between 2 and 3 in the morning for an online retailer or if it is at a time of great activity, near the end of the month or shortly before closing.
We are saying that the opportunity cost of each minute can range between tens of thousands of euros and hundreds of thousands of euros if it actually takes place just before holidays or during the period of greatest commercial activity.
With this we just intend to illustrate the relativism we live in and how crucial the context is to understand measures.
At a first glance we could say 99.99% is cool. However, it wouldn’t be so cool now if the 0.1% of application demand spikes and the 0.1% of downtimes match.
In this case, 99.99% uptime creates an over-optimistic image and may work against investigation of the underlying factors that may be causing potential performance issues or improper workload distribution.
In addition, a serious question arises:
(Serious voice).
Is the drop at times of absolute peaks of use a sign that the app is under-resourced, misplaced, or is it just an unfortunate coincidence?
Load spike failures have financial repercussions due to missed opportunities, but they also require a thorough examination of reliability, availability, network performance, and capacity KPIs, among others, to determine if any adjustments or fine-tuning are necessary.
*In theory, at least in theory, open tickets should be solved faster the more automation is used.
Therefore, it is important for IT organizations to track service ticket average resolution time (MTTR), as well as the amount and effectiveness of automation being used in their workflows for:
Configuration.
Provisioning.
Maintenance.
Problem solving.
In addition, a metric will be needed more than ever to determine and control the value of automation within the organization.
But we want to make clear that, in terms of automation, more doesn’t have to mean better.
Self-service portals, incidents and service requests have an inverse relationship:
The more end users discover that the self-service portal meets their needs for datasets, analytics, access to services and resources, etc., the less frequent IT service requests will be.
This goes beyond simple MTTR reduction.
It also involves employing self-service portals to allow customers to complete the most common service requests without the need to create and close a service ticket.
If installed and maintained, this should lead to a wonderful world where there are less service tickets issued, happier and more productive users, and the possibility, even, of users suggesting changes, additions and extensions of self-service portals.
Let’s evaluate the history of metrics
There are too many management tools and utilities for complex, hybrid cloud-based environments, don’t you think?
Companies tend to get the better deal if they focus their search on a single comprehensive, unified and complete management platform.
They often reduce the number of management tools they use, while streamlining the management of their IT operations by performing such a transformation.
The result?
A type of “virtuous cycle” that leverages improved automation and visibility to expand opportunities for continuous optimization and raise the level of indicators used to assess the overall health of IT infrastructure.
Conclusion
The areas that will most profit from automation and self-service access will be revealed by establishing useful cost metrics that go beyond the cost of IT acquisitions, amortization and depreciation, as well as the cost of IT consumption, including software-as-a-service solutions (SaaS), Cloud resources, usage, and permanent virtual machine assignments.
As a result, you will identify objectives for constant and continuous optimization and improvements that will keep costs in the right direction.
Want to know more about the IT world?
The total monitoring solution for full observability
Contact our sales team, ask for a quote or solve all of your doubts about our licenses.
Although it has been developed very quickly in recent years, thanks to technological advances, Artificial Intelligence (AI) has been around since the 50s.
Today this technology is being developed to do tasks that were previously only a matter for humans, such as programming.
What is GPT-3? Is your work as a programmer in danger?
AI is equipped with a set of tools, algorithms and techniques that allow it to learn on its own and improve its skills.
This makes it an excellent choice to replace programmers writing code in the near future.
First, AI is much more efficient than human programmers when it comes to writing code.
AI can analyze patterns and information much faster and more accurately than any human, allowing it to write code much faster.
AI is also capable of detecting and correcting errors automatically, which means the programming process is much simpler.
In addition, AI is much less expensive than human programmers to write code.
This is because AI doesn’t need to spend as much time learning programming languages, allowing it to save on working hour costs.
Well, you see? AI is not bad at all, after all, almost all the previous paragraphs have been written entirely by the ChatGPT.
Had you noticed?
Don’t worry, don’t panic!
If you really believe that AI in the near future can replace programmers writing code, re-read the previous paragraphs a little more carefully.
GPT-3, the autoregressive language model that uses deep learning to produce texts that simulate human writing, writes well, of course, probably better than me, because it doesn’t make mistakes.
But, again, read the first paragraph written by GPT-3 again to see if you find out what I’m talking about.
You get it?
I’ll come and give you a hand.
AI can write better than a human, but it will never have a purpose
If we asked AI to write us a story, it would write something with correct syntax, even with meaning, but the text would offer no greater interest than that written by a good elementary school student.
However, writing fiction literature or essays is an activity with a very large artistic and creative component.
You might think, and I do not blame you, that many bestsellers could be written by Artificial Intelligence, and it is more than likely that the authors of the future will use Artificial Intelligence tools to find flaws in their texts, to round off their style and in some cases to add some filling content.
Moreover, I would say that is already happening.
In fact, Google is updating its algorithms to detect content generated by Artificial Intelligences as the Internet begins to be full of it.
However, I guarantee you that this article contains something outside the scope of an AI today:
Acid irony.
Even more acidic sarcasm.
And why not? A certain melancholy.
*Damn it, this last paragraph was corrected by the AI, did I not tell you that it was possible?
But let’s go beyond that.
Before talking about an activity like code, let’s talk about other disciplines affected by Artificial Intelligence.
Are we talking about autonomous driving?
Soon Google, Microsoft and Apple assistants will use the new algorithms and will be much, much smarter, they will even be able to help us answer emails while driving, and give us better guidelines.
What’s more, I’m sure that in less than a decade, they will drive for us from point A (our garage) to point B (a public parking space).
But wait…
I live in Madrid…
Have you ever tried to find a car park in the center of Madrid?
Surely in Silicon Valley they do not have such hellish parking….
So, I withdraw what I said, that will still take some time, at least in Madrid.
Let’s give it 20… 30 years, but it will come.
I assure you, it will come.
The same will happen with text translation (but much, much earlier), the musical composition of the greatest hits, and with illustration, painting and graphic design.
If I ask Dall-E2 (the interface for creating OpenAI images with GPT3) to create an illustration for me under the premise “marvel-style illustration of a Hungarian family celebrating New Year’s Eve” it will draw this:
I swear I’m not kidding. It did it for me, in no time.
Is your position as a programmer in danger?
But back to the subject of code. I have no doubt that sooner or later (10 years from now) there will be tools that help developers create, debug and test code as a functional part of software development suites, such as add-ons or additional utilities.
Artificial Intelligence is/will be little by little an assistant that will add tasks to its backpack, but in the near future, the creation of full applications through a simple premise does not make sense, since as in literary, visual or musical creation AI lacks context.
Creating an application is an extremely complex process, where the code part is only one part, and it is not the most important part.
Context is much more important, and it includes answers to questions such as:
How will it be used?
Who will use it?
What data inputs and what data outputs are expected?
AI is good at giving answers, because what it does is study millions of existing questions and their answers, validating that learning process over billions of turns to the shaker we call Deep Learning, but…
Is it capable of asking new questions?
No, absolutely not.
Many will say that pure creation does not exist. That all stories have already been told, and that modern popular music does not come out of four chords repeated ad nauseam in different rhythms and melodies. They are right, but nuances are almost everything.
In the world of software development, these subtleties are a universe full of very subtle nuances that we can not “put in a shaker” and expect the mixture of previous formulas to work. It is science fiction and if I may say it, bad one.
Maybe one day Formula One drivers like Fernando Alonso will compete on a circuit hand in hand with Artificial Intelligence. But it won’t be this decade, or the next.
There are not only practical limitations, but ethical, moral, economic and legal limitations.
A commercial airliner could land on its own, but no insurance company would insure the device.
After all, who were we going to blame in the event of an accident?
The same applies to code generated by AI.
Who would patch it? Who would extend it? Who would talk to the client to understand the requirements? Who would invent the text of the “tooltips” to help in the interface? Who would design the interface (UI)?
Let’s get even more risky. Why not buy AI as a company CEO? Why not buy AI as President? Why not buy AI as a partner or lover?
AI applied to everyday life has just begun, but companies like Google already see their business model in danger, because what an AI does very well is answering questions and simplifying the process of obtaining information and delivering moderately satisfactory results.
Nowadays it is the ideal assistant, who does not stop observing and learning. And the time will come when it takes control over many activities, but as for software developing, it is still too soon.
Although we shouldn’t relax that much, everything is a matter of time.
After all, I said that this text was not fully written by AI,
At Pandora FMS we like to travel! Traveling, meeting people, bonding… And barbecues or country getaways are great, but there’s nothing we like more here than an event focused on technology!
That’s why we accepted the exceptional invitation to the latest Black Hat MEA edition held at Riyadh, Saudi Arabia last November.
There we went, to the Middle East no less, with our stand and our roll up, to present our respects, and services, to the most cutting-edge community that exists out there.
Pandora FMS visits Black Hat MEA 2022, the event of the year
For those who are not aware of all this stuff:
Black Hat MEA is a fairly iconic cybersecurity event, with year-round ethical hacking courses and offensive security classes that everyone wants to attend.
A global event that pushes the secrets of data security to the limit.
The largest information security trade show held anywhere in the world in 2022, bringing frontline and technology-loving companies together annually in a professional and festive atmosphere.
But I will explain.
We better talk to our lucky Pandora FMS colleagues who were able to attend this latest edition on behalf of our community. Alberto Sánchez, Systems Technician and Alexander Rodríguez, Salesperson.
Alexander, what would you say Black Hat MEA was like for Pandora FMS?
I think the event was a great chance!
Having a space within the booth provided by our exclusive partner in Saudi Arabia, LoopTech, was wonderful.
It allowed us several positive meetings with clients.
In addition, we had the honor to receive the visit of his Excellence Advisory Mr. Turki Alshikh. We were able to present him not only Pandora FMS, but the rest of the solutions in the field of Cybersecurity that our partner Looptech has.
We were very happy to receive a lot of positive feedback from the product.
Without a doubt, having participated in this event will help us achieve a better position in the Middle East market.
What did you learn from a place like Saudi Arabia and its people?
Saudi Arabia surprised me a lot.
It is a country that is growing very fast.
Although it still retains authenticity in the mud buildings in the middle of the desert and the spectacular sunsets on the dunes.
Its people are super friendly and are willing to help you in everything necessary to make your stay as pleasant as possible.
Most people speak English so it was very easy to communicate.
And I was hugely impressed that everything there is “go big or go home”: great plates of food, huge malls…
I would go visit the country again, without a doubt, to continue finding out more about its culture.
And you, Alberto? What do you think Pandora FMS contributed to Black Hat MEA?
I believe at least that Pandora FMS contributed to difference and originality, compared to the rest of solutions that showed up to the event.
As you already know, Black Hat MEA was focused in cybersecurity, meaning there were thousands aimed at email or mobile security, others focused in failure detection and there were those that avoid intruder access to devices.
Well Pandora FMS, among all of them, proved to be the tool that better looked after device health.
That its essential security feature is simply to prevent device malfunction thanks to monitoring, was something that stood out above the rest.
Any special memories of such an incredible journey?
It’s a tough question, because the whole trip was incredible.
The kindness and “brotherhood” of the people was shocking.
It was surprising the diversification of cultures that we experienced with people from all over the world, and the number of students who visited us asking really difficult questions to answer…
But, if you insist, I’ll tell you a very funny moment that stuck with me.
During a demo we could see that a group of students from the women’s university in Riyadh stared at us and laughed.
When we finished the demo, we invited them to ask things about Pandora FMS and we took the opportunity to ask them why they were laughing during my demo, you know, in case we had failed at something…
Their answer, while laughing, was that the word “Pandora” in Arabic is “Tomato”.
For the rest of the event we struggled, at the booth, to say Pandora FMS without a smile on our faces.
Want to find out more about Pandora FMS?
The total monitoring solution for full observability
Contact our sales team, ask for a quote or solve all of your doubts about our licenses.
When monitoring the software components of a server, sometimes you may need to find out some additional information about the performance of the metrics you monitor.
Sending additional information in email alerts
This is all about putting data into context, because 25 is not the same if it is 25% of a CPU, or 25% of a CPU with other three more CPUs, all of them at 100%, or 25% of a CPU of a computer about to be blocked by excess of I/O transactions that has been overloaded for hours, which has risen the system’s temperature to the maximum.
Isn’t it true that “25” can mean many things? Let’s dig a little deeper into it
Continuing with the previous case, suppose that you wish to measure the CPU usage in one of the servers you manage, and where you defined thresholds that force notifications by email to computer managers.
This threshold (CRIT for CPU > 80) would be reflected in the module configuration as follows:
The alert is defined using the template“Critical condition” and I use the action of sending custom email to send to a specific mailbox.
Okay, so far it’s kind of basic.
But you may like to be able to send some additional information about the problem, something to collect only when needed, real-time information that is useful for you to find a solution automatically.
But…. Can Pandora FMS do this?
Well, you may include information from other modules in the email using alert macros that reference other modules.
moduledata_X_: It will show the data of the “X” module of the same agent as that of the module that triggers the alert.
That way, if you have a module called LoadAVG, calling the macro _moduledata_LoadAVG_ you may dump the value of the system load.
Likewise, to show a graph of the last 24 hours of that module, you should use the macro _modulegraph_LoadAVG_24_
*This last thing about the graph is still experimental, until version 772 it will not be available to everyone.
Showing procedures
Perhaps you would like to include textual information about what to do in case your module is set into CRITICAL, as some kind of instructions or procedure. To that end the macro _alert_critical_instructions_ will return the text that you configured in said module for this case.
Showing previous data
You may also be interested in showing the previous data on this monitor before the alert was triggered; to that end you may use the macro _prevdata_
Showing agent informational custom fields
Imagine that you have a field in the agent that collects data, which tells you the name of the system administrator and their phone number, as custom agent fields with ID 7 and ID 9.
To that end we would use the macro_agentcustomfield_n_ as macro_agentcustomfield_7_ and macro_agentcustomfield_9_ and thus be able to add to the email the name and phone of the person in charge of the system.
A full example, using macros in an email
Let’s now see an example!
If you wanted to send a somewhat more complete email, edit the email action you are using to add new macros:
Using dynamic information
What if you want to go further?
What if you want to execute a command every time something happens and collect the value to send it in the email?
That way, you do not need to have a constant additional metric when monitoring so as not to fill the database with information that is only useful in critical situations.
In order to submit additional information, it will be necessary to create a previous module in your software agent so that it collects the information only when necessary.
With that purpose in mind, enter the following structure within your module:
module_begin
module_name MODULE_NAME
module_type async_string
module_precondition > X COMMAND_TO_RUN_AS_CONDITION
module_exec FINAL_COMMAND_TO_BE_EXECUTED
module_end
The module will have to be asynchronous and with the type of data that you will collect.
This is due to the need for this module not to go into an unknown state, thus giving a false perception of failure, when it does not meet the module’s precondition.
A condition expression will have to be incorporated so that you may run the module normally.
For that purpose, run a previous command from which to obtain the numerical information to obtain the data. Following the example of the CPU described above (which is higher than 80%) it would be something like:
Once you create the module that will only be executed when necessary, enter this information in your email.
For that purpose use the following macro within the email:
_moduledata_TOP5_CPU_Proc_Usage_ This is only a way of using it to send the additional information, you may use it for other cases such as for example if the disk usage of a server is reaching the limit, you may show the five heaviest files saved on the server using the command “du -Sah/ | sort -rh | head -5”
Pandora FMS blog has a very clear purpose: for you to find out everything there is to know about the largest number of rare words related to computing, technology or monitoring, so you can show off among your peers (with whom the hell may you brag about this).
Today it’s “Hyperconvergence“! It may sound like something about spacecrafts going into a state close to the speed of light or psychic-type Pokémon attack, but no, it’s something else!
Do you already know what hyperconvergence is? Let us tell you about it!
Relax man! I’m not going to explain it… we better let an expert in the field speak, our dearest Chief of Systems, Mario Pulido.
Extraordinary Mario, sorry for the alliteration, could you explain to us what this hyperconvergence thing is?
Hyperconvergence is a virtualization platform in which hardware resources (CPU, RAM,..), storage, network connectivity
and pre-installed software are combined into a single manager.
This improves the scalability of the resources needed for
each of the services installed on the platform.
It also allows implementing HA, flexible, etc. environments running on virtual machines or in containers, depending on the need for resources within each environment.
Wow, and what is the structure of hyperconvergence made of or what does it include?
Well look, it is made up of a set of computer systems that provides the main hardware resources (CPU, Memory…), a storage system, networks and software.
All these resources are organized through a hypervisor, which is designed to be able to manage all the hardware and software resources necessary to establish the final service that needs to be implemented.
Is it true that there is a convergent infrastructure? What is the main difference between converged and hyperconverged infrastructure?
Yes, there is, of course they’re not the same, and the main difference between the converged infrastructure and the hyperconverged one, is that the hyperconverged one adds a top layer of software that allows to unify the management of different virtual services, containers… and to manage from that software, or device, all the resources to provide the service needed.
What would be the business benefits of hyperconvergence?
You’re one-track minded, aren’t you?
Well, above all, speed and ease of deployment, but also the ability to scale.
A unique appliance that integrates computing, storage and storage networks, everything integrated.
Process automation and higher control over the infrastructure elements, managing everything from a team of people, thus reducing personnel costs.
¿And for Pandora FMS? Our beloved company and increasingly more people.
Pandora FMS suite may require the deployment of multiple servers to obtain full infrastructure monitoring in an on-premise or Maas environment.
For that, it may be necessary to implement several VMs to install several Nodes in HA; to implement VMs to implement the Metaconsole; docker environments to start WUX or Elasticsearch containers, Satellites…
Hyperconvenience helps us in the implementation and deployment of the full Pandora FMS server environment, its possible vertical or horizontal scaling, as well as pre-production or backup environments to carry out tests and customized developments.
As with most of the services needed in a company, hyperconvergence makes it easier for us to implement Pandora FMS service.
Thank you very much Mario! It is always a pleasure to have your encyclopedic knowledge to reveal the truth to the world!
If you have any doubts, however small, do not hesitate to leave your questions in the comment box. We promise a quick, concise and loving response.
Christmas! That endearing time in which the streets are covered in lights, fallen leaves and warm couples holding hands.
Children smile and the chimneys smoke. Gingerbread, nougat and homemade almond cake become our sweet treats and, if we are lucky, a friendly family member offers to give us the Christmas bonus.
Yes! At Pandora FMS we love this time of year and we could not miss, for nothing in the world, to wish you a Merry Christmas 2022!
Merry Christmas 2022 from the whole Pandora FMS team
On these days we like to have sweets and for us there is nothing sweeter than each of the small and great achievements that we managed to unlock this year.
A sometimes difficult year, but thanks to our team, our customers and users we managed to successfully get by.
Pure product
Throughout the year, Pandora FMS has released a series of releases on a monthly and steady basis.
They have included all the evolution, innovation and fixes that Pandora FMS workers have added to our tool.
There have been so many improvements that it would be impossible to discuss them all in a single article, but we’ll leave here just a few:
Alert templates with multiple schedules
The possibility of including several schedules for both module and event alerts has been incorporated. With this new feature, different time slots can be generated within the same day or week, where alerts can be generated.
Support for MySQL8 and PHP8
We included support to be able to use MySQL8 without any type of modification or previous adjustment. We also prepared the console to work on PHP8 since the PHP7.4 support ended on 28 Nov 2022.
New report types
Custom Render
TOP-N connections
Agent/module
Agent/module status
SLA services…
LTS started being implemented
LTS versions are aimed at consolidating all changes of the RRR versions and offering maximum stability. Only two a year:
The possibility of a new service representation has been added.
This will be a centralized view where you may see the details of the tree node through a tooltip when hovering with the cursor.
Scheduled agent autoconfiguration application
Added the ability to schedule the appliance of Command Center agent auto-configuration rules automatically.
IPAM from Satellite
From Pandora FMS 764 RRR version it is possible to define IPAM network scanning from the Satellite server, indicating it in the Satellite server configuration file.
Improved network maps
Multiple changes have been made to network maps to improve the usability, performance and network map setup.
Map drawing and refreshing is automatic and dynamically reflects the changes in the network, highly improving the existing display in previous versions.
The possibility of deleting “Pandora FMS” node as well as all its relationships has been added. Usability has also been improved in manual relationship management between nodes.
Added linking between network maps. When there is a dummy node pointing to another network map, it will be possible to access that map from the dummy node options.
Report sending by mail as an alert action
A new feature has been added to Pandora FMS alert system whereby it is possible to send reports by email in PDF thanks to its incorporation as new actions/commands within Pandora FMS.
Trap history
The possibility to generate a trap history in the history database has been added to improve this feature’s performance in the console and improve the main database’s performance.
Credential store: WMI and SNMP
Although the credential store already existed in Pandora FMS, the possibility of saving them to be used in WMI and SNMP modules has been incorporated.
Forbidden password list
Added a password exclusion list so that the system does not let users enter certain weak passwords, thus strengthening the system’s security.
Pandora FMS Roadmap 2023
We want to take a qualitative leap to make Pandora FMS not only the most flexible tool on the market, but an essential part for IT management and daily operation.
That’s why we’re working on process automation thanks to powerful Artificial Intelligence, the creation of a CMDB, security monitoring and automated deployment.
For more news
But, as you know, it doesn’t end here.
Pandora FMS does not take a rest on its evolution and development and so that you do not miss any news, we leave you this link here.
Follow our change log and you’ll always be up to date!
Our headlines
Pandora FMS and drought monitoring
As you know, this summer half of Spain was on drought alert. A consequence, without a doubt, of the extreme summer heat and the scarcity of rains.
Thank heaven and science, technology experts already point out some solutions to reduce the impact of this type of phenomenon.
And we are very proud to say that among those solutions there is Pandora FMS.
Pandora FMS gets Red Hat Enterprise Linux software certification
Yeah, yeah, yeah! Thank you all!
At Pandora FMS we are in luck, we now have Pandora FMS RHEL8 software certificate.
Pandora FMS brings the Internet to 500,000 people in Brazil
We said it just like that but…
More than 500.000 inhabitants of the working-class district of Povo do Acre, located in the northwest of Brazil, have Internet connection thanks to the collaboration of our company.
What a great work!
Pandora FMS becomes an M81 partner to make IBM i system monitoring easier
Well, well, look at that! This year we became an international benchmark in system monitoring by becoming a technology partner of the French company M81.
As many of you may know, the French platform has extensive experience in the sector since its foundation in 1988 and is currently considered one of the great experts when it comes to monitoring IBM i systems.
As a brand, we will now have the opportunity to transfer these types of solutions to Spanish companies to improve IT management and the efficiency of the different work areas.
Pandora FMS receives the Emerging Favorite mention in Capterra’s Shortlist of server monitoring software and APM
Prizes! Awards! Medals! Honorary pins!
Yes!
We are proud to announce Pandora FMS as the winner of the Best Usability 2022 badge in the Network Monitoring category.
Apart from its mention as an Emerging Favorite in the 2022 Shortlist of Server Monitoring and APM Software from Capterra, the world’s leading software review platform.
Coastal municipalities monitor their beaches to measure the environmental impact of tourism
This year the Spanish tourism sector has had a record summer.
90% of foreign tourism that visited the country in 2019 was recovered this summer.
Therefore, the administrations of the main tourist centers were reinforced with the technology necessary to control capacities.
Yes, by “the technology necessary” we mean us.
We loved helping to improve the performance of public services and minimize the environmental impact this summer.
The arrival of Pandora FMS in the United States thanks to the master’s degree of Rice University
Pandora FMS is an international entity and needs activity.
And in search of that activity we set our eye on that great technological power, the United States.
In the end we managed to count on a native and capital team, with five senior professionals who helped us with their proposals and whom, in turn, we helped with their project.
Madrid improves EMT services by monitoring its bus data
The public service of buses of Madrid, the EMT, was one of the protagonists of Global Mobility Call developed between 14 and 16 June at the IFEMA.
The company from Madrid exposed its future plans tracing the route to continue transforming the capital into a smart City where sustainable mobility and independent vehicles acquire great relevance.
Nevertheless, executing this plan would be impossible without technology characterized by generating data on a steady basis.
Therefore, the city went for data control through monitoring. (That is us!)
This is the secret of the success of the EMT, who has already established a monitoring system thanks to Pandora FMS.
Pandora FMS at the top of G2
G2, a platform that currently has more than 60 million visits a year, and in which users can read and write quality reviews on 100,000 software products and other professional services.
That is why it is so important and honorable that Pandora FMS has become part of its Top 10 of the best Network Monitoring software.
Conclusions
And these are just a few small strokes of all the success we achieved throughout this 2022 thanks, we repeat, to all of our colleagues and to all our clients and followers.
That is why we will not stop repeating it over and over again:
Merry Christmas 2022!
May you have all your loved ones as close as the frozen bottle of champagne and the mix of chocolates, sweets and nougat!
Would you like to find out more about what Pandora FMS can offer you?
Pandora FMS team will be happy to help you!
And if you don’t want to miss out on any of our new features and you are into IT, releases and, by all means, monitoring, we wait for you in our blog and our different social media, from Linkedin to Twitter, not foregetting Facebook of course.
We even have a Youtube channel with the best narrator voices ever. Oh, and we also recently got our Instagram channel. Follow us! We still have a long way to go to match that of Billie Eilish!
Pandora FMS Community was first launched sixteen years ago. Today, it has more than 2.5K active members* that visit it to participate, learn, answer questions, and contribute everything they can and know.
*4.6K discussion threads and over 16K responses.
But the time for change has come!
The new Pandora FMS Community is here!!!
With the growth of the community, and the extensive scope of useful content available, we knew it was time to invest in updates to support our users and welcome new members with open arms.
We migrated to a new platform.
A platform for Pandora FMS Community that allows new user experience with categorized questions and answers as well as private and public groups. New knowledge base and integrated blog.
But don’t worry, all the previous links are redirected to your new home!
The question is: Why are we launching a new community site?
Simply put, we want to help our whole community connect, collaborate, and share knowledge in every way possible.
And this launch is our particular investment to provide you with the technologies and capabilities to enhance your experiences and increase support, education and contribution.
Restricted group for users who manage complex Pandora FMS configurations (Open or Enterprise) and want to contribute. Discuss the roadmap, usage issues… Access to unpublished material will be restricted.
Pandora FMS Beta program helps to publicize what is currently being developed in Pandora FMS, both in the Community and Enterprise versions, accessing development versions generated daily.
These versions can be used to test new features, evaluate bug fixes, and evaluate development progress in test environments.
Since the group is closed and small, it is an excellent group to propose improvements, usability failure detection or non-contemplated use cases, etc.
To join the group, which is a restricted-access one, you must request access through our community website.
In this group there are community users and Enterprise version customers alike, there is no need to give away any personal data or identify yourself in any way, all those who want to be part of the group and can contribute something are welcome.
Whether you are an IT company professional, a teacher of a technical course or an open source enthusiast, this group is geared towards helping coordinate Pandora FMS working groups and events.
Categories established with different topics
Range ranks and badges with karma system updates
Private messaging on the platform
Its main differences with the previous forum?
The previous forum was limited to questions and answers, a forum for pure and simple discussion.
The new Pandora FMS online community, in order to enhance bilateral communication between users, integrates many more options apart from the forum:
Its very own blog.
A knowledge base.
Public and private groups.
Q&A.
Resources.
Private instant messaging.
Online merchandising store.
In short, we wanted to open a wide range of information, concentrated into a single place, to make it easier for all of our users to understand so much information, instead of just using it to their advantage.
Conclusions
The new Pandora FMS Community brings together in one place everything you may need to share, expand and improve knowledge about monitoring with Pandora FMS, both for Enterprise users and those from the OpenSource version.
It is not just about bringing together people with the same interest, but about taking advantage of the knowledge of the team and the community so that members can achieve their goals in an integrated way in the same place.
Would you like to find out more about the new Pandora FMS Community?