by Rafael Ameijeiras | Last updated May 8, 2024 | Tech
Find out what VMWare is and how to include it in monitoring
Before we dive into how to monitor virtualized environments with VMWare, let’s clarify a couple of concepts for those who are less into the subject, starting withWhat is VMWare?.
VMWare is a software product development company, mostly related to virtualization, and more recently to containerization, although this is beyond the scope of this article. Today, we are going to focus on monitoring virtualized environments with VMWare.
To do this, the first step would be to know what virtualization is. A quick summary, and a bit imprecise I must say, but that will give you a general idea. We can claim that virtualization is like dividing the components (CPU, Memory, Disk, etc.) of a physical computer or server (which we will refer to from now on as Bare-Metal) into virtual or emulated components. This will allow us to share the same component between different instances which we will call “virtual machines.” That way, using a single set of hardware, you may have different virtual machines running different versions of operating systems, applications, libraries, etc. simultaneously and separate from each other.
The interesting thing about this is that, for the virtual machine (which we will refer to as VM from now on), the resources that have been assigned to it are only from it and are real elements. This opens a world of possibilities, it allows you to have many services and virtual machines running on a single hardware device with the energy, space and cost savings that this implies. In addition, since it is all at software level, it will allow you to manage the machine as one more file inside the computer, being able to copy it, modify it or even package and distribute it.
The advantages of virtualization are more than proven and today almost any service and infrastructure runs mostly on virtual servers. A very clear example is when you go to your favorite cloud provider and click a button to activate an instance of a database or a server, actually what you’re doing is activating a virtual machine that it already had pre-configured and that can work for you in a matter of seconds, thanks to this technology.
Due to these types of advantages, and because of the massive distribution of virtual machines in most ecosystems, it is so important to have a monitoring tool capable of adapting to this type of environment efficiently.
Now that we know what virtualization is, we will see a new concept. We already said that from a physical machine we can emulate and subdivide its components to create instances of smaller virtual machines, and it is true, although there is a small nuance, we require software devoted to this, we call this software hypervisor.
There are different types, manufacturers and features we are not going to delve into today. If you are interested in this topic and want us to do a more detailed article on virtualization leave it in the comments
vSphere
Today we will focus on one of VMWare’s most widespread and well-known products: the vSphere suite which, according to Wikipedia, “is VMware’s core business suite, the cornerstone on which almost all the business products they offer rely on. It consists of the ESXi virtualization software that is installed directly on the servers and the centralized management console vCenter.2020 ”
As we have seen, vSphere is the name of the set of tools that VMWare offers for device virtualization, there is a range of different vSphere environments, from a single ESXi server that works as a hypervisor as well as management.

To much more complex environments where several ESXi work in parallel being managed by a centralized administration software called vCenter.
Virtual environment monitoring
To monitor virtual environments, whether it is from VMWare or not, there are two main ways.
The first is to treat each virtual machine as an independent machine, attacking its operating system with standard protocols or using some monitoring agent.
This approach does not require for the tool have a special or devoted management, since it will deal with each VM as any other machine. Along this approach, we can say that we will interrogate the operating system, therefore, in heterogeneous environments, we must define metric captures for each system.
The second way is more general and allows deploying monitoring very quickly and efficiently. In this case we will integrate the hypervisor, since it has information on all the machines it contains and we can interrogate it directly. For each manufacturer the protocol, the responses and the format with which we will interrogate the hypervisor may vary, but in most cases they have an interface to communicate with it. Along this approach, it is the monitoring tool that must be adapted and have a connector to communicate with the supervisor in a centralized way.
Of course, Pandora FMS has both types of monitoring, being able to combine them if necessary if deep and detailed monitoring is required.
In today’s case, we will see the monitoring integrated in Pandora FMS Enterprise Discovery tool. That will allow us, in a very simple way, to connect well, either with a standalone ESX or with a vcenter, through the vmware SDK.
vSphere Monitoring with Pandora FMS
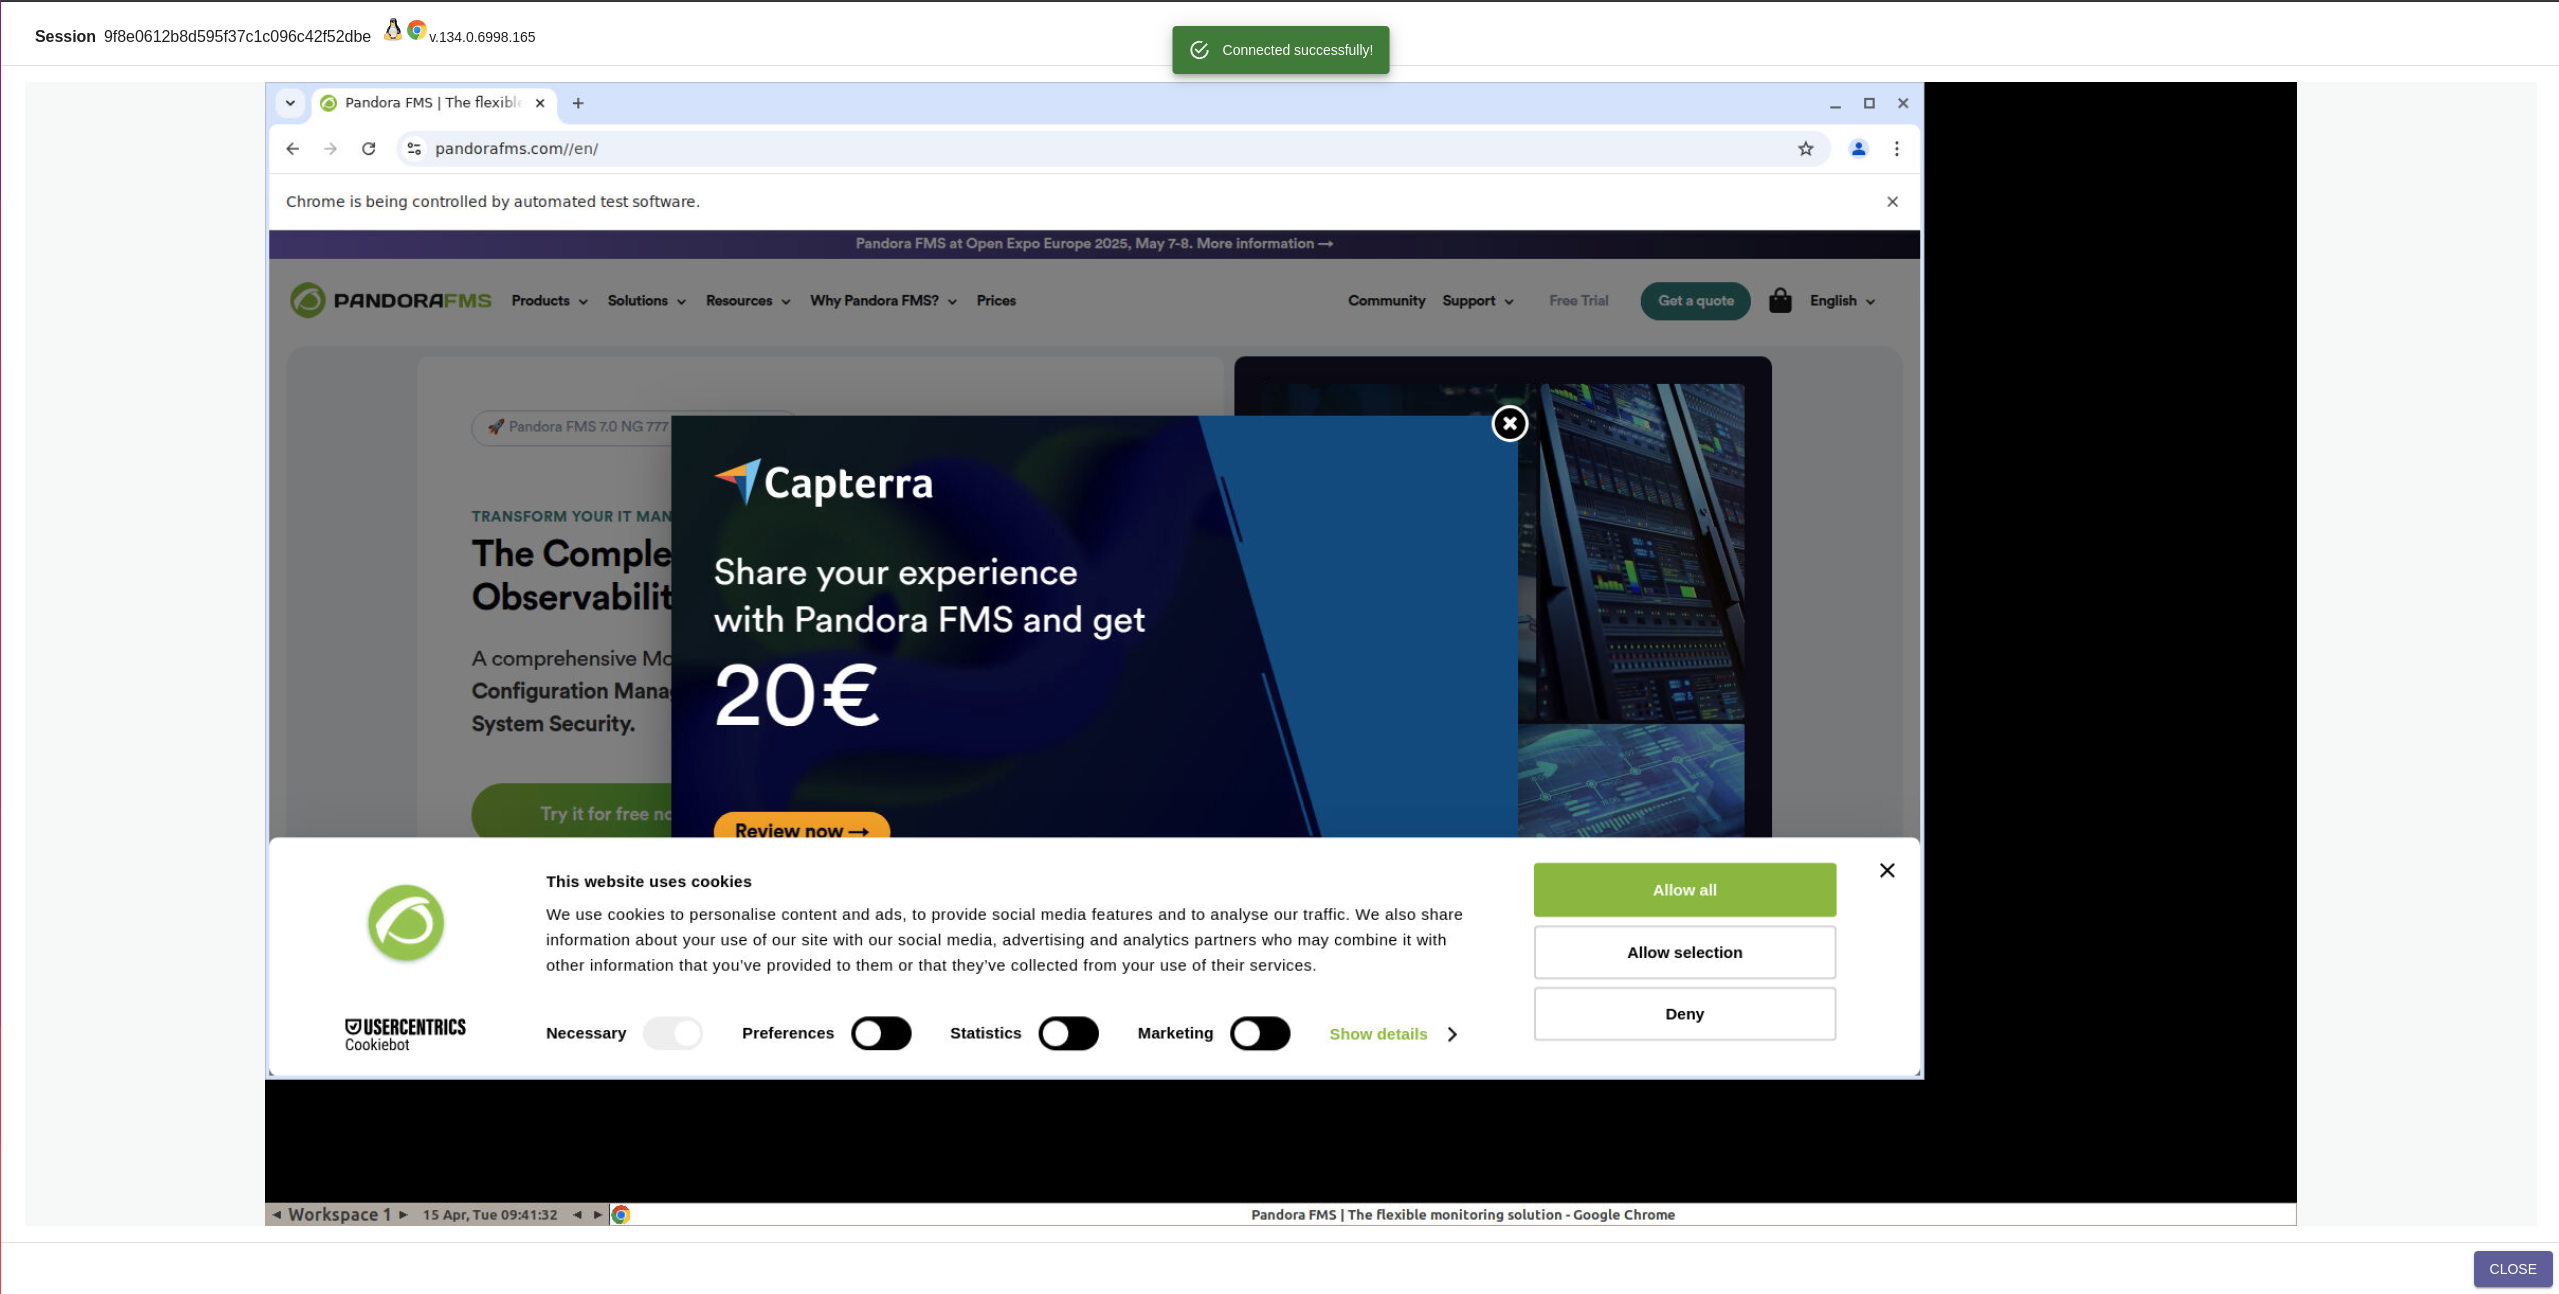
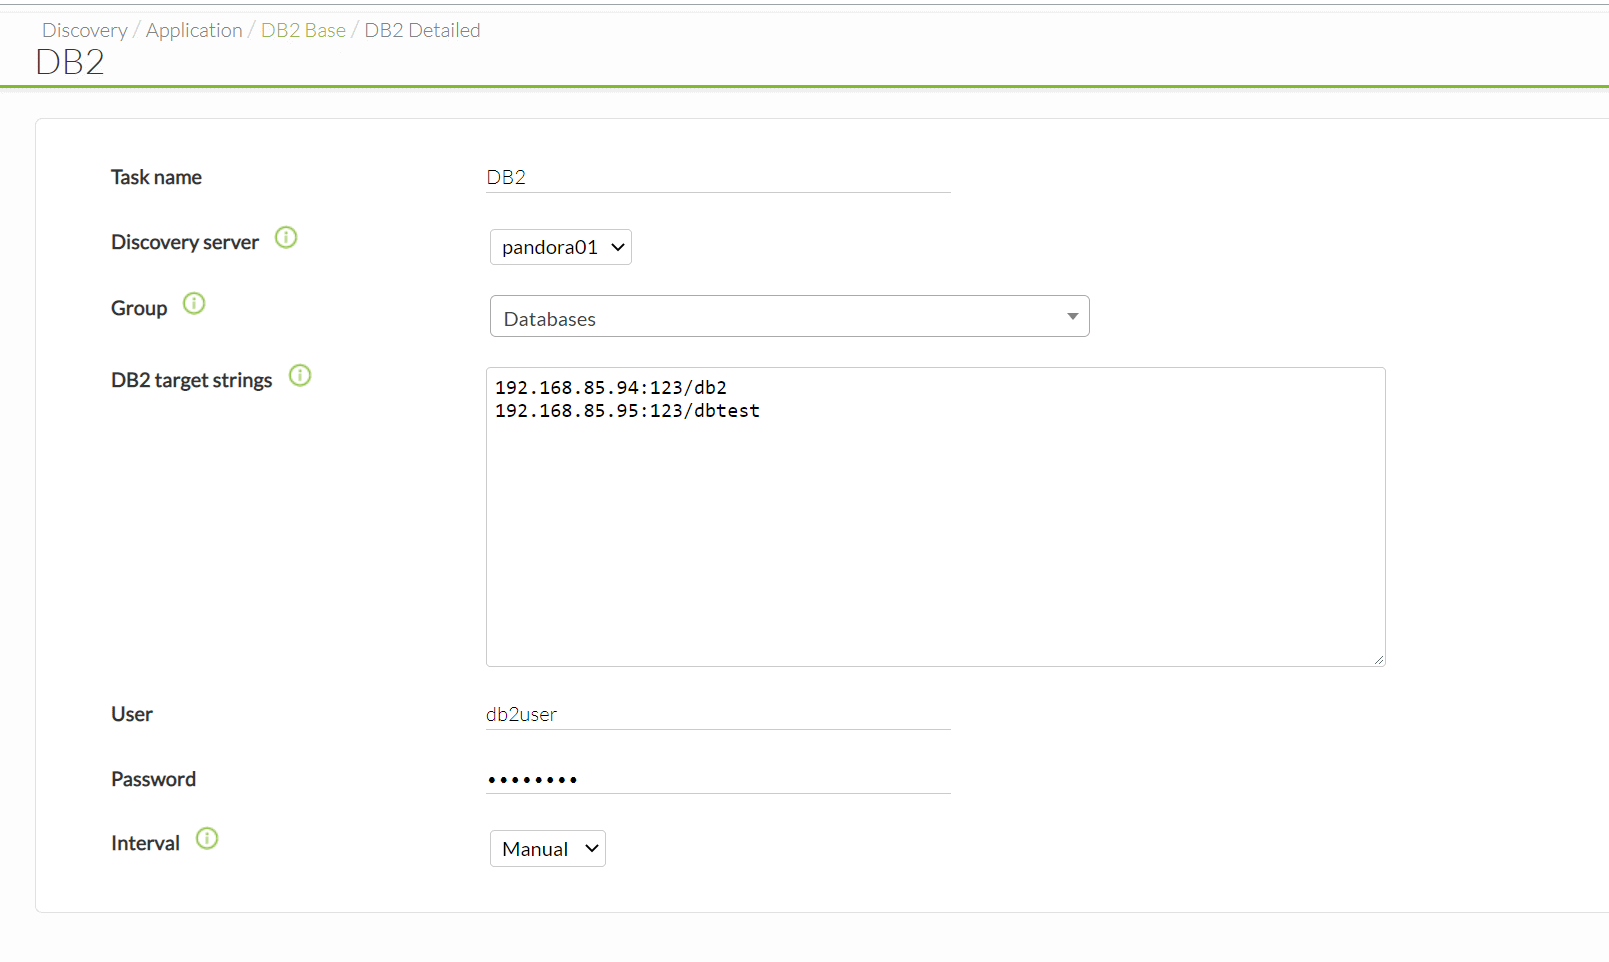
Starting from the fact that we have a Pandora FMS Enterprise instance, the steps are very simple: by default Pandora FMS has the necessary libraries to connect to a VMWare environment, you only need a user account with reading permissions and connectivity with the ESX or vCenter as the case may be.
Once you fill in the simple form with the data from our VMWare environment:
You will see a window to configure some monitoring data, such as the scan interval for new machines, the execution threads that you will devote to this task, if you want to activate network monitoring and (only for vcenter), if you want to capture the environment events.
You will also have a field for extra configurations that will allow you to add advanced configurations related to the task (you can see the possible configurations:
https://pandorafms.com/manual/en/documentation/03_monitoring/05_virtual_environment_monitoring?s[]=vmware#vmware 1 plugin ocnfiguration ).
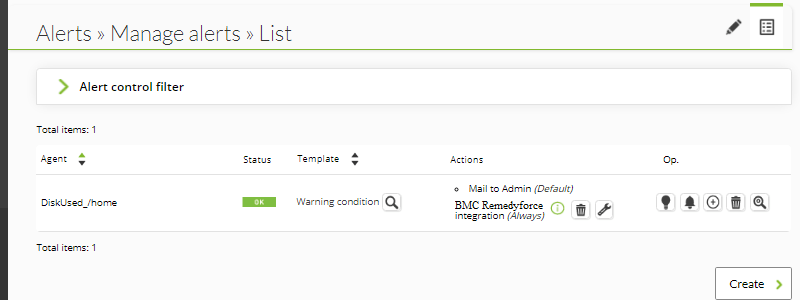
Once finished, you will be able to see that a task has been added to Pandora FMS task list, where you will be able to see its last execution, enable it, disable it or force task execution manually.
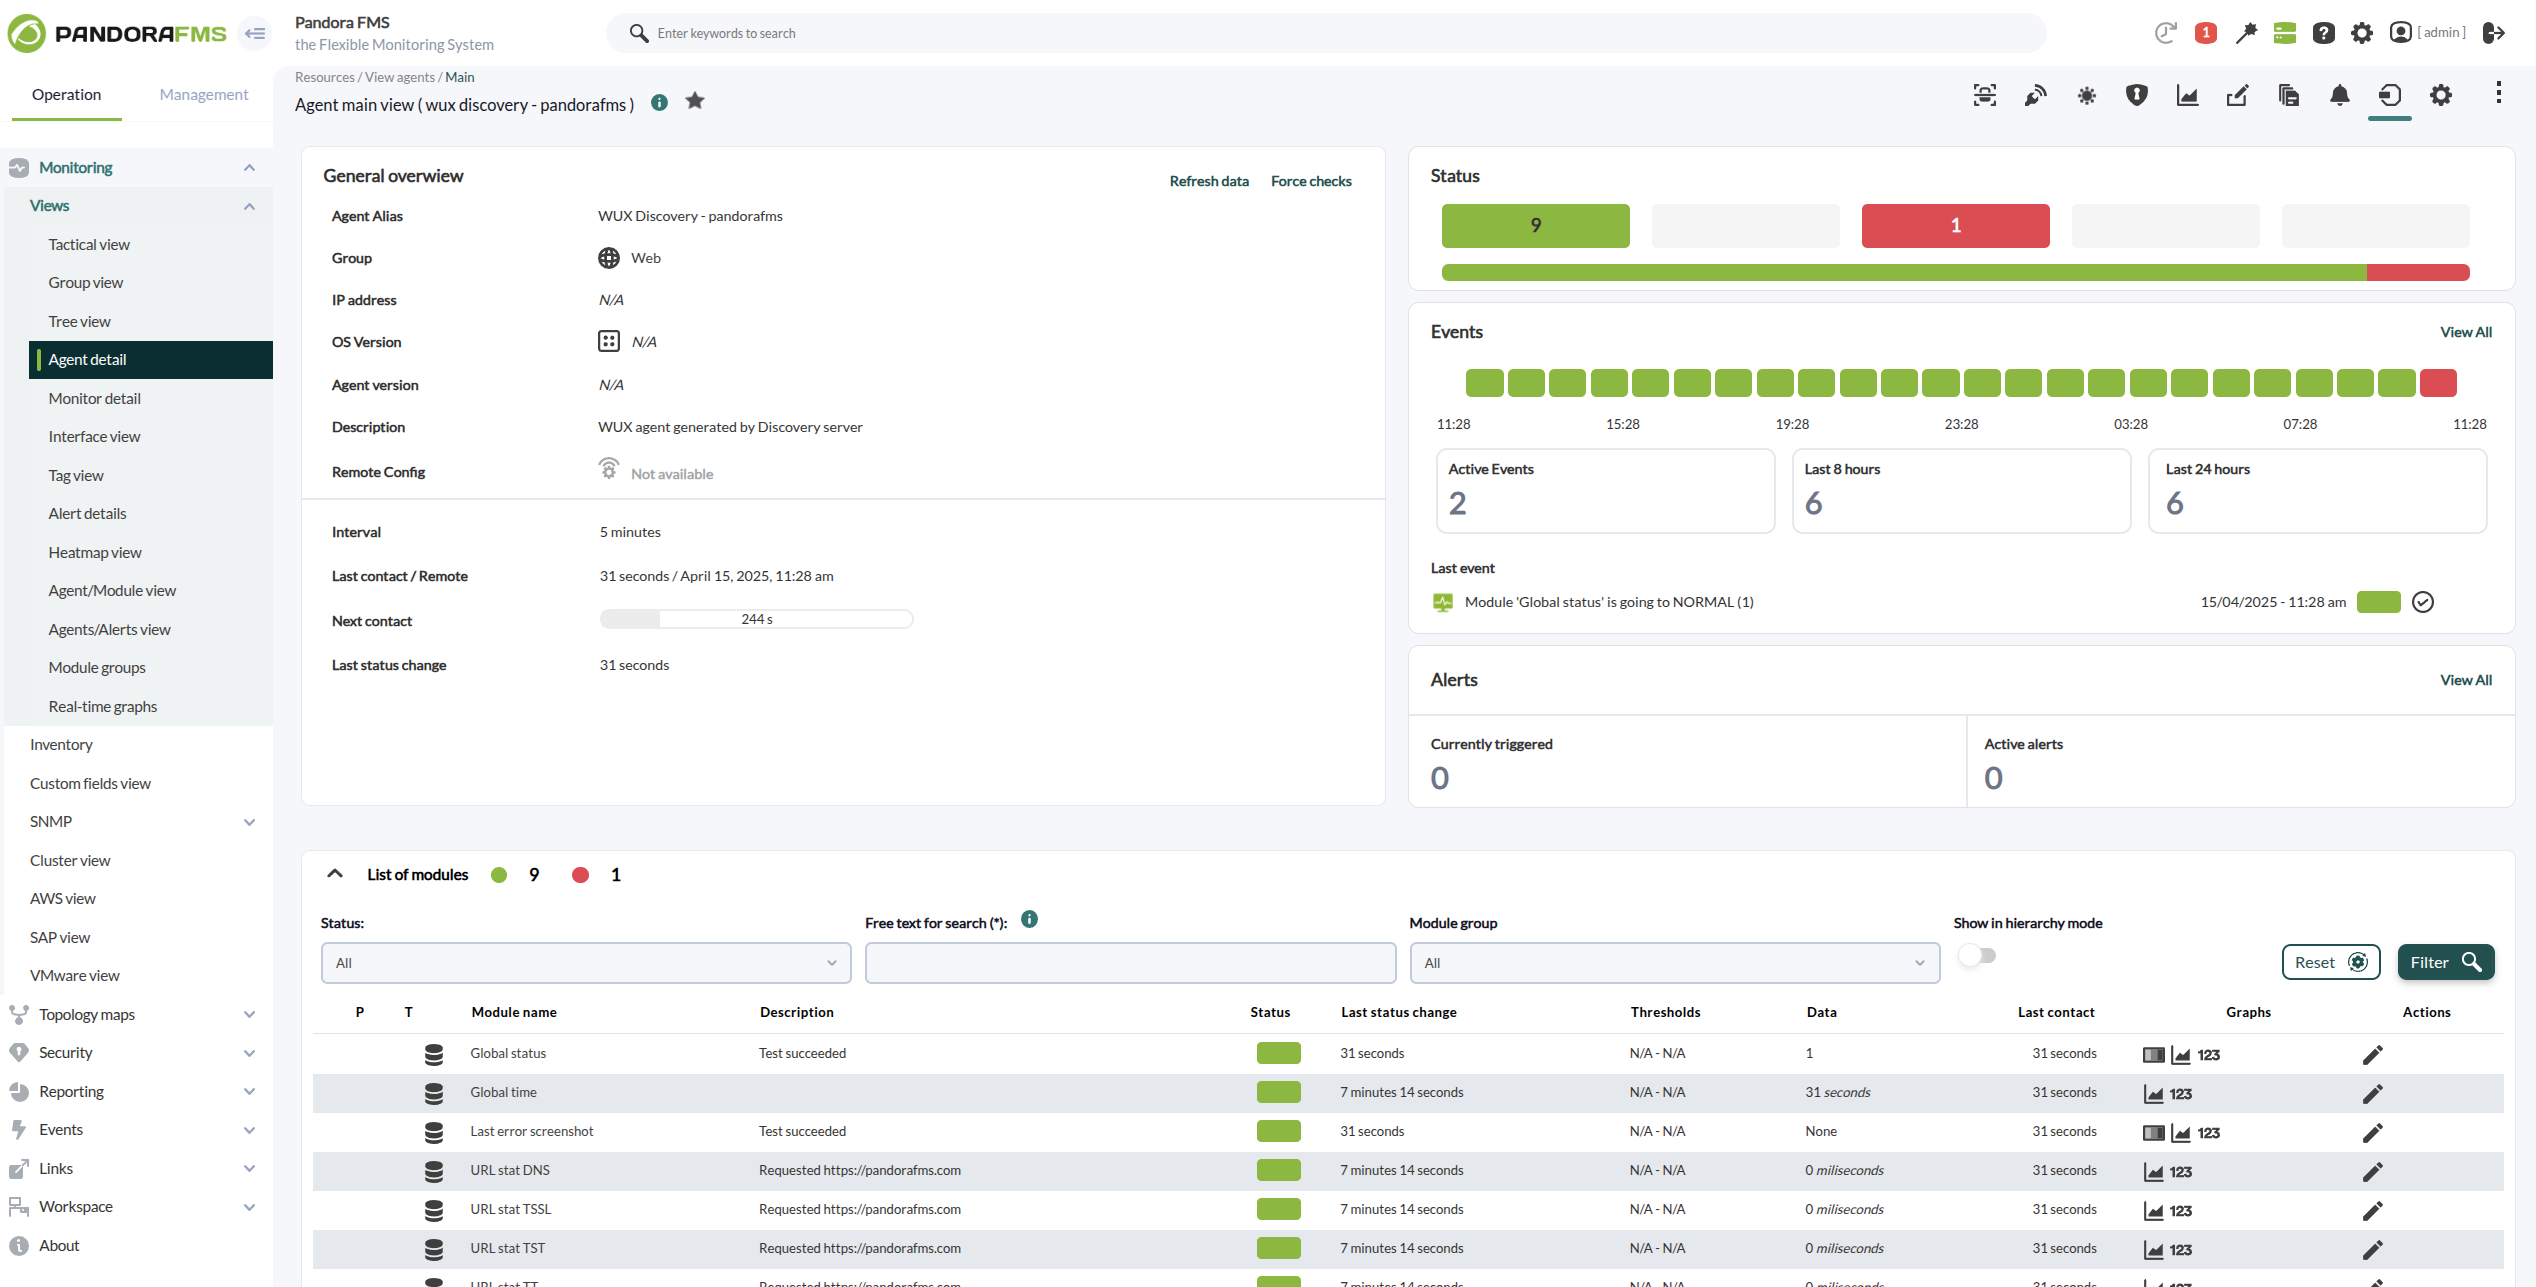
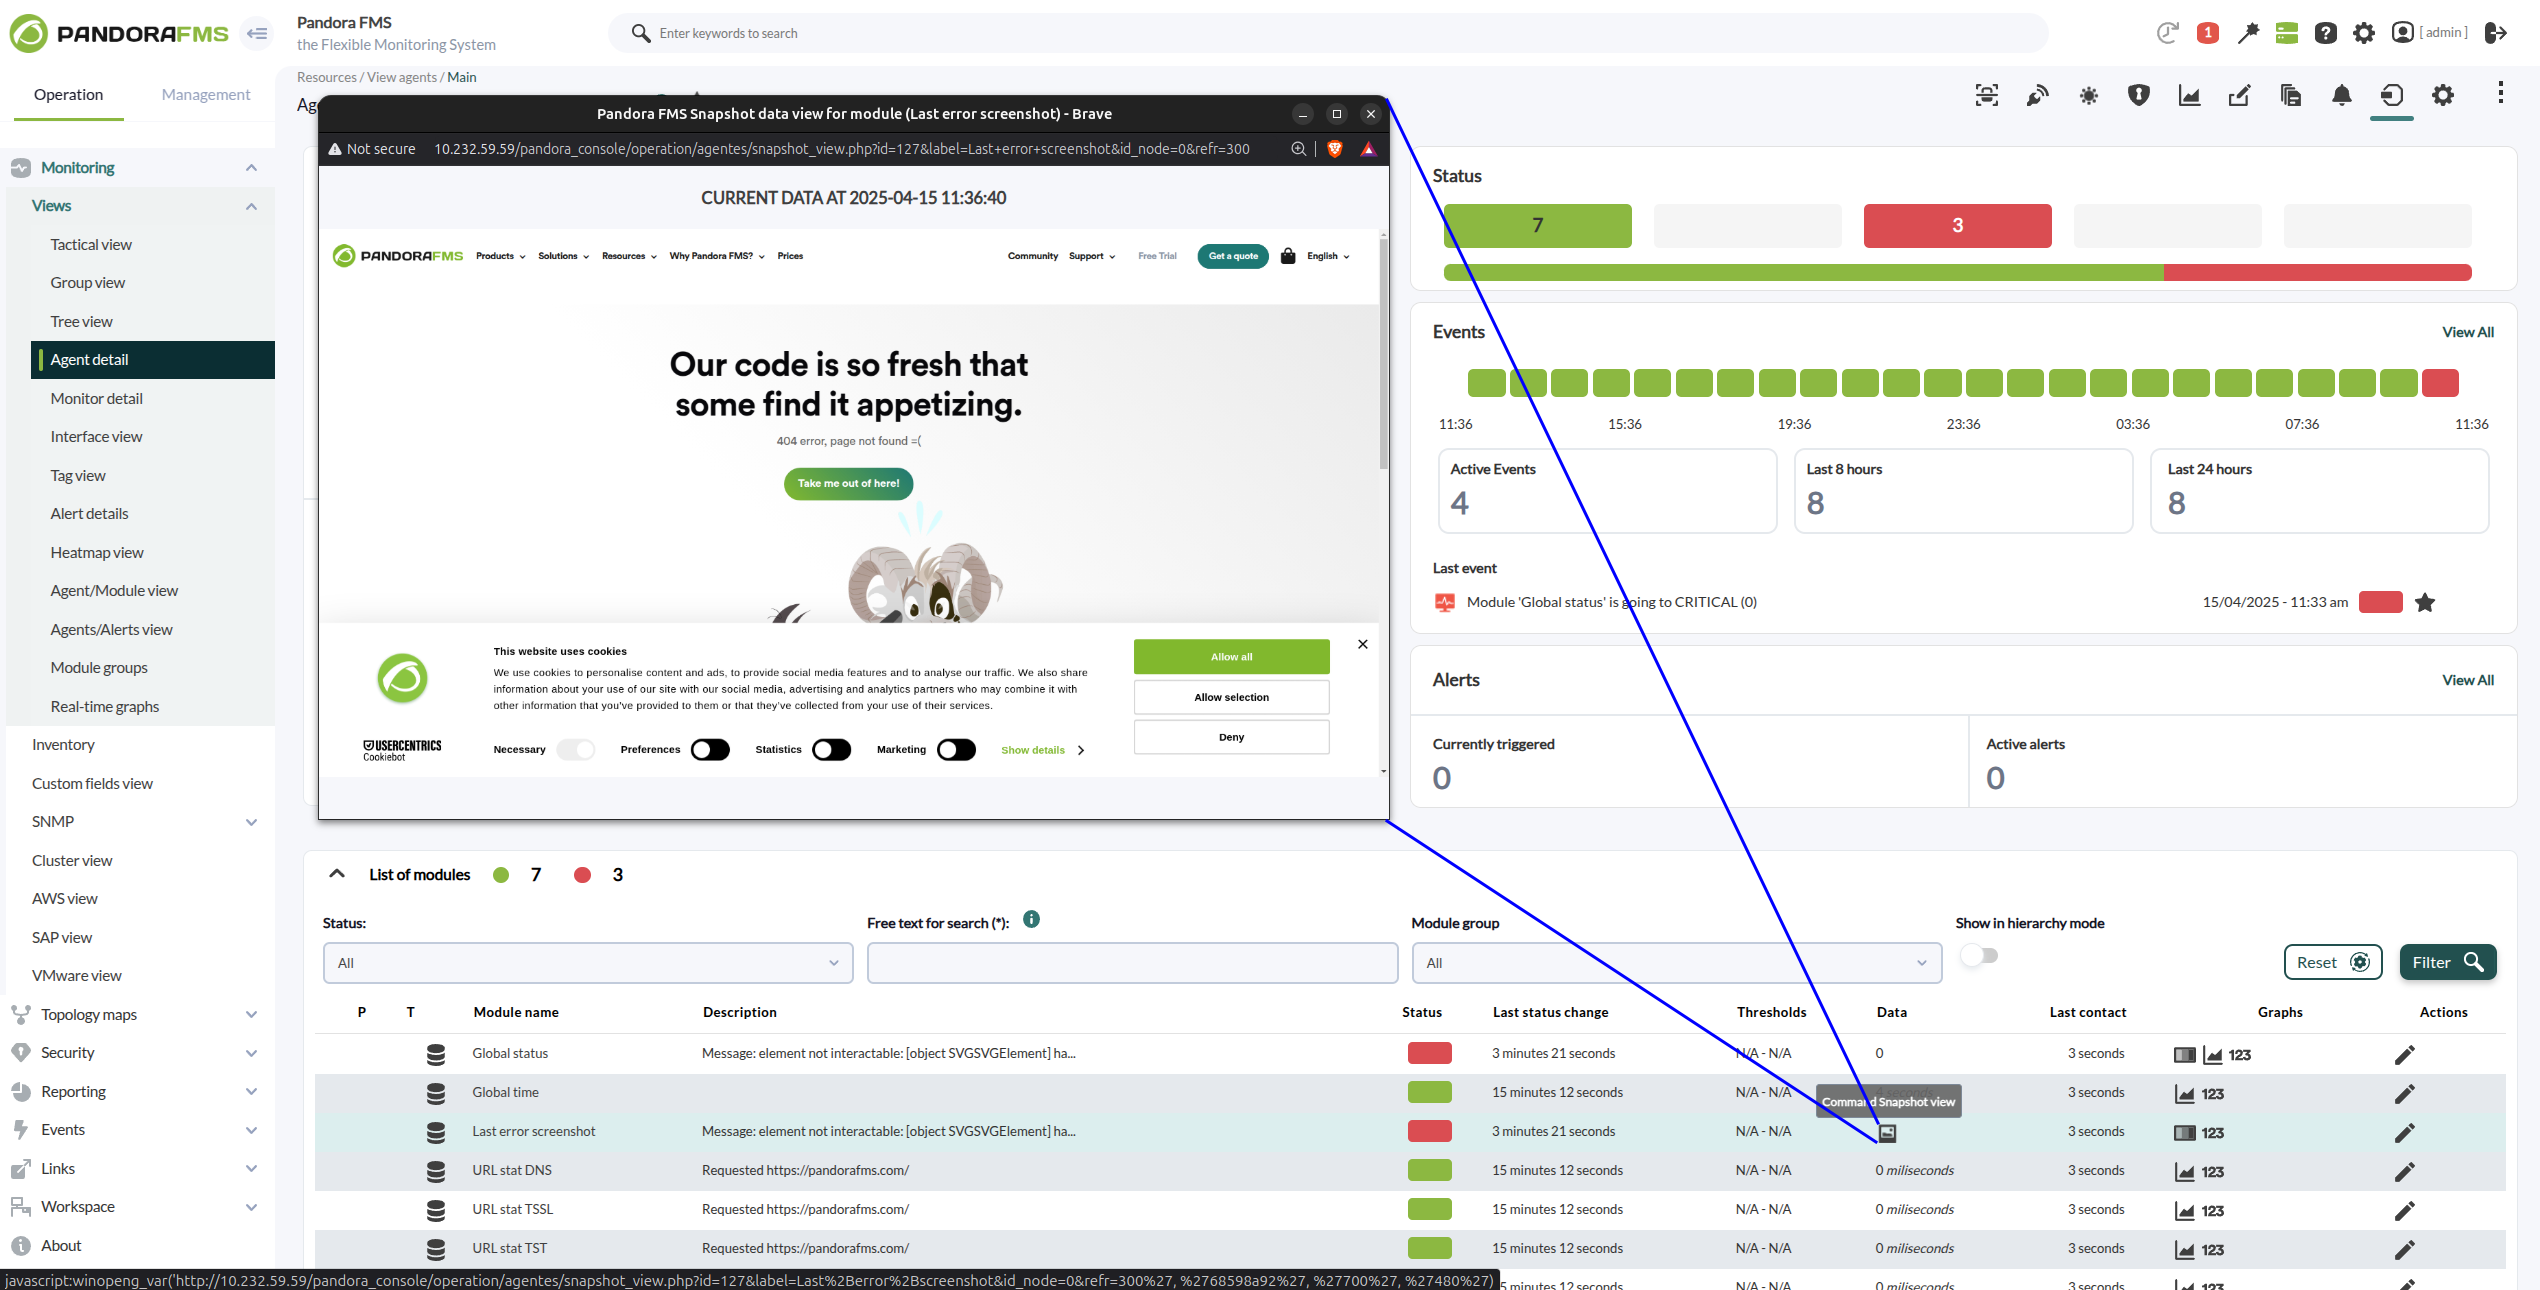
The default task will give you information about all the ESXs (in the case of vcenter), virtual machines and datastores available in the vmware environment that you configured, returning the following metrics:
Default monitoring for Datacenter:
Default monitoring for Datastore:
- Capacity
- Free Space
- Disk Overallocation
- Free Space Bytes
Default monitoring for ESXi:
- CPU Usage
- Memory Usage
- Received data
- Transmitted data
- Disk Read Latency
- Disk Write Latency
- Host Alive
- Disk Rate
- Net Usage
Default monitoring for virtual machines:
- CPU Usage
- Memory Usage
- Tools Running Status
- Host Alive
- Disk Free
- Disk Read Latency
- Disk Write Latency
- Received data
- Transmitted data
- Net Usage
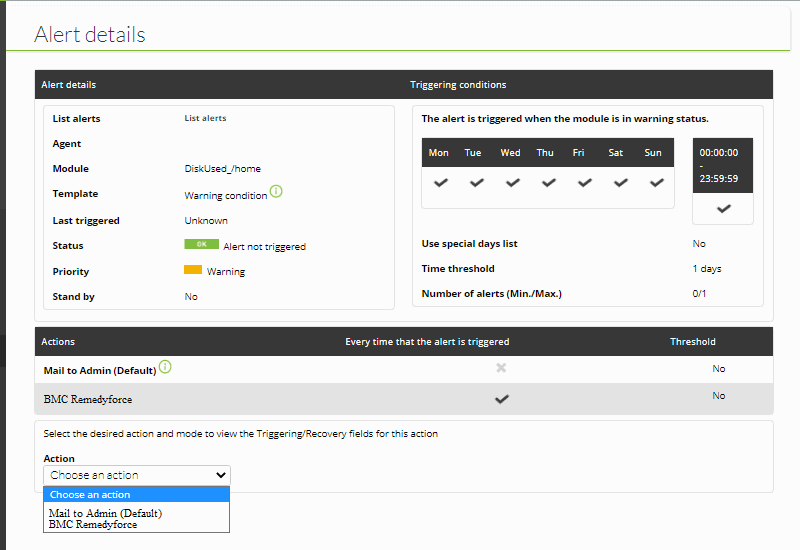
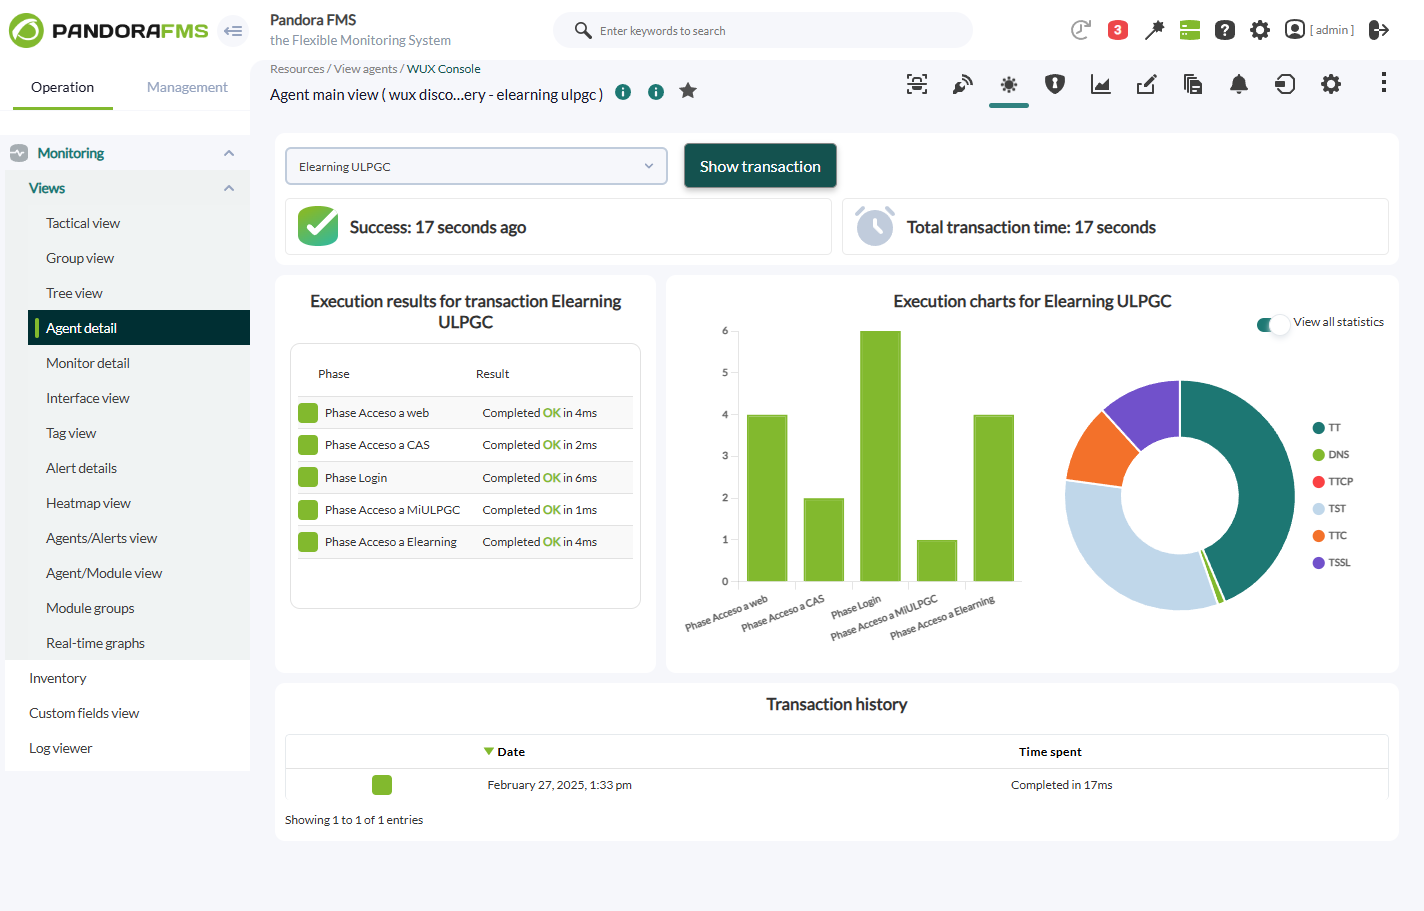
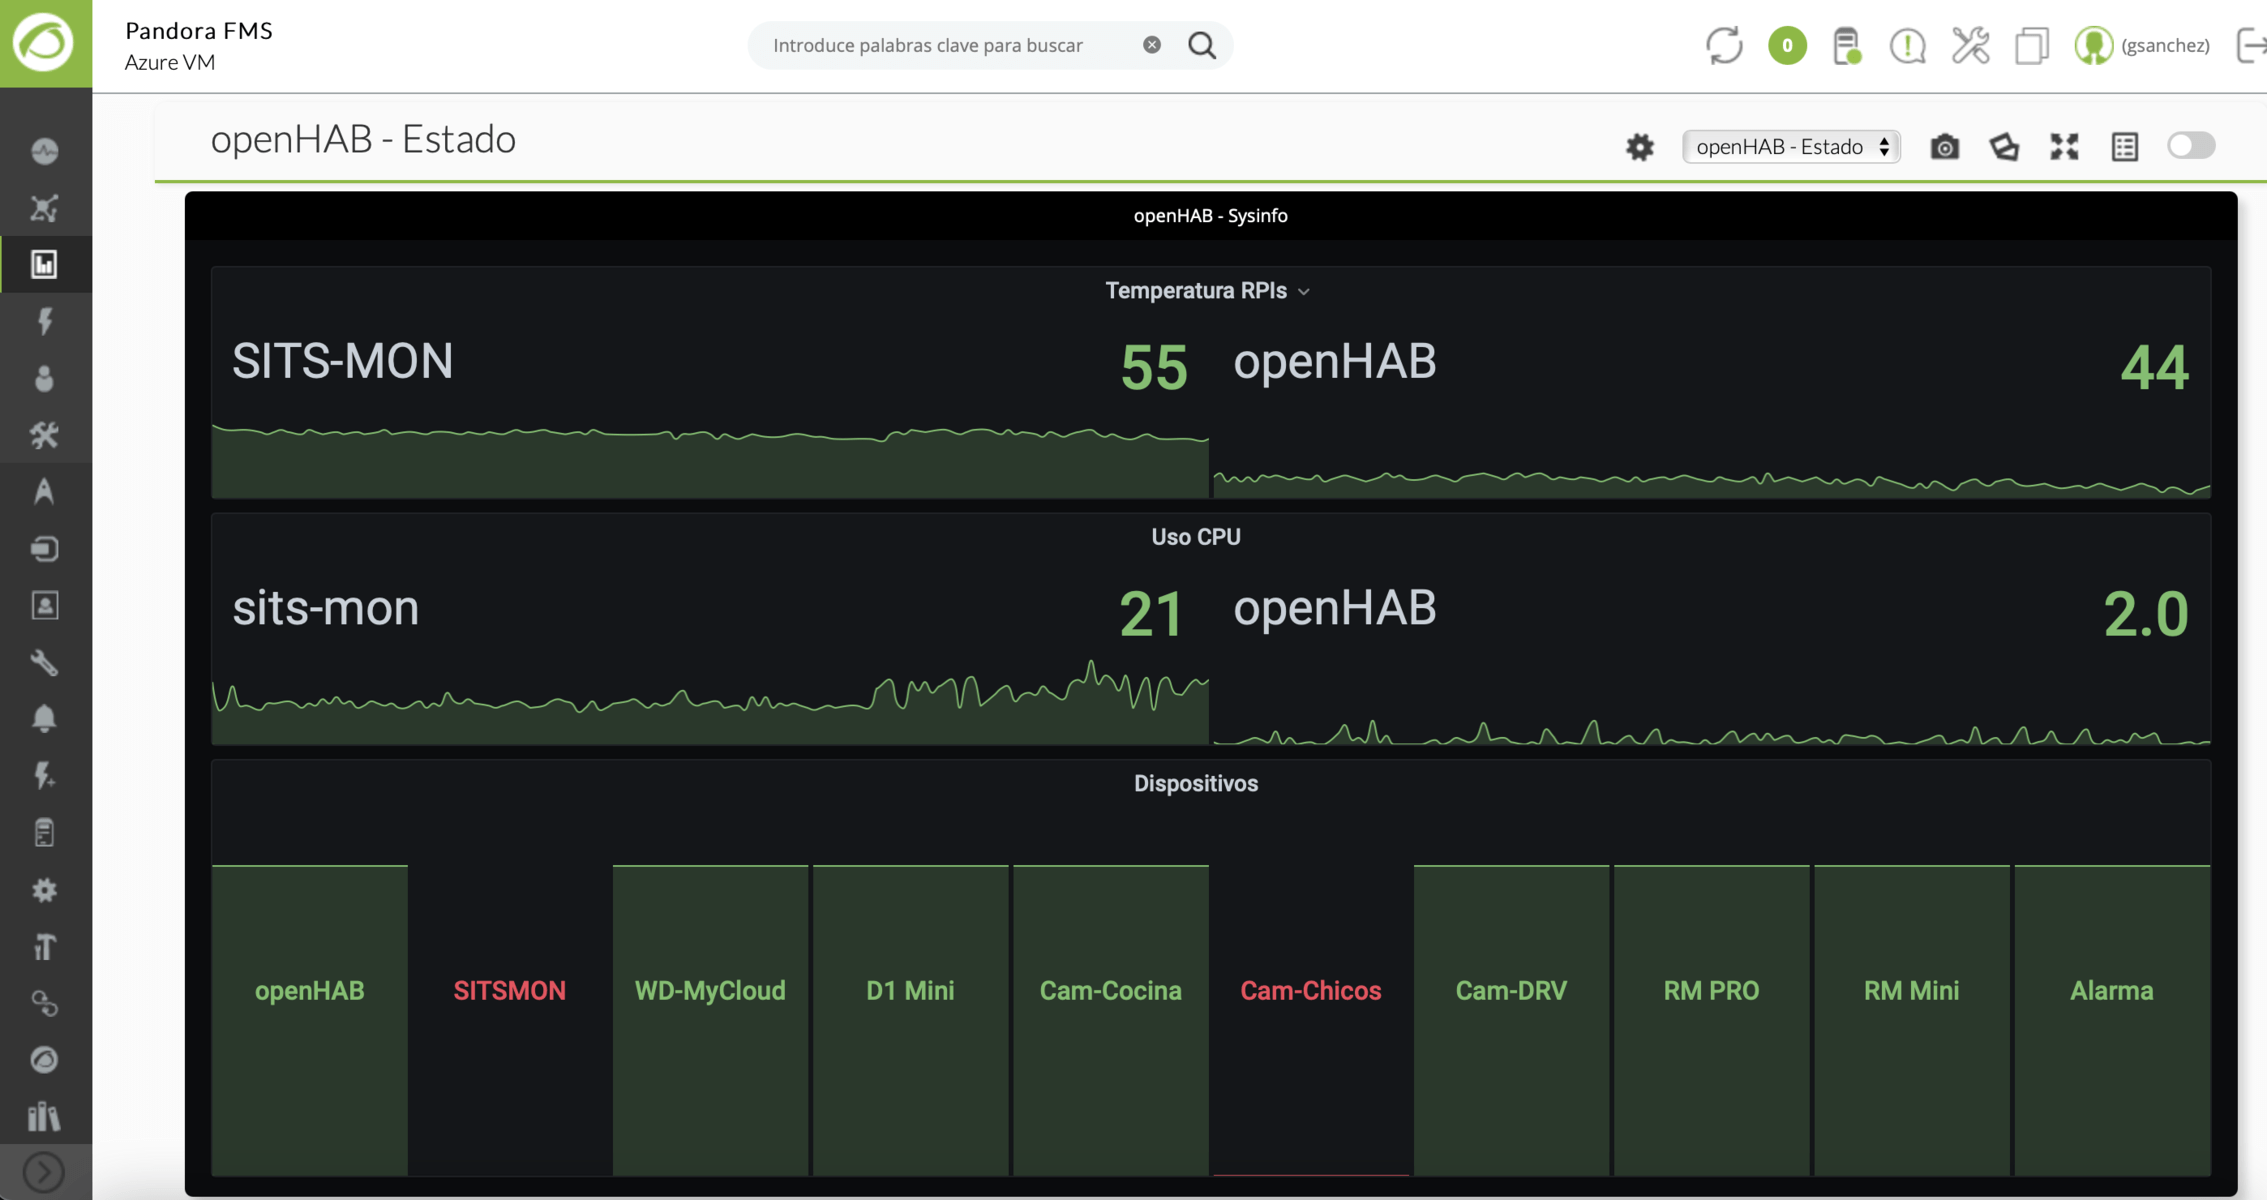
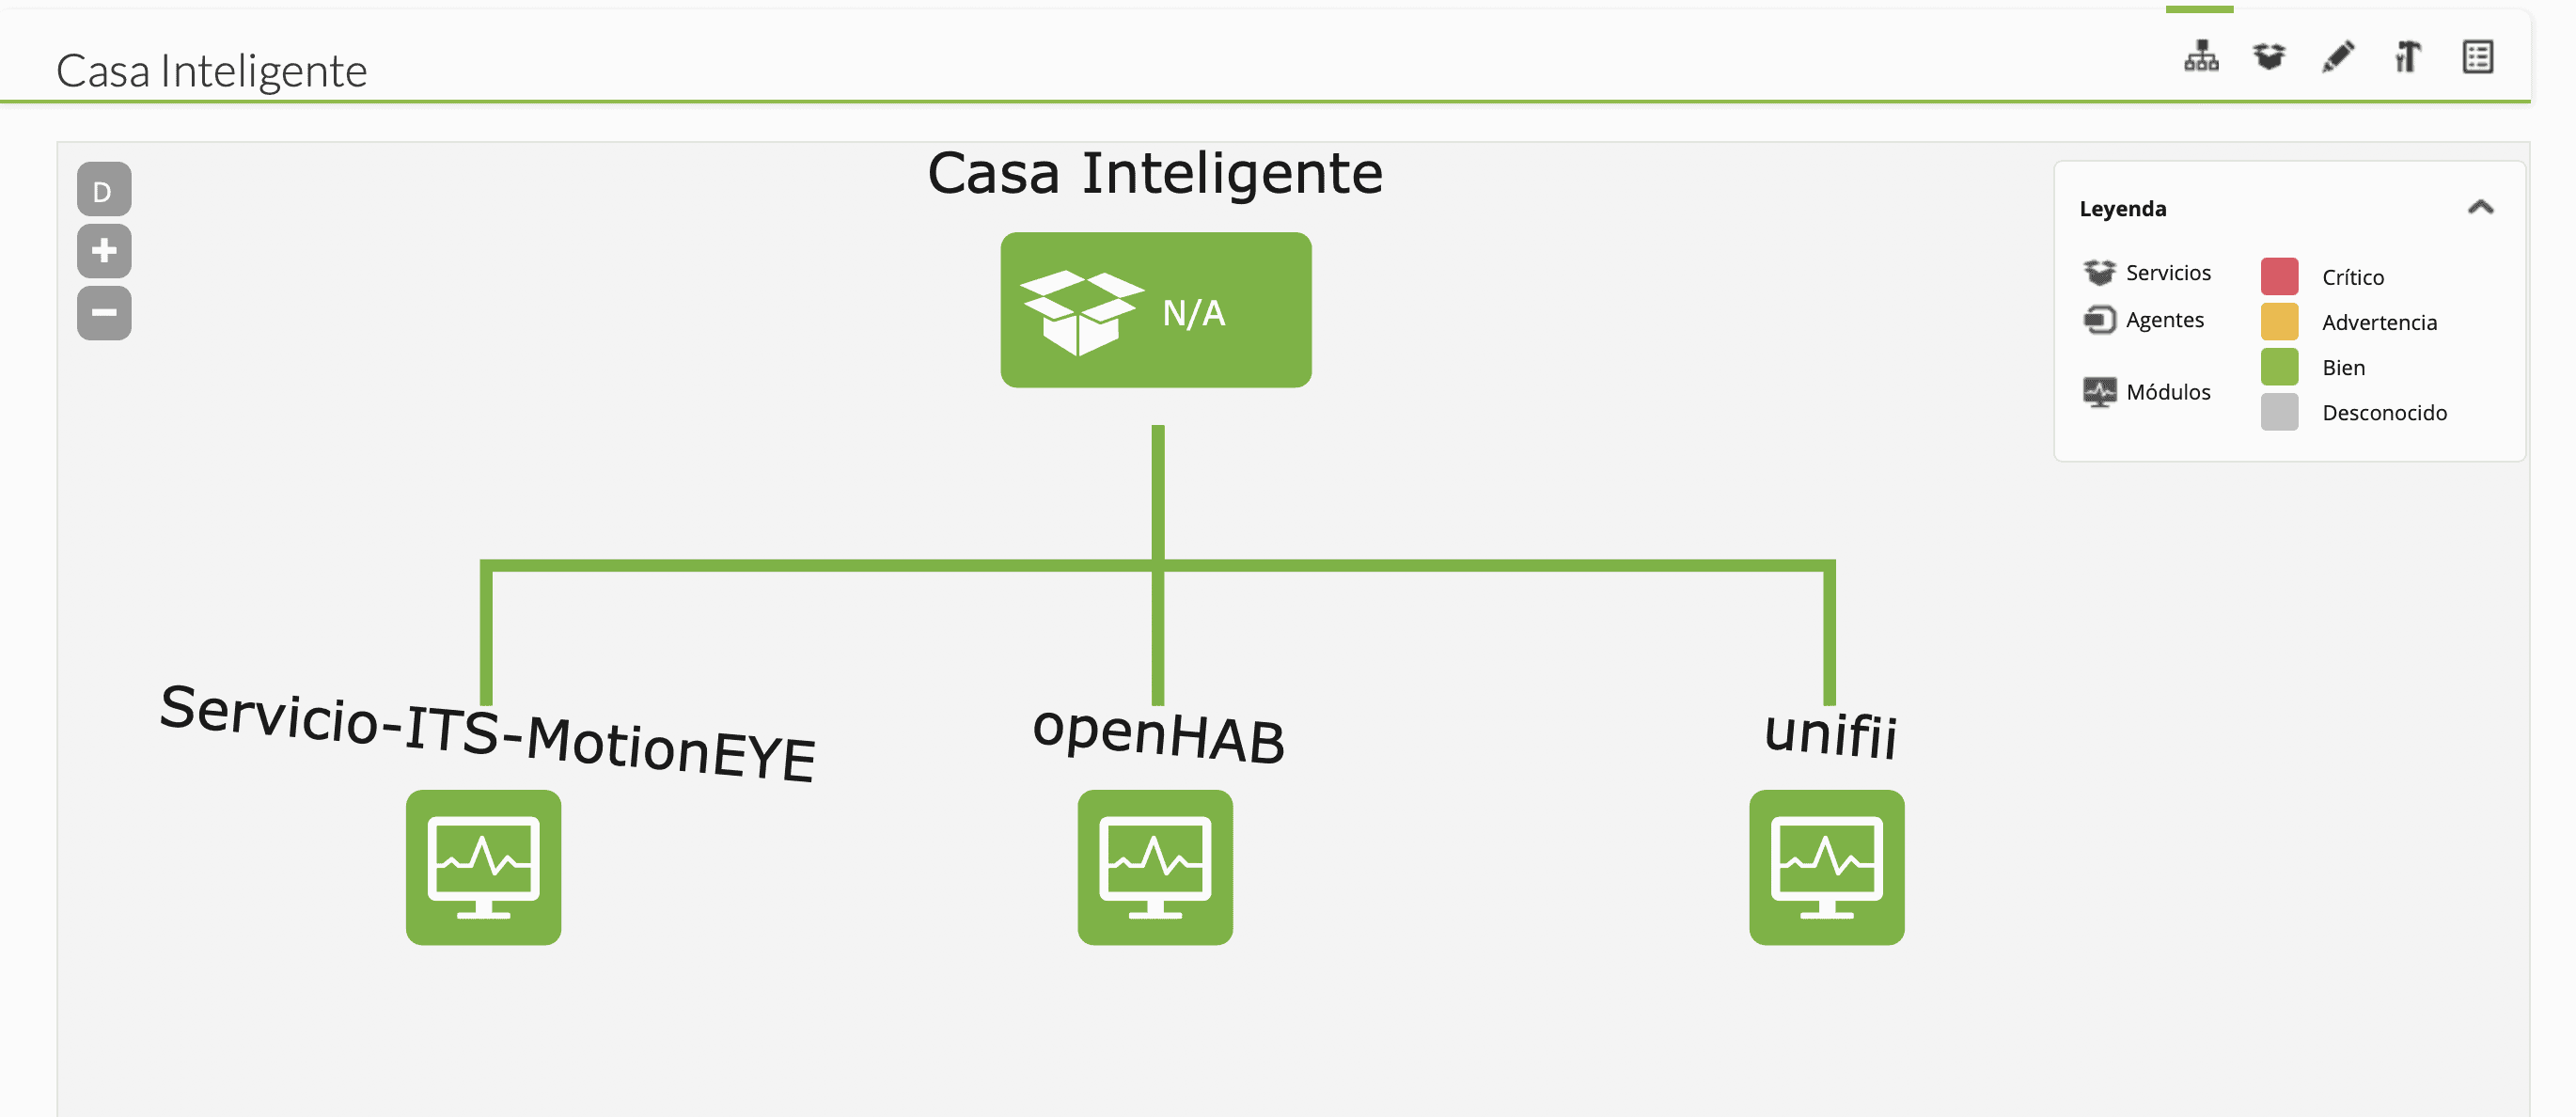
In addition to the metrics described, you will also have a specific view for monitoring vSphere environments that has compilation information on the general state of the environment and each monitored ESX and even a map of the monitored infrastructure.
As you can see, it is very easy to start monitoring a vSphere environment with Pandora FMS, just follow a few steps and you will have your VMWare monitoring integrated quickly and easily.
If you are interested in knowing in more detail how synthetic transactions are configured and executed with Pandora FMS, do not hesitate to visit our YouTube channel, where you may find different contents such as tutorials, workshops and a lot of other resources devoted to this and many other topics related to monitoring.

by Pandora FMS team | Last updated Aug 11, 2023 | Features
The battle begins again: Pandora FMS Vs Nagios. ¡FIGHT!
NagiosXI is the proprietary heir of one of the best-known tools in IT to monitor systems without a license, that is, as a free product. As a free product, Nagios (without XI) is a product that is almost 20 years old and suffers from many shortcomings, but for many years it has been the standard among “free” products and it fulfilled its role in those cases where the budget was quite short or the features needed were just a few. In recent years, its role as a free tool has been replaced by the more modern Zabbix.
Product features
Nagios XI is not a product as such, but rather it combines several pre-existing independent components. The best example is, for example, Nagios XI WEB management interface, with several elements, each one with its own credential system. Other system components installed on the Nagios XI appliance include:
- Nagios XI UI: “Overlying” interface on the “basic” Nagios interface.
- Nagios Core: Traditional interface.
- NSCA: Agent for passive and plugin tests (not maintained since 2011).
- NSPA: Agent for passive and plugin tests, with remote management.
- NRPE: Agent for running Nagios plugins.
- NRDP: Agent, theoretically a replacement for NSCA, whose development has not been updated since 2012.
- Nagios Plugins: Monitoring scripts. There have been several community “forks”.
- NagiosFusion: System similar to Pandora FMS Metaconsole.
- Netflow Analyzer: Specific component to work with Netflow/SFlow flows.
- Nagios Log Server: Log storage and monitoring system.
Each component with WEB interface has its own “look & feel”, its own user management system and, of course, its own configuration and integration with other elements. And these are elements designed by the company itself, Nagios Enterprise.
Third-party “OpenSource” components
- PNP: Plugin to monitor performance using RRD binary databases.
- Nagvis (maps): User-defined maps.
- NDOUtils: Information export from nagios to SQL.
- NSClient ++: Alternative agent that supports Nagios/Icinga.
- NagiosQL (modified): Administration interface with data storage in MySQL.
None of these elements, which make up the “Nagios XI” solution, are even by Nagios itself, so the compatibility and coherence between them is relative. In many cases, no one can guarantee the quality or maintainability of those pieces of software.
Feature table comparison between Pandora FMS and Nagios
| General features |
Nagios |
Pandora |
| User Experience monitoring |
NO |
YES |
| Availability monitoring |
YES |
YES |
| Performance monitoring |
Partial |
YES |
| Event management |
NO |
YES |
| Event correlation system |
NO |
YES |
| Multitenant |
NO |
YES |
| Log collection |
YES |
YES |
| Centralized management using monitoring policies |
YES |
YES |
| Certified Security Updates |
YES |
YES |
| Geolocation |
NO |
YES |
| Command line management |
NO |
YES |
| LDAP/AD authentication |
YES |
YES |
| Virtualization and cloud computing |
YES |
YES |
| High availability |
YES |
YES |
| Horizontal scalability (Metaconsole) |
YES |
YES |
| Service monitoring (BAM) |
NO |
YES |
| Customizable visual console |
YES |
YES |
| Synthetic modules (dynamic creation of data on existing data) |
NO |
YES |
| Historical database for long-term data storage |
NO |
YES |
| Centralized plugin distribution |
YES |
YES |
| z/OS monitoring |
NO |
YES |
| SAP R3 & S4 monitoring |
NO |
YES |
| Remote control (eHorus) |
NO |
YES |
| Agent technology |
Nagios |
Pandora |
| Multiplatform agents for Windows, HP-UX, Solaris, BSD, AIX and Linux |
YES |
YES |
| Remote management of software agent configuration (with policies and manually) |
YES |
YES |
| Agents for Android, IOS and embedded systems |
NO |
YES |
| Remote inventory or with agents |
NO |
YES |
| Centralized virtualization monitoring: Vmware, RHEV, XenServer, HyperV |
YES |
YES |
| Oracle, Informix, SyBase, DB2, Weblogic, Jboss, Exchange, Citrix, WebSphere monitoring (among others) |
Partial |
YES |
| Reports and graphs |
Nagios |
Pandora |
| Customization of reports (first page, header, images, dynamic content, static content) |
NO |
YES |
| Up to 6 decimals of precision in SLA reports |
NO |
YES |
| Fine-grain ACL system. 100% multitenant ready for SaaS |
NO |
YES |
| SLA advanced reports (daily, weekly, monthly) |
NO |
YES |
| Dashboard |
YES |
YES |
| Planned stops and exclusion |
NO |
YES |
| Report templates |
NO |
YES |
| Network features |
Nagios |
Pandora |
| Network L2 topology detection and self-discovery |
NO |
YES |
| IPAM (IP Address Management) |
NO |
YES |
| Decentralized SNMP and WMI monitoring (proxy servers, satellite servers) |
NO |
YES |
| SNMP trap monitoring |
YES |
YES |
| Dynamic network navigable maps, modifiable by the user in a graphical environment (Network console) |
NO |
YES |
| High-speed ICMP and SNMP scanning |
NO |
YES |
| Netflow |
YES |
YES |
| SSH/Telnet Console |
YES |
YES |
Points against Nagios
Monitoring current technologies
New check creation is based on wizards or plugins. In both cases, you have to be an expert to modify any of them (you have to program at command level, know the specific template definition language and manually debug), which makes it difficult to broaden the variety of checkups or customize one of them easily from the interface itself. In Pandora FMS, any extension can be carried out using the WEB interface, without getting down to the console level, in addition to offering a bigger plugin collection for business software that does not require any kind of coding.
When applying settings, you need to “compile” them so that if something goes wrong, changes cannot be applied until they are corrected. This would be insane in an environment with many hosts. Deleting an agent without first deleting the service it contains prevents you from making the change, but it does not solve it, for example. In Pandora FMS, the entire operation is in real time, or in the case of applying major changes, managed in the background by the system, without interruptions or the need to interact at a low level with the system.
Management automation
In general, monitoring is so manual that it would take a long time to monitor 100 agents, unless low-level scripts are created to automate the whole process, so there is no standard nor tools that allow automation, or good practices, it depends exclusively on the ability of the “nagios expert” to automate these tasks efficiently, which is a completely manual process.
Reports
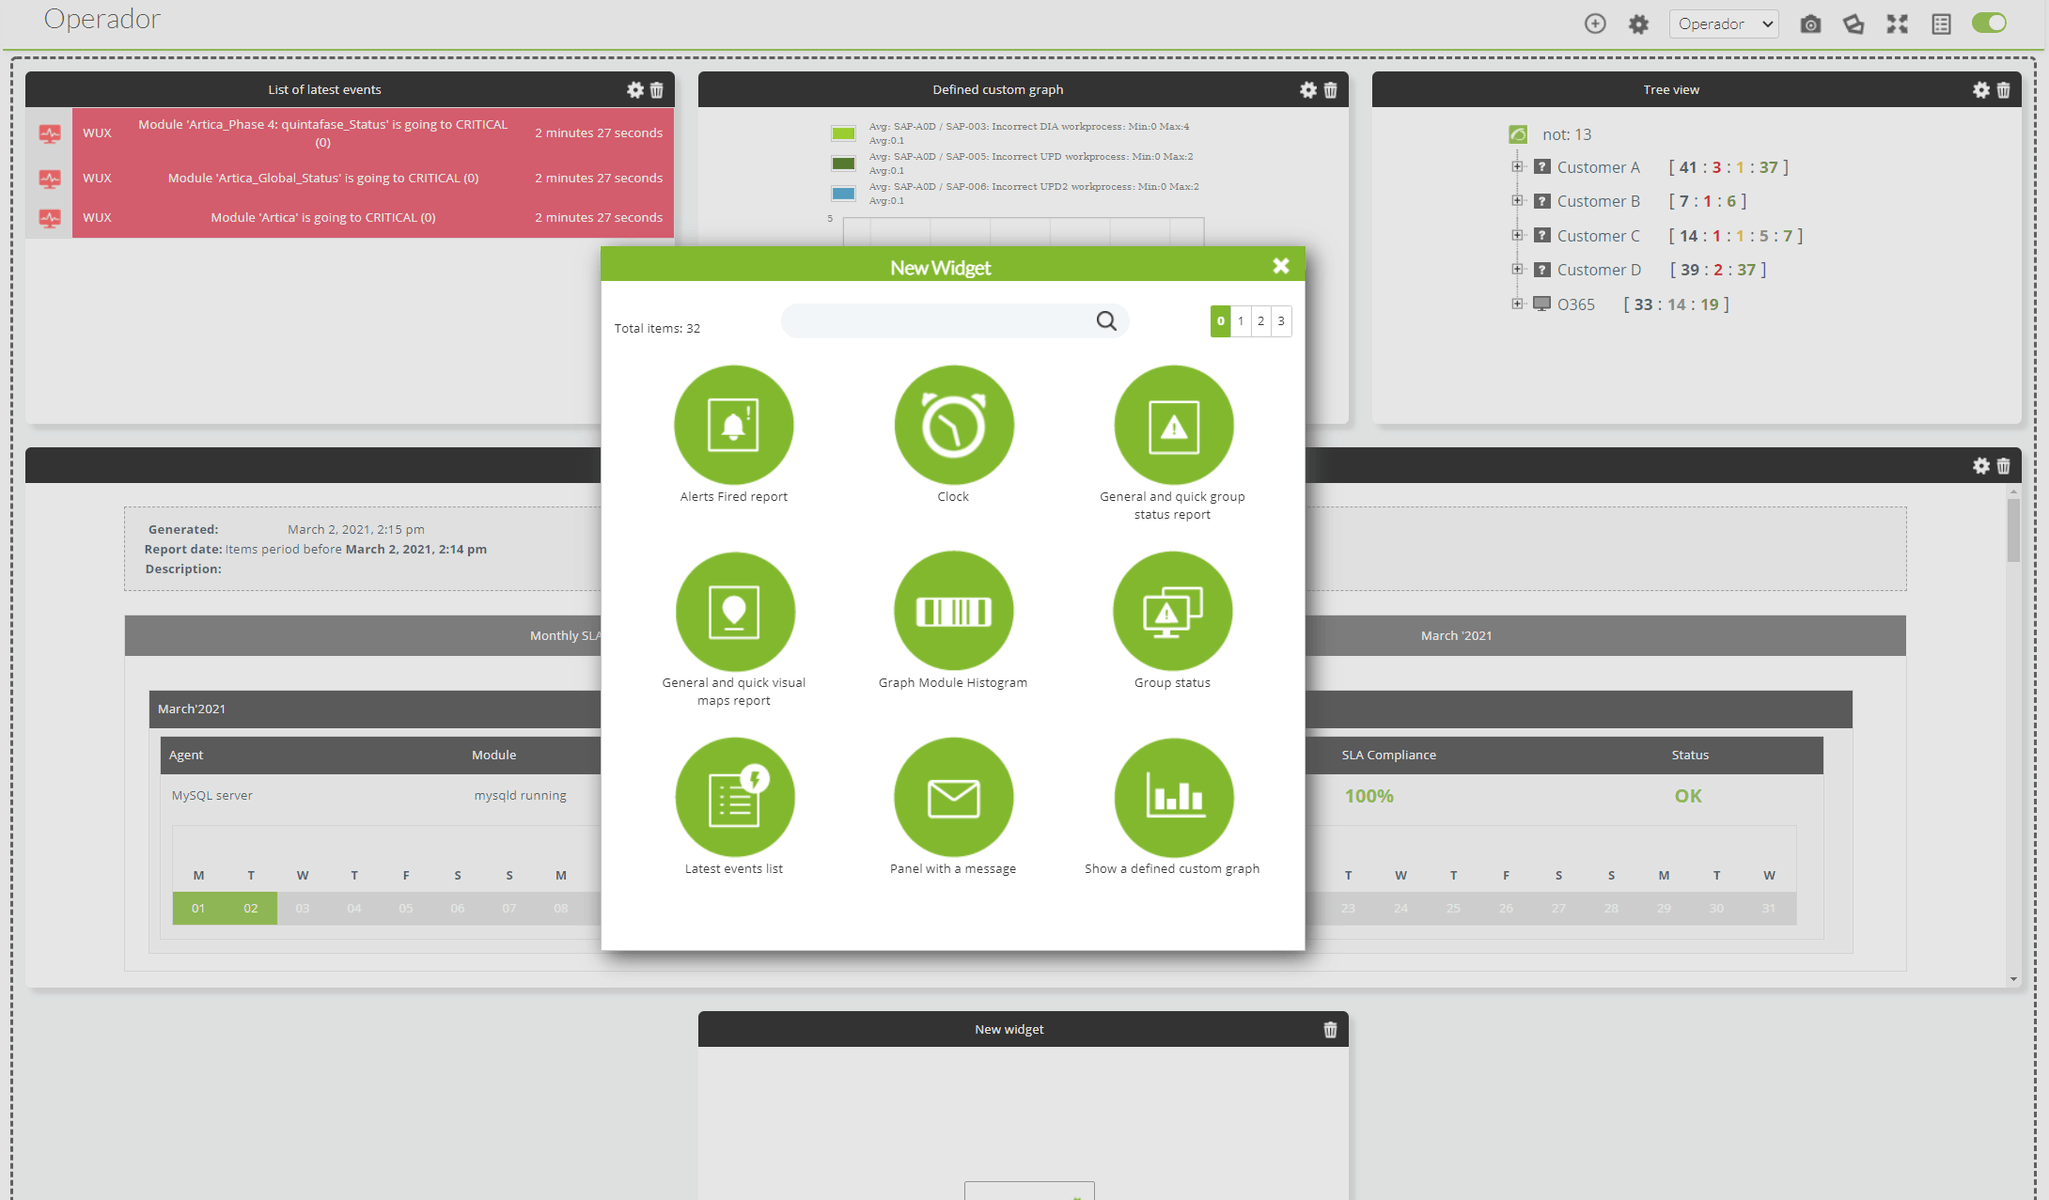
Although Nagios has “custom” reports, this customization is limited to parameterizing the already available reports, which are only of 20 types. Each report shows a type of information available with a pre-set presentation, for example the SLA:
Filters can be added and saved as favorites, but it is not a report that can be much more customized. To sum up, reports are intended for the technician’s use, never to be used for an internal or external client. Reports do not allow to combine different types of elements or to show generic graphs of specific metrics.
Usability in large environments
Console load for very few agents is extremely high. The usability with a high number of systems is very poor. Although it can be made to monitor many systems, it clearly has not been designed for it. Pandora FMS is currently being used to operate and manage systems with more than 100,000 nodes.
Windows Agents
Nagios “Advanced” Agents for Windows (NSCA) are from 2011 and there have been no updates since then. There are several “Forks” (iCinga, ISCA-NG), but not for Windows. Despite the fact that Nagios has up to four types of agents (NRPE, NSCA), their performance and power is far from being comparable to that of Pandora FMS, especially in Windows environments.
Performance monitoring
Until very recently, Nagios used third-party software to manage performance data and graphics. It has now been integrated, but it remains a tailored third-party component, and not part of its initial architecture. Pandora FMS is a native capacity tool, it can be used to elaborate dashboards, since it works with data and an SQL engine from its first version.
Lack of event management
Nagios does not perform event-based management, it cannot automatically validate events from monitors that have been retrieved, it cannot group them, and it cannot specify event-based alerts. To tell you the truth, there is no “event” concept in Nagios as in other tools (OpenView, Tivoli, Patrol, SCOM, Spectrum, etc). Pandora FMS has evolved based on requirements of former users of these tools, so the level of compliance with industry standards is very high.
For Nagios, the events consist of a text log for a simple visual review, as seen in the following screenshot:
Nagios cannot do a root cause analysis,
Since there is no event correlation. PandoraFMS does have it, and it also has multiple tools (L2 Maps, Services, Alert Escalation, Cascade Protection) that help the user in this regard.
Nagios cannot do BPM (service monitoring)
With Nagios you cannot set a hierarchy based on weights of different elements from different systems. Pandora FMS has a specific component (Service Maps) for this specific point.
Network level deficiencies.
Nagios cannot display a physical network, since it is not capable of detecting or displaying link-level topologies. This limits switch and router monitoring. Furthermore, its network maps are not interactive nor can they be edited or customized unlike Pandora FMS Enterprise.
Its SNMP trap monitoring is not integrated with monitoring and therefore no added graphs, reports or alerts can be displayed. The same applies for its Netflow monitoring interface, which is conceived as an auxiliary tool.
Dashboard and custom visual displays
The closest thing to Pandora FMS visual consoles on Nagios are the third-party NAGVIS plugin that has barely evolved in the last 15 years. Nagvis is an external plugin, which is not even fully integrated with Nagios XI. Even going so far as to have a different look & feel:
Although Nagios also has a Dashboard with a concept similar to that of Pandora FMS, it does not have basic elements, such as showing graphs of each monitored element, or numerical data of the collected values. It happens in a similar way with reports, which have “predefined” elements that provide little or no flexibility when it comes to building your own dashboards.
Permission management and Multi-tenancy
NagiosXI is not intended to work in a complex organization, where different administrators and users with access to different groups of machines can coexist. Its access segregation is very basic:
The scenario where you may have several dozen, with different ACL permissions by user groups is not even contemplated. Although it has an audit log, it is not useful to know what the administrator or users do with the tool, it is more like a server diagnostic tool.
Conclusions
Nagios is a software tool that can be useful in environments where there is already a person with advanced knowledge of Nagios who takes care of everything and adapts it manually according to the needs of the environment. The company does not have a “Nagios”, it has a “person who knows about Nagios”, so the cost of the total solution is really the cost of that person, including a possible replacement. In this case you don’t pay for license nor maintenance, but the hidden costs are of other nature. Tool customization and evolution depends entirely on that person. It is not a standard solution, it is a completely “ad-hoc” solution.
100% of our clients, prospects or consulted companies that use Nagios, actually use the “free” version of Nagios, which has less features than those included in this comparison. There are many Nagios forks, the most popular are Icinga or Centreon. There are commercial alternatives with a higher quality than that of Nagios XI, the best representative would be OP5.
Nagios XI is a tool whose main strength is its license price, which in most cases is free, and which even in the case of paying for the “Enterprise” version is more competitive than Solarwinds or Whatsup Gold just to name a few.
Pandora FMS is a tool that competes – and has already replaced in several cases – tools from IBM, HP, CA and BMC such as Tivoli, OpenView, Spectrum and Patrol. The scope, resources and scope of the projects are clearly different.

by Quique Condes | Last updated Sep 1, 2021 | Enterprises
Ártica Pandora PFMS launches a new channel program for partners as a key element in its business development strategy.
Ártica Pandora PFMS, within the framework of its global growth strategy, is evolving its channel program with the firm intention of expanding its worldwide network of partners. We will do so together with companies that complement, with their knowledge of the clients’ business, the wide range of monitoring, incident management and remote management services provided byPandora FMS, Pandora FMS Remote Control and Pandora FMS ITSM products.
At Pandora FMS we understand the importance of the benefits provided by a quality service, and, therefore, we want to develop the potential of professional IT companies whose purpose is to improve their clients’ business through knowledge and proper IT infrastructure use.
Since our main objective is the service quality for the users of our solutions, we especially focus on the qualification of our partners. We know for a fact that deep knowledge of our tools increases their productivity, while reducing the time spent by technicians. Effectiveness and efficiency that are achieved through custom training, and that can reproduce the customer environment so that partner-customer integration is fast and efficient.
The new Pandora FMS channel program embraces any size of company, from service providers to MSPs, consultancies, system integrators, distributors, etc. Of course, as long as they understand the value that monitoring and knowledge of the status of the IT infrastructure provides in the positive evolution of their business.
It is a simple program, easy to understand and comply with, without any tricks or hidden conditions. Flexible, with the ability to adapt to the needs of partners and their customers. Consistent, based on many years of experience attending and understanding the particularities of the channel and always aimed at providing the maximum benefit, direct and indirect, to companies that place their trust in us.
Now Pandora FMS partners self-qualify based on their commitment on three levels: Silver, Gold and Platinum. We certify that any of the levels is perfectly qualified to represent, with guarantees, Ártica PFMS products before clients. Our channel program also contemplates complementing the small deficiencies that may arise with our own manufacturer services, of the highest level.
All of our partners will have commercial interlocutors who, listening to customer requirements, understand their needs and are able to propose the appropriate solution. Gold partners will also have a qualified and certified technical team to install and adapt our solution to the client. And, of course, Platinum partners will enjoy higher independence and a higher volume of commercial and technical resources, which will allow them much more agile response times.
For Pandora FMS, the word “partner” means commitment, so the entire company has acquired the responsibility of helping to develop the channel’s business. From our first resource to the last (technical, presale, commercial, marketing, administration…) we are all available to our partners to minimize their own needs and maximize their business generation.
Each of our collaborating partners has their idiosyncrasies and their catalog of solutions, and the success of our channel program lies in the way we adapt Pandora FMS products to said portfolio, seamlessly, so that the organization of our partners, as a whole perceives that your solutions are scaled up without the need for patches or technical or commercial efforts.
We share the path, we work on demand generation, either directly through events and campaigns for predefined clients, or indirectly through social networks, generalist and economic press, press specialized in information technology or presence in sector fairs. We actively collaborate also providing all kinds of commercial information on the product portal.
Once the need is created, we reinforce, with our presence, the work of the salespeople, both in the initial stages of validation of the opportunity, and in the realization of presentations and custom demonstrations to clients, including, depending on the demand, tests of concept or even pilots with real data. We always leave the relational initiative to our partners, to whom in no case do we discuss the ownership of the opportunity, we only stay by their side in the sales cycle, thus guaranteeing avoiding conflicts between partners that may cause image and productivity loss in end customers.
Once the agreement with the clients has been reached, we continue to be by the side of our collaborators, providing them with all those services they need to complement their training and guaranteeing the success in the project’s execution.
And we don’t stop there, because we know that the relationship with a client does not end with an installation, but that it is something alive, constantly evolving, like our products, which include improvements (releases) from three to five weeks. Our direct support, or through the partner, is able to cover, with continuous coverage, the demand of the end companies that trust us.
In short, at Pandora FMS, we take our business very seriously, as much as any company with which we have the pleasure of collaborating, and, therefore, we have chosen a simple, flexible and seasoned channel model, which allows for the money generated by the ecosystem of partners that we are creating to affect and feed it. So the services we offer, together, obtain a productive knowledge of everyone’s information technology infrastructure, and this helps businesses grow in a sustainable way with the minimum operating cost.
If you are already a Pandora FMS partner, ask us more about how to grow together and, if you are not yet, find out all the details of the new partner program and contact us. We are sure to find quick business synergies.

by Jimmy Olano | Last updated Aug 11, 2023 | Tech
Every change is for the better and we give you ten reasons to change your monitoring software.
Cuando se habla de cambiar de software, no sé por qué, me viene a la mente la compra de música. Bueno, yo soy de los de antes: vinilos, cassettes, a principios de siglo los CD y DVD… Claro, ahora es diferente, actualmente existe el pago por suscripción, que reproduce en línea, y donde generalmente se ofrece el álbum de turno o paquetes completos con muchas estrellas musicales…
We could start right there, highlighting the difference between “the cloud and the earth”, running software on the Internet versus having one on your own physical servers. Both have their costs, we know. In fact, we already gave detailed information in another article on the subject. Because before talking about changing your monitoring software we must start there, the money. That’s the reason why you will have to take into account several factors, so let’s go for pencil and paper (virtual) and let’s start numbering!
1) Pandora FMS offers several forms of installation and download, as well as modes of operation. That is one reason to consider switching monitoring software. This mechanism allows you to grow, and, if necessary, reinstall at any time. You don’t have to buy a whole package either: in Pandora FMS you start by installing the Community version and as you see the benefits for yourself, you can move on to installing and testing the Enterprise version, without obligations or hassle. There you will always have the installers, both online and offline, as many times as you need them.
2) Do you have a feature in mind that cannot be found in any monitoring software? Don’t be embarrassed, it happens. I, at the very least, am very picky about how to insert text and data into text or number boxes. When you focus on them, I like for the text to be selected in a specific color, for example. And don’t even let me begin on entering numerical amounts or phone numbers.
And Pandora FMS does not have exactly that requirement either… However, you just have to go through the Community version that is open source and through its forum to get the help you need to develop the idea.
Better yet, you may have already been successful but now you want a more ambitious and highly customized improvement for your company: try the Enterprise version, where they will give you professional advice and offer you extraordinary improvement plans tailored to your needs. After all, only you know what is best for your company and what it needs. An exactly tailored suit or smehting ready-to-wear ? You choose!
3) With Pandora FMS you will be able to monitor at first remotely, without interfering much in your work processes, continue with an advanced remote configuration and, if everything goes smoothly, advance to monitoring with Software Agents, which are installed on each device. While you change -and advance- Pandora FMS has already outlined the path until (for now) June 2023. Exploring and changing monitoring software can be done before it’s necessary, even if it’s late.
4) Using great monitoring software, widely used worldwide and also used by large corporations, is not a guarantee of good security. I invite you to read about the case that took many headlines in the press, social networks, radio and television. Take this chance to have a coffee and take a deep breath to come back, there are still six reasons to change your monitoring software.
5) Because you don’t believe in magic wands. Neither do I, and in Pandora FMS that is very clear for them. Each client has a different problem and it is necessary to adapt to each particular case. But it will not be by magic, you have to invest time and effort, and in that domain Pandora FMS offers decades of proven experience.
6) Because “we just know that we do not know anything”. Without the aim to go in depth into the philosophical field, we must always pay attention to constant learning. Perhaps the documentation of your software is quite poor and it would be a good time to change it. Pandora FMS has forums of users of the Community version, documentation, tutorials and this blog that you are reading today. With all of them you can learn at your own pace, but if you want or rather need a push – certification included – check out our training in monitoring. Psst, with the Enterprise license this last one is included, don’t miss the chance!
7) Another reason to change your monitoring software is indeed not to change anything! Perhaps you simply need a monitoring contingency plan or an alternative of audit or measurement of result comparison. For example, I am a client of DigitalOcean, a company that provides virtual computers and that has both monitoring processes (Software Agent type) in each droplet (virtual machine), as well as at large-scale with Prometheus in its hypervisors. However, remote checks and Pandora FMS Software Agents are more useful for me, which also helps me verify information. It is not that I don’t trust the monitoring software implemented by my own provider, but rather you must always have different options, see the full horizon to be able to choose the way forward.
8) Because two are better than one: eHorus is a remote access program that can later be integrated with Pandora FMS. EHorus remote access software can be integrated into Pandora FMS, so you may combine computer – or client – monitoring, find out the bandwidth consumption of your network, the software installed on your PC, see logs and events and connect to the computers you need from the monitoring console itself. Test without commitment nor cost for up to 10 devices.
9) Because three is better than one. We add another reason to change your monitoring software, Pandora ITSM Fully compatible and integrated with Pandora FMS. Pandora ITSM incorporates your forms for clients in your own Web, feeding Pandora ITSM directly through API. In addition you will have access to lots of articles, downloadable files, multi language, categorized and with access control to manage incidences. Monitor changes and performances on your machines with Pandora FMS agents!
10) Is the “billiard ball” with the number ten missing? You yourself can add the tenth reason to change your monitoring software. Tell us about your experience with other software, you can leave your comments below, visit our channel at YouTube, Linkedin or Twitter.
Would you like to find out more about what Pandora FMS can offer you? Learn more here.
You can also enjoy a FREE Pandora FMS Enterprise 30-day TRIAL. Installation in Cloud or On-Premise, the choice is yours !! Get it here!
Last but not least, remember that if you have a reduced number of devices to monitor, you can use Pandora FMS OpenSource version. Find more information here!
Do not hesitate to send us your questions.
The team behind Pandora FMS will be happy to assist you!

by Dimas Pardo | Last updated Jul 24, 2023 | Community
Do you know what good teleworking practices? We tell you everything!
Hey dear readers! This time our article may be particularly useful for you, are you teleworking while reading this? Yes? Well be honest, are you wearing your pants? You can shake your head with a smile on your mouth, or simply say to the monitor in front of you: “No, I NEVER wear my pants during work hours, THANK YOU TELEWORK!”. Yes, teleworking has brought very good things, such as less stress, reduction of expenses for the company, and decrease in absenteeism. For this reason and to emphasize that even if we do not wear pants we are responsible and mature, today, in Pandora FMS blog we want to discuss good teleworking practices.
As you know, in this blog we are more empirical than Aristotle and David Hume together, so we will address the question of good telework practices by asking our heads of department. They, more than anyone else, take charge of the situation and manage it among their workers, with enviable leadership and musky affection.
What are the good teleworking practices you promote in your department?
Sara Martín, head of Human Resources, Training and Community of Pandora FMS.
Between HR and management, we had to start by creating a manual of operating procedures for teleworking, or good teleworking practices. Creating basic rules so that people would be as comfortable as possible reconciling their family and work lives. Among the good teleworking practices that we try to carry out, are the following: a flexible schedule, breaks during the day, give importance to security with access through a VPN, a safe antivirus, use internal tools such as the company’s chat or videoconferencing, and then each department chooses how to organize themselves, there are some who prefer a daily meeting, another twice a week, etc.
Then there are several recommendations we make for anyone who is telecommuting:
- Have your own fixed schedule routine. (Breakfast, break, lunch.)
- Have your computer protected by password. So your child and cat don’t write messages when you’re in the toilet or eating.
- Your computer must have up-to-date security updates.
- Socialize through collaborative tools, don’t let telecommuting make you forget that you’re still working with people.
- Take special care of communicating with the rest of the team. Use the webcam and video conferencing whenever possible.
- Separate your personal life from your work life. When your workday is over, you should be able to disconnect.
- Ask your colleagues for help as if we were all in the office.
- Go to HR whenever you need it, their job is to help you.
- Take into account digital disconnection: workers have the right to forget about emails or work calls outside of their working hours.
- Respect the right to privacy.
Kornelia Konstantinova, Head of the Marketing and Communication Department.
In Communication, we are proud of our “Decalogue, formal but incredible, for good teleworking”. A series of flexible guidelines like the junco and robust like the quebracho. Someday we will sculpt them in stone or make T-shirts. Here I list them:
- Flexible working hours.
- Camaraderie.
- Team trust.
- People come first.
- Take care of mental health.
- More efficient and less time-consuming meetings.
- Information security and data protection.
- Physical activity and exercises.
- Healthy eating.
- Rest.
They are so practical and versatile that they can be both good teleworking practices and a self-help manual for dealing with the fact that you have reached thirty.
Daniel Rodríguez, Head of the department of QA
The fundamental rule for us QA is basic, but of course important and conciliatory with the work: Keep a schedule as regular as possible.
Keeping track of work time is the key, since being from home it is very easy to get distracted and keep on thinking “I finish this and I’m done” or some similar procrastination thought.
Regarding this, we could add an appendix to our motto:
Try to have a different work space than that for leisure. You know, if possible another room or table… Especially not to continue in the same place once the day is over. You have to discern.
Mario Pulido, head of the Department of Systems/Support
I no longer know if they are good practices or not, but the truth is that from minute one we started teleworking, the contact between the entire team has been constant. We have a meet constantly open where we are present when we are available, or need each other, and where we comment on whatever happens to us. Just like we would in the office.
The team also shares their screens when a test or intervention is complicated, and the rest of us are there, to support and indicate possible solutions. That way, despite not being together, we never feel alone.
Sancho Lerena, CEO of Pandora FMS
The key point here is to understand well what is expected from you and define objectives. Share those goals and how to measure them. The more mature a person is, the more freedom they can have. In the end, it all comes down to setting goals and being able to evaluate them. Having good communication so that when there are problems, those objectives can be redefined or corrections made to reach the established goals. Everything else is incidental, and what the global Covid pandemic has shown us is that a paradigm shift is possible. Have I already said that we are a 100% teleworking organization?
Ramón Novoa, leader of the Artificial Intelligence department of Ártica PFMS
First of all, it is very important to define what is understood by teleworking and adapt the procedures to each situation. An offshoring team is not managed the same way as one that occasionally allows teleworking.Communication in hybrid teams in which one part works remotely and the other actually present is particularly complicated.
Examples of good practices that have helped us so far are: maintaining good documentation, easily accessible and without duplication; establish procedures and expedited communication channels that avoid misunderstandings; define clear goals and measurable objectives; etc.
Having the right tools to carry out these tasks is no less important, but today it is easier thanks to the number of applications available in the cloud. In any case, they must be well documented to avoid compatibility problems. Open formats can be of great help.
Finally, I would like to highlight the importance of fostering informal communication to improve personal relationships. We have to be able to take advantage of the many advantages that teleworking offers, and minimize the inconveniences.
And that was it, I know that our program of testimonies of the departmental heads about good telework practices seemed short. Any day we will create something like the Opra’s…, “Pandora’s”, what do you think? Would you like it? We would make loads of money with that talking show.
Would you like to find out more about what Pandora FMS can offer you? Find out clicking here .
If you have to monitor more than 100 devices, you can also enjoy a FREE 30-day Pandora FMS Enterprise TRIAL. Installation in Cloud or On-Premise, you choose !! Get it here .
Last but not least, remember that if you have a reduced number of devices to monitor, you can use the Pandora FMS OpenSource version. Find more information here .
Do not hesitate to send us your questions. Pandora FMS team will be happy to help you!
And if you want to keep up with all our news and you like IT, releases and, of course, monitoring, we are waiting for you in our blog and in our different social networks, from Linkedin to Twitter through the unforgettable Facebook . We even have a YouTube channel , and with the best storytellers.

by Pandora FMS team | Last updated Sep 1, 2021 | Tech
Double authentication with Google Authenticator in Pandora FMS
Introduction – Internet and its issues
For a long time, the Internet has been an easily accessible place for most people around the world, full of information, fun, and in general, it is an almost indispensable tool for most companies, if not all, and very useful in many other areas, such as education, administration, etc. But, since evil is a latent quality in the human being, this useful tool has also become a double-edged sword.
We speak of “cyberattacks”, or computer attacks. These “cyberattacks” are a set of code in a programming language, usually C, prepared to exploit a vulnerability in a system, or to find them. Although the most effective ones are created by people with great computer knowledge, some use already created programs, although yes, less effective than the first. That is why we hear news about cyberattacks on a daily basis. With each year that goes by, these cyberattacks multiply exponentially, being one of the biggest concerns for companies around the world. Because of this, protecting your system must be your highest priority in fighting against this problem.
From firewalls to applications, you must add all the security measures at your reach to your computing devices, both in the work environment and in your personal space, to guarantee the highest security. Although cybercriminals are more focused on attacking companies, obviously because there are more benefits, it never hurts to protect your personal life.
Problem Description – Password Attacks
Among all possible computer attacks, one of the most frequent ones is the brute force attack or password attack. This attack consists of using a series of commands or programs, together with a combination of alphanumeric characters and sets of symbols, simulating a username and password. Later, these data are launched against the entity, application or web page, as can be the case of Pandora FMS. It has that name because it is a constant attack, it does not try to exploit any specific vulnerability, but simply seeks to crack the username and password by constantly launching that code, with all possible user and password combinations. Although there are thousands of other attacks, we will focus on this one in particular, since it is one of the easiest to perform.
Solution – Google Authenticator
One of the simplest and most useful solutions to try to minimize this problem is to use a two-step authentication program (2FA). The most recommended and used one is the Google version, called “Google Authenticator“. It is a mobile application, available for both Android and iOS. This application consists of linking our account with the application itself, by scanning a QR code. Once you scan it, it will show you a 6-digit number that you must enter to verify your identity and link your account with Google’s. After having linked it, the application will provide you with a 6-digit number, with an expiration of thirty seconds, which you must enter each time you log into your account, and thus verify that you are the owner of said account.
Pandora FMS offers the possibility of configuring this application integrating its use with the server. That way, when you want to log in to Pandora FMS console, it will be necessary to enter a “code”, and thus guarantee that only the user who can obtain that code through the application can log in.
Configuring that tool is as simple as going to the “Authentication” section within the “Setup” tab.
Here the task will be as simple as activating “Double authentication” and, if desired, forcing its use on all users. Once it is done, click on “Update”.
When updating, a window will appear asking you to download the Google authenticator application. Remember it is a mobile application, and, although the link redirects you to the website, you may download it from the Android Play Store or Apple App Store. If you already had it, you would only have to click continue.
Then, open the application and scan the QR code with it. This will add an account to your application’s registry where a 6-digit number will appear. In case this fails, click “Refresh code”. If everything goes well, continue.
The last window that will appear will be to ask you for the code that was generated in the application, to finish linking your Pandora FMS user with the device where the codes are generated. You will only have to enter this code and you will have finished the configuration of your double authenticator.
To do the test, log out of Pandora FMS and re-enter the credentials of your user, and this time instead of showing you the console it will ask you to enter the application code.
Farewell
Once you have correctly configured this tool, your system will be somewhat more secure, although of course, that does not mean that it is impenetrable, since every day, the so-called “hackers” create new codes to violate this type of security. That is why we always recommend changing passwords frequently and keeping all your devices updated to the latest version of their programs and software in general and continue adding new security measures throughout your network.

by Pandora FMS team | Last updated Aug 14, 2023 | Features
What is Active Directory and how to use it with Pandora FMS?
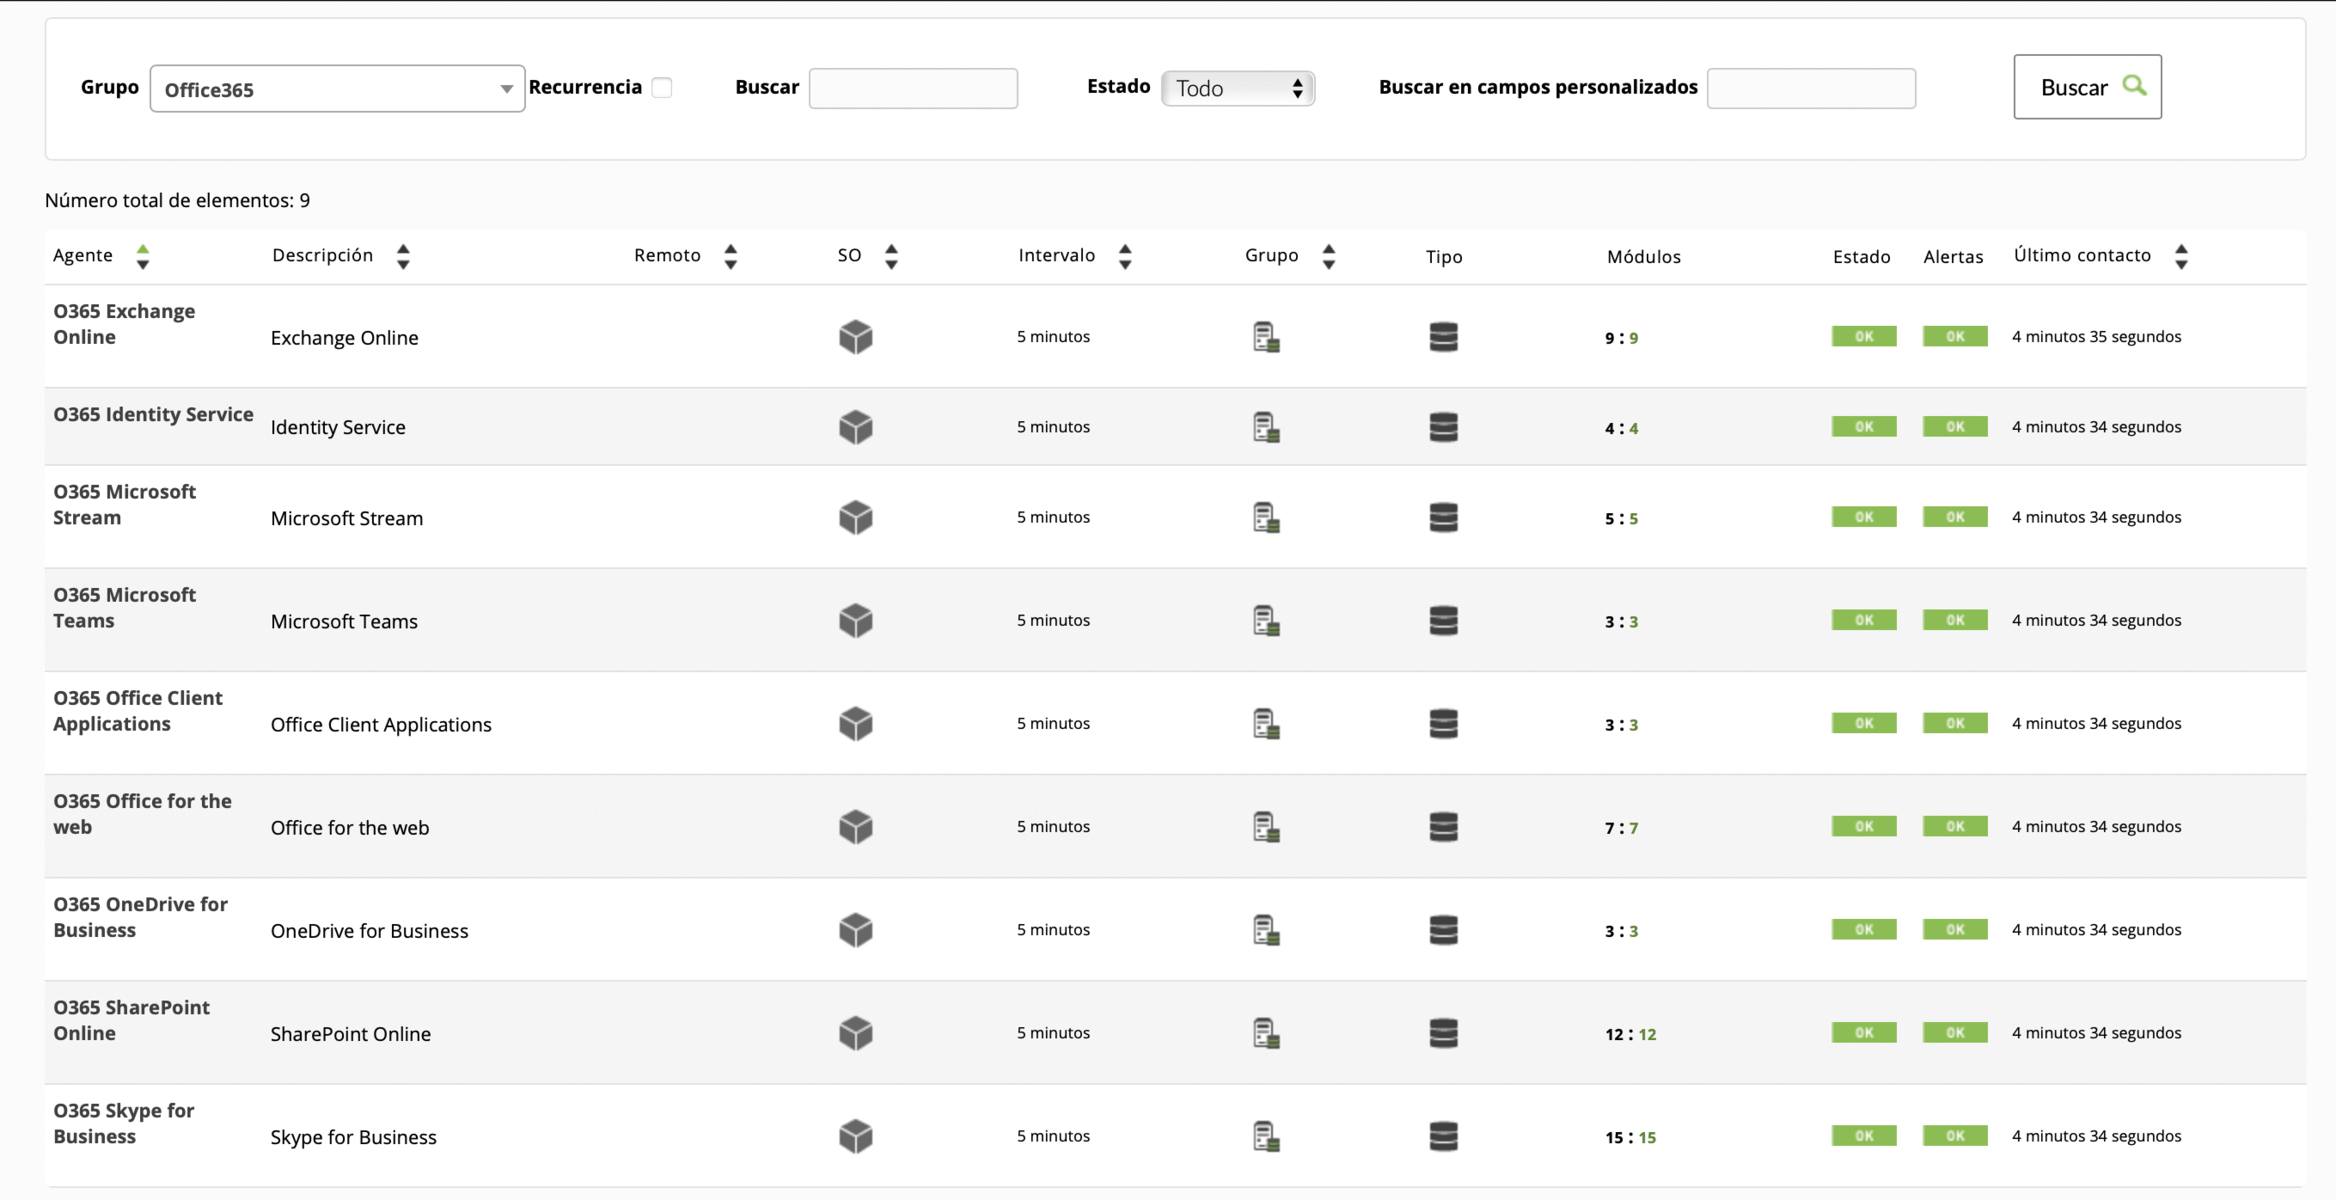
As you may already know, in this blog, we’re so into answering the big questions. After answering in previous episodes what the meaning of our existence is or explaining everything you need to know about Office 365 Monitoring, in today’s episode we are going to discuss what Active Directory is. I hope you are very comfortable sitting in your respective gamer chairs or in your two-seater sofas, because here we go!
What is Active Directory?
Active Directory is a tool that provides directory services, which entails many benefits in the business sector. Many companies have a large number of employees, they need a connected device to do their work, and there we have Active Directory, with it we can build a network of devices for users or employees.
How to collect information on user and service monitoring with Active Directory?
We already know that obtaining information is a very important section of monitoring. All these data can be very useful for us to see the status of something, find a possible problem or simply improve a certain system. Active Discovery is a process by which information can be collected while managing everything in a very simple way. We will be able to see what we need from a single computer, which will make the task much easier, since we will not have to act on each of the devices.
In this article, we are going to give you the guidelines to configure Active Discovery and be able to use it.
What are the benefits of using Active Directory?
- It is focused on professional and business use. It allows you to manage everything easily and without having to intervene in the computers of each user, which saves a lot of time.
- Store data in real time. With data related to users and their authentication.
- User authentication. If everything’s ok, the user’s information will reach the computer. This means that if one computer breaks down, you will be able to access it from another with authentication.
- Easily manage all servers and applications, ensuring that everything runs at peak performance.
- Prevention of replication errors. To verify that all replications are being performed optimally. Active Directory monitoring is essential, since you will obtain accurate information from them.
- Obtaining information from remote sites and much more…
And here Pandora FMS comes into play
It is our standard: One of the principles of Pandora FMS is its flexibility. It is highly configurable and by using plugins you will be able to do almost anything in terms of monitoring. Making use of Active Directory in Pandora FMS is quite simple. You can use a specific plugin with which to collect different types of data. Like, for example, the number of users connected or inactive to be able to see them from the console. The data you may obtain is easily configurable from a simple txt, which will be the configuration file. The plugin can be found at the following link: https://pandorafms.com/library/active-directory/
Once downloaded, install it on the console.
This short and simple process that will offer you great advantages will be explained below.
What is needed for the plugin to work?
- Powershell v3.0 or higher.
- Active Directory Powershell Module.
- Repadmin. The plugin needs a configuration file that will be divided into the following blocks and will be called “adparams.txt” :
- In user, you can choose whether to see the full list of all users or one in particular. In unused, a list of users that have not been used for at least two months. 1 to enable it and 0 to disable it.
- Spn allows you to see spn suffixes. 1 to enable and 0 to disable, as in the previous point.
- Upn allows you to see spn suffixes. 1 to enable and 0 to disable.
- You may also add the test block, which retrieves the information from the AD diagnostic tests that the dcdiag tool returns. 1 to enable and 0 to disable.
Example: #tests Tests = 0
- We can run the plugin manually, calling executable.exe, writing the following output through the powershell terminal:
[path_plugin]\active_directory.exe [path_conf]\adparams.txt
- It is recommended to save the file in pandora_agent/util.
- In the remote configuration of the agent that we have installed, add the following:
- When the interval goes by, modules collected by the users of Active Discovery, the connectivity, the status of the service or the suffixes spn and upn will be obtained.
Execution from the web console
To be able to run it from the console, the plugin will be distributed through collections. In configuration -> collections, create a collection, it will be named “Active Directory plugin” and short name “Ad_plugin”, in the following image you can see the process.
Go to files after creating the collection :
Click on “Upload Files”:
And upload the executable of the plugin and the configuration file that we created previously, then return to the previous menu and click “Create a file again” and later “Update”. In the agent where you want to use the plugin, go to the collections section and add it:
Next, go to “Agent plugins” and add the route with the plugin execution. In this case, as it is by means of collections, they will be created in the software agent installation path.
The path by default would be the view in the image (2).
Modules generated by the plugin
These will be the modules returned by a standard run.
Monitoring:
● AD Users
● Unused AD User
● AD Schema Master
● AD Root Domain
● AD Forest Domains
● AD Computer DNS Host Name
● AD Global Catalogs
● AD SPN suffixes
● AD UPN suffixes
● Connectivity
● Replication admin
● Service DNS status
● Service DFS Replication status
● Service Kerberos Key Distribution Center status
● Service Active Directory Domain Services status
● Test Advertising status
● Test FrsEvent status
● Test SysVolCheck status
● Test KccEvent status
● Test KnowsOfRoleHolders status
● Test MachineAccount status
● Test NCSecDesc status
● Test Netlogons status
● Test ObjectsReplicated status
● Test Replication status
● Test RidManager status
● Test Services status
● Test SystemLog status
● Test VerifyReferences status
Service NetLogon status
● Service Intersite Messaging status
And this is how they would look like in the created agent:
And, up to here that would be everything required to be able to make the plugin work. It was easy, huh? I hope many things in this life, but above all I hope this article was useful, especially to help you understand better Active Directory and how to use it in such a simple way in Pandora FMS. I will not take anymore of your time, indeed, I say goodbye, not before, of course, encouraging you to read other articles on the blog that may be to your liking and taste.
Would you like to find out more about what Pandora FMS can offer you? Find out clicking here .
If you have to monitor more than 100 devices, you can also enjoy a FREE 30-day Pandora FMS Enterprise TRIAL. Installation in Cloud or On-Premise, you choose !! Get it here .
Last but not least, remember that if you have a reduced number of devices to monitor, you can use Pandora FMS OpenSource version. Find more information here .
Do not hesitate to send us your questions. Pandora FMS team will be happy to help you!
And if you want to keep up with all our news and you like IT, releases and, of course, monitoring, we are waiting for you in our blog and in our different social networks, from Linkedin to Twitter not forgetting Facebook . We even have a YouTube channel , and with the best storytellers.
by Pandora FMS team | Last updated Sep 1, 2021 | Enterprises
Pandora FMS presents you our Roadmap 2021 – 2023
In this article, we will introduce you to the new Pandora FMS Roadmap for the next 24 months (June 2021 – June 2023). For its creation, we had the participation of our clients and partners, who, through a survey, helped us choose all kinds of features and their priority.
It’s been really satisfying for us to complete this challenge, as it was one of those enthusiastically proposed among our closest goals.
- Warp update (Q2).
- Command center (Q2).
- New agent inventory report (Q2).
- Graphic agent installer for Mac (Q2).
- Services report (Q3).
- Policy auto-implementation (Q3).
- New visual console elements (Odometer, Simple graph) (Q3).
- Netflow: Data monitoring of the flows defined in the filter (Q3).
- Trend modules (Q3).
- Capacity planning modules (AI) (Q3).
- Enhanced anomaly detection (AI) (Q3).
- Authentication with KERBEROS (Q3).
- New service view widget for Dashboard (Q3).
- Basic network computer configuration management (Q4).
- Centralized agent update (Q4).
- APM (code application monitoring) (Q4).
- Security Center (Q4).
- IPv6 monitoring in SNMP with Satellite server (Q4).
- ITSM integration: SysAid, Zendesk, OTRS, Redmine, Jira, Zammad, TopDesk (Q4).
- Impact simulation in service view (2022+).
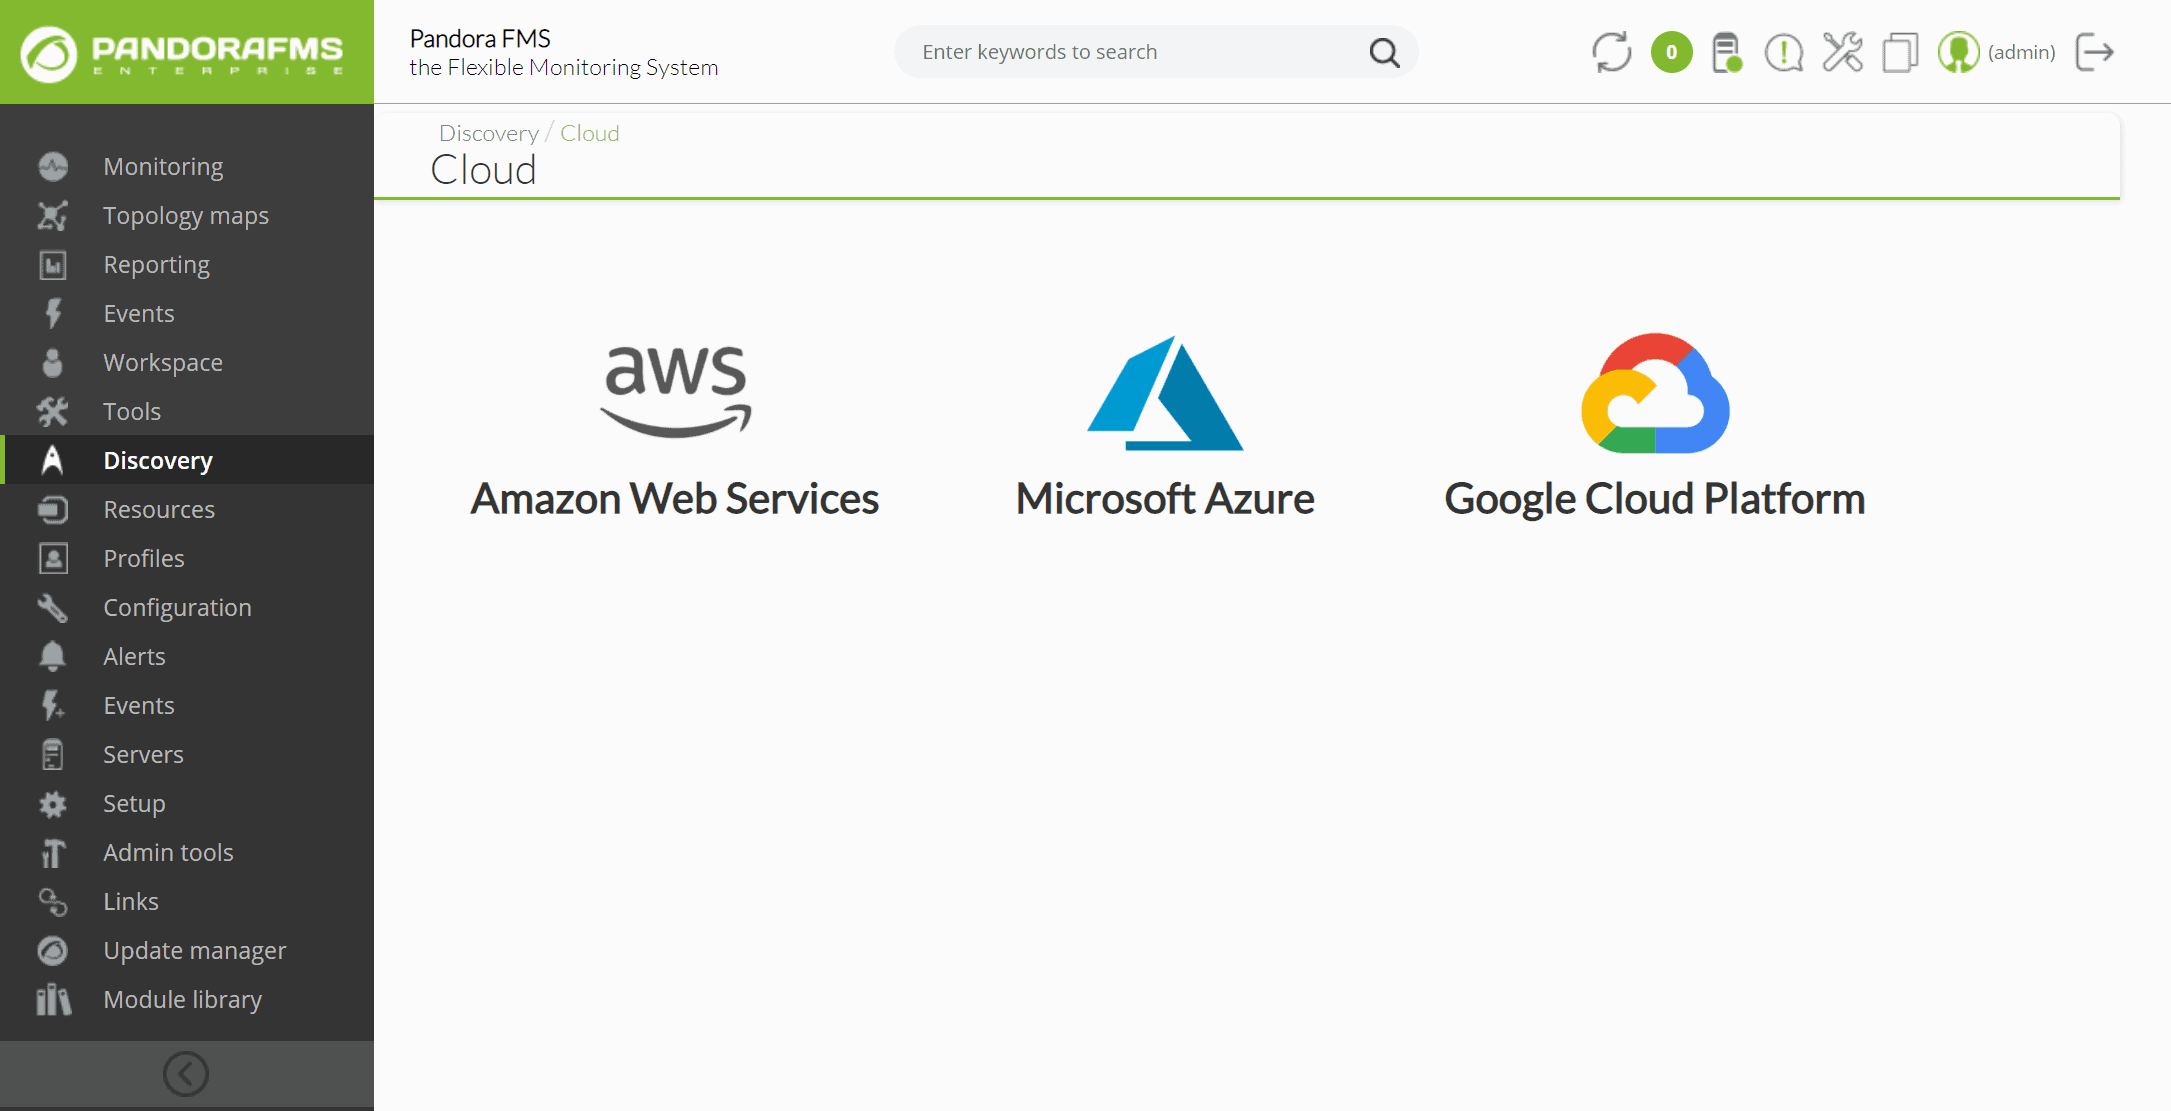
- Discovery: Google Cloud.
- AWS Monitoring improvements with Discovery: RDS for postgreSQL, Autoscaling groups, VPCS, Lampdas.
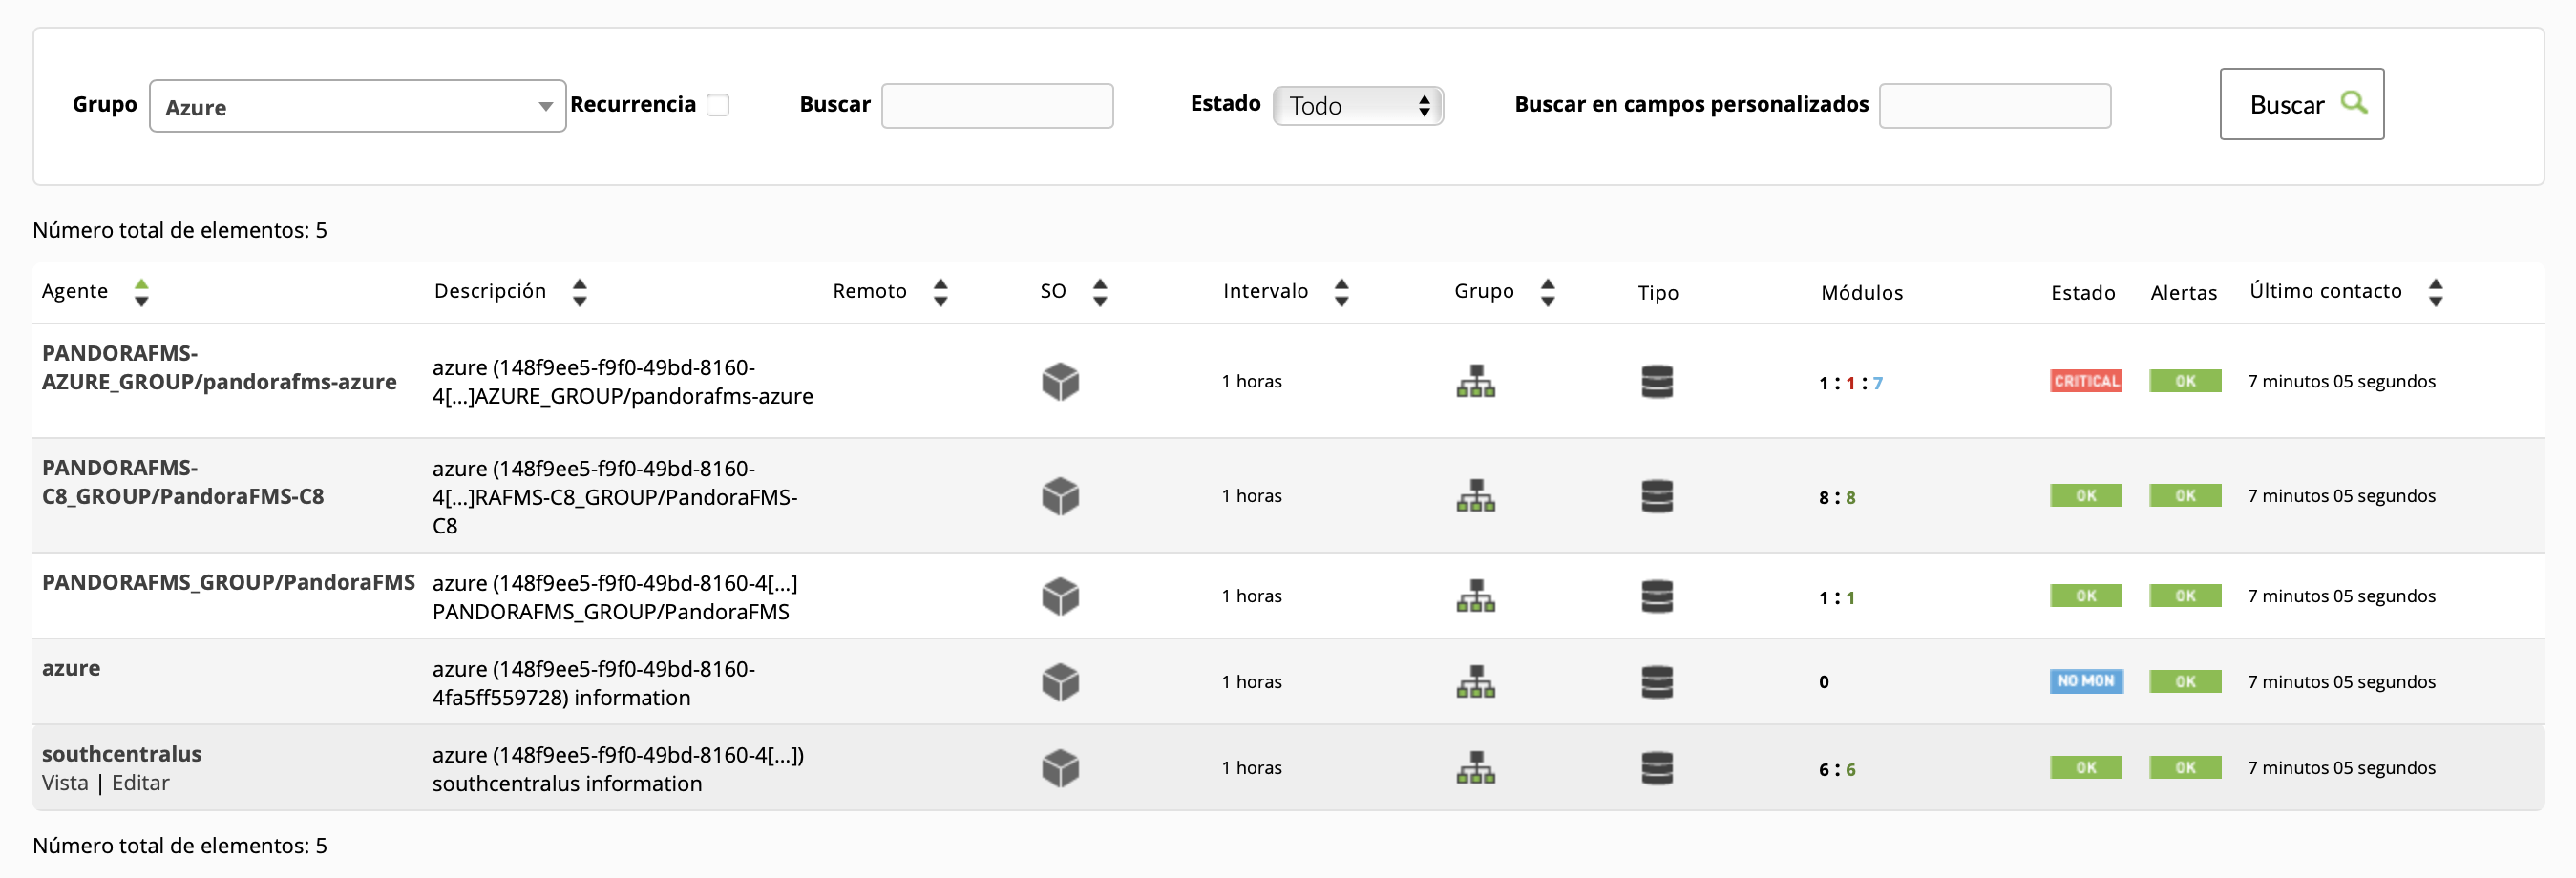
- Azure Monitoring improvements with Discovery: Databases, Storage, Data Factory, PostgreSQL, Event hubs.
- GIS Alerts (2022+).
- IPAM Report (2022+).
- Data consultation to agents in real time (2022+).
- Public/private certificate validation system in remote agent configuration (2022+).
- Load Balancing in API/Console (2022+).
- Automatic remote inventory with satellite (SNMP, WMI, SSH/Linux) (2022+).
- New view to show systems currently affected by a scheduled downtime (2022+).
- SNMP trap reports (top-N by source, type of trap, etc) (2022+).
- Desktop application to configure Pandora FMS agent and see its status (2022+).
- IOT on Satellite server (2022+).
Warp Update
A unified system that allows updating console, server and agents. Fully integrated into the console, which does everything with a single click without having to execute commands, copy files or pray for everything to go smoothly. Fast and centralized, in the case of deployment of centralized updates through the Metaconsole.
Command Center
Command Center is the long-awaited evolution of the Metaconsole, which will allow dozens of nodes to be managed in a totally transparent and centralized way simultaneously, without having to manually synchronize any element.
Security Center
An innovative way to manage server and workstation security, fully integrated with system monitoring.
APM in source code
We want to reach the last frontier of monitoring, the code in applications to measure their times and detect bottlenecks and overloads, combining all the information on the same platform where the infrastructure, servers and application metrics are.
Trend modules
Create a new type of predictive module that compares two time ranges and evaluates, in a percentage or an absolute way, their differences. These modules can be used in alerts, graphs or reports.
E.g.: Access router outbound traffic is 25% higher than last month. This month there are 22 new users compared to the previous month.
Centralized agent update
Update agents centrally from the console. A current enhancement to the remote agent distribution system.
Network computer configuration management
Being able to edit “download” and “upload” full configurations of network equipment through several protocols (TFTP, Telnet, SSH) in order to centrally manage network equipment such as switches and routers. Some of its purposes:
- Schedule configuration backups, restore trusted configuration versions with a single click.
- Detect changes in real time and know “who”, “what” and “when” about configuration changes.
- Upgrading device firmware.
- Save time by automating time-consuming and repetitive tasks using templates and configuration application scripts.
- Make sure changes made to running configurations are saved.
- Compare NVRAM (running) configurations with startup ones (saved) to identify changes that need to be saved.
- Quickly identify and correct unauthorized or failed changes (restoring backup manually).
- Compare configurations with base configurations to identify and reverse unwanted changes.
Netflow
Be able to integrate simple data from a Netflow filter as a Pandora FMS numerical module, to be able to, for example, set alarms when the traffic of a certain flow exceeds its threshold or to be able to measure SLA in flow traffic.
Capacity planning modules
Modules that operate like Capacity Planning reports and can estimate in a future time threshold, e.g.: 1 month, 3 months, the value of a given module, estimating its growth based on a statistical analysis of its history.
Policy auto-implementation
Add a policy self-enforcement system (optional) that works well. Either based on the detection of new elements (in the added group or directly in agents in the policy itself) or even just the possibility of scheduling policy application at a certain time interval.
Data consultation to agents in real time
Upon manual request: configuration data, status, hardware status, OS items, logs, etc., in real time, all from a library of predefined elements. Without complementary configuration, it would only need the deployment of an additional agent to that of Pandora FMS. These data are only for screen display, not for making alerts or reports. The data range would be very broad and standard. It requires direct connectivity from the console and the agent that must listen on a specific port.
Service report
Reports to show service SLA compliance, numerically (%) and with a histogram.
IPAM reports
New reports to, among other things, show the usage percentage of each network, and some other information of interest that appears on the IPAM screens but that cannot be included in reports.
GIS alerts
Be able to send alerts when an agent leaves a delimited coordinate zone, which is often called “geo-fencing”.
Load balancing in Console and API
Provide a standard system that allows load balancing in the console and the API, in order to scale and distribute the load. Perfect for environments where the use of the API is intensive or the console is used in multi tenant environments.
IoT
Offer support to the Satellite Server to natively support modbus and MQTT protocols.
It’s been hard work, but thanks to Pandora FMS employees and our partners and clients, we achieved this Roadmap 2021 – 2023 that will make our work easier in the future and speed it up.

by Sancho Lerena | Last updated Aug 12, 2022 | Cloud & Virtualization
SaaS vs onPremise, do you use the cloud?
Do you use the cloud?
Be aware that we’re not saying that you are in cloud nine, but that you may most likely be using the cloud. That is, if you use Google mail, Microsoft Office 365 office suite or you take a photo with your cell phone and then it gets automatically uploaded to iCloud or something similar, you are using the cloud.
The cloud, as an abstract concept, encompasses a series of technical terminology such as SaaS, IaaS, PaaS, etc. The good thing about the concept of the cloud is that you can guess what it does thanks to the metaphor: we do not know where our data are, or how they get there, nor does it matter much for us, because it is far away and it does not affect us. The great success of the cloud of the 21st century has been to find an especially powerful metaphor that omits the complexity behind that technology and gives us peace of mind.
The concept of using third-party infrastructure for “our stuff” is the oldest thing in computing. In fact, back in the 60s of the last century, most computing worked like this. You connected to a large machine from a computer that was not as such, but a screen and a keyboard. Then the microcomputer craze turned around and every computer was self-sufficient. Now, almost a century later, we have rediscovered that it is more efficient to have everything centralized in one big system.
I have nothing against the cloud. Well, my life is not at stake, unless for example, I entrust the IT infrastructure of my business to the cloud. This is what happened to a number of companies in Asia, such as CITEX or BitMax that used the Amazon cloud (AWS) to host their Bitcoin exchange service (Exchangers), well, them and also the Asian sites from Adobe, Business Insider, Expedia, Expensify, FanDuel, FiftyThree, Flipboard, Lonely Planet, Mailchimp, Medium, Quora, Razer, Signal, Slack, Airbnb, Pinterest, SendGrid and a few hundred more. The cloud is not infallible, the cloud is comfortable.
Today many companies have relied so much on the cloud that it is impossible to take a step back, get out of the cloud, because they would literally have to remake the system with another technology. The cloud is easy but implies total dependence on the provider, especially in technologically optimized systems such as Amazon’s. It’s too good a candy to resist.
Realistically, if you’ve already risen to the sky and are floating with the clouds, and the technology that supports your business is floating above your head, it may not be easy or comfortable to go back, in fact, you may have probably already realized that the cloud is not cheap at all and the costs are increasing over time, and are difficult to predict.
Well, it’s already in, and it’s not going to change, so you should at least be able to keep an eye on what your provider is doing. Monitor the quality of service they offer you and make sure for yourself, because who is watching the watchdog? That’s right, do it yourself, trust no one, do it with your own systems, don’t use a cloud system to monitor another cloud system, put your feet on the ground and buy yourself an umbrella, just in case it rains.
The “lifetime” model: onPremise
On the contrary, we have the classic model of “buying the software” and using it however you want, wherever you want and, whenever you want you change programs without much thought. Oddly enough, this is really the new model, the pay-per-use model that SaaS has copied predates conventional software licenses. The onPremise model gives you the right to use the software on your own computers, in your own facilities and where the manufacturer or software owner does not have any access or rights. The only requirement is to pay for it and use it under the conditions approved by the license you acquired.
Cost analysis: onPremise vs SaaS
The onPremise model has some undeniable advantages, the main one being data security. As it is running on your systems, you own both the information and the processes that use that information. This has legal and business implications, since changing providers can be easier than when you use its SaaS equivalent.
Although it may seem a lie, in the long term the SaaS model is more expensive than the onPremise model, and above all, with the onPremise model it is much easier to estimate the Total Cost of Ownership (TCO) in the medium term. This can be easily demonstrated if we compare the costs in the subscription/pay-per-use model (SaaS) and the license ownership model (onPremise) for one, three and five years.
- Suppose a SaaS license annual cost is €5,000/year. In this case it is pure OPEX (operating costs).
- Let’s picture an onPremise license whose annual cost is €10,000 the first year, and whose annual maintenance cost is 20% (which is the standard in the market). That supposes a renewal cost of €2000/year. In this case, it is pure CAPEX (investment in assets, software).
|
SaaS |
onPremise |
| 1 year |
5,000 € |
10,000 € |
| 3 years |
15,000 € |
14,000 € |
| 5 years |
25,000 € |
18,000 € |
There are intangible factors, such as input barriers, higher in onPremise models, and output barriers, higher in SaaS models. It is also true that an onPremise installation involves additional costs: those of infrastructure, operation and training.
In certain types of applications with little added value such as office tools, the SaaS model is here to stay. Office 365 or Google Docs are a perfect example.
In other cases, such as Adobe Photoshop, the onPremise model has been combined with a pay-per-use -subscription- model (but without being SaaS) combined with the conventional onPremise licensing model.
Summary of arguments in favor of each model
| SaaS |
onPremise |
| Security depends on the provider. |
Security depends on the customer. |
| The responsibility for the operation lies with the supplier. |
The data is owned by the customer. |
| Savings in infrastructure and operating costs. |
Lower long-term license costs. |
| Ease of financing (monthly or quarterly payment). |
Easier-to-plan long-term costs. |
| Opex |
Capex |
| Lower input barriers. |
Higher input barriers. |
| Higher output barriers. |
Lower output barriers. |
| Faster deployment times. |
It is easier to integrate with the rest of the business processes. |

by Dimas Pardo | Last updated Sep 1, 2021 | Tech
A few rules for safe password management
In this, our competent blog, we boast of always giving you good advice and providing you with the technological information necessary for your life as a technologist to make sense. Today it is the case again, we will not reveal the hidden secret about the omnipotence of Control/Alt/Delete, but almost. Today in Pandora FMS blog, we give you a few tips for safe password management.
Safe password management
The purpose of this article is for users to be responsible for keeping their coveted passwords or authentication information safe when accessing confidential information. Because think about it, dear reader, how long ago did you come up with your first password? Surely it was to enter your select club in the treehouse. Maybe you even still choose the same for your social networks, Netflix or office pc. Was it as ordinary as your birth date? Your name and the first two acronyms of your surname? “RockyIV”, which was the name of your fourth favorite pet and movie? I don’t blame you, we have all been equally original and carefree when choosing a password.
But that is over! Many things already depend on this password, on this motto or pass that must include more than eight characters and at least one capital letter and one number. Your company security is not a game, damn it! There is a lot of mischief and felon out there that can put you and your businesses in a loophole, because of a vulnerability such as having a poor password! But do not worry, we will help you, we will talk about safe password management. We are Pandora FMS blog, we like potato salad, Kubrick movies and fighting against injustices!
Recommendations for safe password management
*Obvious but vital fact: User IDs and passwords are used to check the identity of a user on systems and devices. I just point that out here as an outline in case someone is so lost that they don’t know this. I repeat that we are talking about strong password management, so knowing what a password is is a must and saves time.
Said passwords are necessary for users to have access to information, normally, even if the merit is not recognized: capital information in your company. User IDs and passwords also help ensure that users are held accountable for their activities on the systems they have access to. Because yes, telereader friend, users are responsible for any activity associated with their user IDs and passwords. For that reason, it is very important for you to protect the password with your life and comply with the following policies related to them:
- Users may not, under any circumstances, give their password or a password indication to a third party. *This seems obvious, but trust me, it is not. People sneak passwords like they’re office whispers or reggaeton choruses.
-
Users will not use user identifiers or passwords of other users. *As we can see, in this case, sharing is not living.
-
Users must change initial passwords or passwords received as temporary “reset” passwords immediately upon receipt. *For me, this is the most exciting and creative part, you never want to set the abstract code they give you, you want to improvise, imagine, CREATE!
-
Users should change their passwords if they suspect that their confidentiality may have been compromised, and immediately report the situation as a security incident. *Don’t be ashamed of yourself, admit that someone may have violated your secret and repent before it’s too late.
-
Users should not use the “remember password” function of programs. For example, if an application sends users the message of “automatically remember or store” the user’s password for future use, they will have to reject it. *This is a piece of information you did not know, huh? Well, it is as interesting as it is important.
-
Users should not store passwords without encryption, for example, in a text file or an office document. In this case, this document must be protected with access control.
-
When an administration password must be communicated, never send by the same means, the user and the password. For example, the user should be sent by email and the password by instant messaging. *I know that sometimes you try to save time, but with these things you better take your time and do not risk it.
-
Users should not set the password on a post-it on the monitor, nor on the table, nor in the drawer or “hidden” in another place in the office or among your personal belongings. *This is one of the big mistakes everyone makes. Yes, post-its or notebook sheets have always helped us, but this time they are too obvious to keep such a big secret.
-
Users should not use the same password for two systems or different applications. *Sorry, but you will have to memorize more than one. But rest assured, if a chimpanzee could recognize the descending sequence of nine numbers, someone who graduated from elementary school can do better.
-
Users who find out the password of other users must report it, ensuring it is changed as soon as possible. *Here fellowship first and foremost. It is not only right hugging after company dinners. Camaraderie above all!
-
Users must change their passwords at least once a year, or when indicated by the system, and in the case of administration passwords every 180 days, or in the event of changes of personnel in the company that may know them.
-
If now you are afraid because you do not have a strong enough password, it’s normal, but I repeat, calm down, follow the following rules for passwords creation (if the system supports them) and nothing will go wrong:
-
a) Passwords must be at least six characters long.
-
b) Passwords must not be easily predictable and must not be contained in dictionaries. For example: your username, date of birth, or 1234, we all know that one.
-
c) Passwords must not contain consecutive repeating characters. For example: “AABBCC”.
-
d) Passwords must have at least an alphanumeric character, a numeric character, and a special character.
Good, and so far that was the lecture about being responsible that you must assume and internalize if you want things to go smooth at least in terms of passwords and vulnerabilities. Oh, nothing to thank us for! You know: “Life is beautiful. Password yourself”. Look, that could be your new password, right? No, the answer is NO! REMEMBER EVERYTHING WE LEARNED TODAY IN THIS ARTICLE!
Would you like to find out more about what Pandora FMS can offer you? Find out clicking here .
If you have to monitor more than 100 devices, you can also enjoy a FREE 30-day Pandora FMS Enterprise TRIAL. Installation in Cloud or On-Premise, you choose !! Get it here .
Last but not least, remember that if you have a reduced number of devices to monitor, you can use the Pandora FMS OpenSource version. Find more information here .
Do not hesitate to send us your questions. Pandora FMS team will be happy to help you!
And if you want to keep up with all our news and you like IT, releases and, of course, monitoring, we are waiting for you in our blog and in our different social networks, from Linkedin to Twitter through the unforgettable Facebook . We even have a YouTube channel , and with the best storytellers.

by Pandora FMS team | Last updated Nov 17, 2022 | Tech
Everybody knows Nagios, or at least… everybody should know Nagios.
It is a useful tool to monitor systems and networks that thousands of users worldwide have been using for more than fifteen years.
Then, if it is so popular, on what are we based to say that it is not a good solution?
Careful! We’re not saying that Nagios is a bad tool, but many times the fact that it is a solution so extended and used everywhere in the world may make us assume certain things about the product and leave aside the most important question: What is what your business really needs?
After almost 20 years of experience in server, network and security technology, we dare to list some of the reasons for which it is not a good idea to assemble a Nagios system to manage a monitoring service on which business continuity depends.
Nagios technical features
Nagios has been with us for almost a quarter of century. And that’s good, but it also entails some limitations.
1. It’s not a product, it’s a project
When Nagios is installed in a company, it is installed specifically for that company, so you will not find two Nagios alike, installed and deployed in the same way. Their internal configuration files will be incredibly different.
That is always a problem in the long run.
Why?
If two technicians write a script differently and that makes it difficult to interpret them by a third party, imagine what would happen with a configuration mega-script as complex as that of Nagios.
Although two environments and two problems may be identical, the technician of the first environment will have problems understanding the Nagios installation of the second one and the technician from the second one will have trouble with the other Nagios installation.
2. Plugins Puzzle
The standard features of basic Nagios are extremely limited.
The solution to extend it is to install plugins, addons and third-party extensions, which makes it an even less standard ecosystem.
Simply put, Nagios is a puzzle of pieces made by people who have nothing in common and who lack a joint overview.
3. High dependency
Since Nagios is a tailor-made project, it depends on a limited group of people (some of whom are out of your reach) who will be there to hear your complaints, but may not even be able to solve the problem, as there will not be a final person in charge.
This team will be the only one that can maintain the installation of Nagios, therefore the knowledge will not be easily scalable or transferable to third parties.
4. Poorly scalable and flexible
Nagios is not intended for changing environments. Its configuration is static, cumbersome and complicated to integrate into automatic provisioning processes.
As it is well known, scalability is not Nagios’ strong point.
Business Aspects with Nagios
A tool like Nagios brings a number of limitations to your business. Not only for what it is able to do, but for the cost of maintaining it.
Particularly:
5. Software unit and human dependence
If monitoring is the key to your business, to growth or to maintaining current production, with Nagios you will stop relying on a software vendor and start relying on a small team of specialists.
The ones known as Gurus.
6. Unsolvable problems
Any problem that your technicians do not know how to solve will be unsolvable, especially if the implementation is very customized, since no one outside your company will know what changed or how to solve it.
Systems are audited in large companies and, in most cases, product manufacturer support is essential.
7. Large derivative costs
Although initially Nagios may seem cheaper than other solutions (you save yourself a recurring license cost), the problems arising from its maintenance will make it much more expensive in the long run.
8. Risk of losing support
If the technical team (usually a single person) leaves the company, it will be impossible to maintain the monitoring project.
There will be no support, training or documentation that can replace the “guru” who assembled it and, at best, it will be like starting from scratch.
At worst, it will take longer to understand what is assembled and how it is managed correctly.
9. Human Cost vs License Cost
Paying the salary of a Nagios guru for three years is much higher than the cost of a license, a training course and a systems technician.
After all, monitoring with Nagios takes up the time of a highly qualified technician who specializes in a task that bears no benefit.
Especially because it may not have to be carried out.
10. Alternatives available
There are dozens of software applications with license, support and training plans that will save you lots of headaches.
You probably don’t need all the power that Pandora FMS Enterprise can offer you and it’s enough with PRTG or What’s up Gold. Or maybe with Pandora FMS free software version.
We only recommend Pandora FMS Enterprise to those organizations that have needs that justify the versatility, power and flexibility of our tool.

by Sancho Lerena | Last updated Aug 27, 2021 | Tech
Introduction
Do an exercise, ask five IT technicians -of any profile- what SNMP means.. If you’re close with them the better, so that the first thing they do is not go to Wikipedia to boast. Hopefully, they might tell you what they said to me when I was working in networks.
“Security is Not My Problem”
Taking into account that the SNMP protocol is one of the monitoring bases, and a system that has been in use for more than thirty years, this answer, “Security is Not My Problem”, sums up the current monitoring situation quite well: ignorance, laziness and lack of interest in monitoring security.
By the way, we talked about SNMP in another article on our blog and I will give you a teaser in advance, it means Simple Network Management Protocol and it comes from 1987.
Considering that monitoring is “key to the kingdom”, since it allows access to all systems and even access many times with administration credentials, shouldn’t we take security a little more seriously when we talk about it?
Recent vulnerabilities in well-known monitoring systems such as Solarwinds or Centreon make the need to take security seriously in the implementation of monitoring systems increasingly urgent, since these have a very strong integration with systems.
In many cases, security problems are not so much about one piece of software being much safer than another, but about poor configuration and/or architecture. It must be taken into account that a monitoring system is complex, extensive, and in general, it is highly adapted to each organization. Today it was Solarwinds, tomorrow it could be Pandora FMS or Nagios.
No application is 100% secure, nor is any corporate network secured against intrusion, whatever the type. This is an increasingly evident fact and the only thing that can be done about it is to know the risks and assume which ones you can take, which ones absolutely not, and work on the latter.
Safe monitoring architecture
It is essential to keep in mind at all times that a monitoring system contains key information for a possible intruder. If monitoring falls into the wrong hands, your system will be compromised. That is why it is so important to devote time to the architecture of your monitoring system, whatever it may be.
Carry out a first analysis, collecting the requirements and scope of your monitoring strategy:
- Identify what systems you are going to monitor and catalogue their security levels.
- Identify which profiles will have access to the monitoring system.
- Identify how you will obtain information from those systems, whether through probes/agents or remote data.
- Identify who is responsible for the systems you are going to monitor.
The architecture of a system will have, whatever the chosen software, the following elements and will have to take into account its network topology, its resources and the way to protect them properly:
- Information display interface (web console, heavy application).
- Data storage (usually a relational database).
- Information collectors (intermediate servers, pollers, collectors, etc.).
- Agents (optional).
- Notification system (alerts, notices, etc.).
Monitoring system securing
No matter how correct the implementation of a system, its architecture and its design as a whole is, if one of the elements that make it up is violated, the damage it may suffer by a malicious attack compromises the entire structure. For this reason, in security there is a saying, “Security is a chain and your real security always depends on its weakest point.”
This list of security concepts applied to the architecture of a monitoring system can be summarized as the features that a monitoring product must have to ensure maximum security in an implementation:
- Encrypted traffic between all its components.
- High availability of all its components.
- Integrated backup.
- Double access authentication.
- Delegated authentication system (LDAP, AD, SAML, Kerberos, etc.).
- ACL and user profiling.
- Internal audit.
- Password policy.
- Sensitive data encryption.
- Credential containers.
- Monitoring of restricted areas/indirect access.
- Installation without superuser.
- Safe agent/server architecture (passive).
- Centralized and distributed update system.
- 24/7 support.
- Clear vulnerability management policy by the manufacturer.
Monitoring infrastructure basic securing
The management console, monitoring servers and other elements should never be on an accessible public network. The console should always be protected on an internal network, protected by firewalls and, if possible, on a network independent from other management systems.
The operating systems that host the monitoring infrastructure should not be used for other purposes: for example, to reuse the database for other applications, nor the base operating systems to run other applications.
Safe and encrypted traffic
You should make sure that your system supports SSL/TLS encryption and certificates at both ends at all levels: user operation, communication between components or sending data from the agent to the servers.
If you are going to use agents in unsafe locations, it is highly recommended that you force all external agents to use certificate-based authentication at both ends, to avoid receiving information from unauthorized sources and to prevent information collected by agents to not travel transparently.
On the other hand, it is very important for you to activate encryption on your web server to provide an encrypted administration console and prevent any attacker from seeing access credentials, remote system passwords or confidential information.
Full High Availability
For all elements: database, servers, agents and console.
Integrated backup
The tool itself should make this as easy as possible, as settings and data are often highly distributed and consistent backup is complex.
Clear vulnerability management policy by the manufacturer
Every day, dozens of independent auditors test the strengths and weaknesses of all kinds of business applications. They seek to gain a foothold in the sector by publishing an unknown ruling to increase their reputation. Many clients, as part of their internal security management processes, execute external and internal security audits that target their IT infrastructure.
Be that as it may, all products have security flaws, the question is: how are those flaws handled? Transparency, diligence and communication are essential to prevent customers from having problems derived from vulnerabilities in the software they use. It is essential that there is a clear policy in this regard, so that it is known which public vulnerabilities have been reported, when they have been corrected and if a new one is detected, the steps to follow for notification, mitigation and distribution to the end customer.
Dual authentication system
Pandora FMS has an -optional- system based on google authenticator that allows forcing its use for all users for security policies. This will make user access to the administration console much safer, preventing that due to privilege escalation the system can be accessed as administrator, which is, at best, the highest risk that can be run.
Delegated authentication system
Complementary to the previous one, you can delegate management console authentication to authenticate against LDAP, Active Directory, or SAML. It will enable a centralized access management, and combined with the double authentication system your access will become much safer.
ACL and user profiling
Identify and assign different users to specific people. Do not use generic users, assign only the necessary permissions and do not use “super administrators”. They are good practices not only for monitoring tools but for any business software implementation with access to sensitive information.
Nowadays, any professional tool to define an access profile for each user will do so in such a way that no user has “absolute control”, but only has the minimum required access to their functions.
Internal audit system
You must have a system in place to record all user actions, including information on altered or deleted fields. Said system must be able to be exported abroad so that not even the administrator user can alter said records.
Password policy
A basic element that allows you to enforce a strict password management policy for access to application users: minimum password size, password type, their reuse, forced change once in a while, etc.
Sensitive data encryption
The system must allow the most sensitive data to be stored encrypted and safely, such as access credentials, monitoring element custom fields, etc. Even if the system itself contains the encryption “seed”, it will always be much more difficult for a potential attacker to access this information.
Credential containers
Or an equivalent system for the administrator to delegate credential use to other users who use said credentials to monitor elements without seeing the passwords contained in the container.
Restricted area monitoring
In these systems, information will be collected remotely by a satellite server and will be available to be collected from the central system (in Pandora FMS through a specific component called Sync server). That way, data can be collected from a network without access to the outside, ideal for very restrictive environments where the impact is drastically reduced if an attacker takes over the system.
Agent remote management locking system
For critical security environments, where the agent cannot be remotely managed once it is configured. This is especially critical in monitoring, since if a system is compromised and its administration is accessed, by the way the system is configured itself, it will have access to all systems from where it receives information. In critical systems, the remote management capacity must be deactivated, even if that makes administration more tricky. The same applies to automatic updates on the agent.
Design of safe architecture for communication with agents
Sometimes known as passive communication. That way, agents will not listen to a port nor have remote access from the console. They are the ones who will connect to the central system to ask for instructions.
Installation without root
Pandora FMS can be installed in environments with custom paths without running with root. In some banking environments, it is a requirement that we meet.
Notification and reporting system (alerts, notices, etc.)
A monitoring system is only useful if it shows accurate information when it is needed. Alert or weekly report reception is the culmination of all the previous work and for that you will have to take into account some “obvious” points that are often overlooked. Protect those systems, wherever they may be.
Periodic updates
All manufacturers now distribute regular updates, which include both bug fixes and security problems. In our case, we publish updates approximately every five weeks. It is essential to update systems as soon as possible, because when a vulnerability is reported, product managers ask external security researchers who have reported the bug, not to publish anything about the vulnerability until a patch is published. Once the patch is published, the researcher will publish the information in more detail as wished, a fact that can be used to exploit and attack non-updated software versions.
Pandora FMS has a vulnerability disclosure public policy as well as a public catalog of known and reported vulnerabilities. Our policy has maximum transparency and full communication with security researchers, always to mitigate the impact of any security problem and to be able to protect our clients as a top priority.
24/7 support
In our support, the technician who answers the phone has the whole team backing him up. If there is a security issue and a security patch has to be published within hours. We not only have the technology to spread the patch to all our customers, but also the team to develop it in record time.
Base system securing
Hardening or system securing is a key point in the global security strategy of a company. As manufacturers, we issue a series of recommendations to carry out a safe installation of all Pandora FMS components, based on a standard RHEL7 platform or its equivalent Centos7. These same recommendations are valid for any other monitoring system:
Hardening checklist for monitoring base system:
- System access credentials.
- Superuser access management.
- System access audit.
- SSH securing.
- Web server securing.
- DB server securing.
- Server minimization.
- Local monitoring.
Access credentials
To access the system, nominative access users will be created, without privileges and with access restricted to their needs. Ideally, the authentication of each user should be integrated with a double authentication system, based on token. There are free and safe alternatives such as Google Authenticator that can be easily integrated into Linux, although outside the scope of this guide. Seriously consider its use.
If it is necessary to create other users for applications, they must be users without remote access (for this, it is necessary to deactivate their Shell or some equivalent method).
Superuser access through sudo
In the event that certain users must have administrator permissions, SUDO will be used.
Base system access audit
It is necessary to have the security log /var/log/secure active and monitor those logs with monitoring (which we will see later).
By default CentOS has this enabled. If not, just check the /etc/rsyslog.conf or /etc/syslog.conf file.
We recommend you to take the logs from the audit system and collect them with an external log management system. Pandora FMS can do it easily and it will be useful to set alerts or review them centrally in case of need.
SSH server securing
The SSH server allows you to remotely connect to your Linux systems to execute commands, so it is a critical point and must be secured by paying attention to the following points:
- Modify default port.
- Disable root login.
- Disable port forwarding.
- Disable tunneling.
- Remove SSH keys for remote root access.
- Investigate the source of keys for remote access. To do this, look at the content of the file /home/xxxx/.ssh/authorized_keys and see which machines they are from. Delete them if you think there shouldn’t be any.
- Establish a standard remote access banner that clearly explains that the server is a private access server and that anyone without credentials should log out.
MySQL server securing
Listening port. If MySQL server has to provide service to the outside, just check that the root credentials are safe. If MySQL only gives service to an internal element, make sure that it only listens on localhost.
Web server securing
We will modify the configuration to hide the Apache and OS version in the server information headers.
If you use SSL, disable unsafe methods. We recommend the use of TLS 1.3 only.
System service minimizing
This technique can be very exhaustive. It consists simply of eliminating everything that is not necessary in the system. Thus we avoid possible problems in the future with poorly configured applications that we really did not need and that can be vulnerable in the future.
Local monitoring
All the internal monitoring systems would have to be monitored to the highest level, specially information registries. In our case the following active controls in addition to the standard controls are always recommended:
- Active security Plugin.
- Complete system inventory (specially users and installed packages).
- System logs and server security.
Would you like to find out more about what Pandora FMS can offer you? Find out clicking here .
If you have to monitor more than 100 devices, you can also enjoy a FREE 30-day Pandora FMS Enterprise TRIAL. Installation in Cloud or On-Premise, you choose !! Get it here .
Last but not least, remember that if you have a reduced number of devices to monitor, you can use the Pandora FMS OpenSource version. Find more information here .
Do not hesitate to send us your questions. Pandora FMS team will be happy to help you!
And if you want to keep up with all our news and you like IT, releases and, of course, monitoring, we are waiting for you in our blog and in our different social networks, from Linkedin to Twitter through the unforgettable Facebook . We even have a YouTube channel , and with the best storytellers.

by Sancho Lerena | Last updated Aug 11, 2023 | Tech
Pandora FMS started as a totally personal open source project back in 2004. I wasn’t even a professional programmer, I was doing Unix security consulting. In fact, I chose PHP but Pandora FMS was my first application with PHP, I knew some things about ASP and my favorite programming language had been C.
A project with a single programmer and no professional users of his software yet is very different from a project with several dozen programmers and hundreds of clients using the software in critical environments. The evolution that Pandora FMS has undergone from 2004 to 2021 is a real case of steady improvement in software engineering.
Fortunately, I did not pay much attention to that subject of the degree, because most of the things that work and that I have learned with practice do not come in a book, nor are they explained at the university, because each software project and each team of people is very different. It may sound cliché, but it is the truth, and it is better to accept it and avoid formulas, because building a solid software product that can grow over time is not trivial at all.
In this article, I am going to talk about our experience, our evolution over time, but above all, about how our engineering processes work today. I have always believed that the most important part of open source is transparency, and that this should apply to everything, not only to software but also to processes and knowledge in general.
Version control system
It is an essential part of any software project. Today the ubiquitous GIT is everywhere (by the way, not everyone knows that Git is the work of Linus Torvalds, original author of the Linux kernel). A version control system helps, in short, a group of developers work without overlapping their jobs.
When the Pandora FMS project started, I was working without version control, because there were no other people. When some people began to collaborate on it, we realized that a simple shared directory was not worth it, because we were overlapping the code and, yes, making backups to save old versions was not a very efficient method.
The first version control system we used was CVS, which we have been using for eight years or more. Around 2008, we started using SVN (Subversion) another slightly more efficient system and it wasn’t until 2013 when we started using GIT and opened our official repository on Github.
Pandora FMS public repository on Github
Since Pandora FMS has an open source version and an Enterprise version -with proprietary code and commercial licenses- we have two GIT projects, one public on GitHub and the other private, which we manage with GitLab. The GitHub version is in sync with our private copy on GitLab at our offices. Some partners who collaborate with us in developing have access to this private repository, and through an extension of our support application (Pandora ITSM) we share all development planning tickets by releases with some of our partners, so that they can see in real time, the development planning based on “releases” and all the details of each ticket.
GitLab ticket view in Pandora ITSM/em>
Release ticket view
Development methodology used in Pandora FMS
At Pandora FMS, we have been using our own methodology from the beginning, although we have borrowed many ideas from agile methodologies, especially from SCRUM. From a life cycle point of view, we use an adaptation of the Rolling Release methodology
These are some important definitions when defining how we work, some of them come from Scrum, others from other methodologies.
Objectives of Pandora FMS work methodology
The objectives involve not only the development members, but also QA, the documentation team and part of the marketing team:
-
- Maximum visualization: The entire team must see the same information, and it must flow from bottom to top and from top to bottom. By sharing objectives we will be able to do a more effective job.
- What is not seen does not exist, which implies that all information relevant to the project must be reflected in the management, implemented with Gitlab. What is not seen does not exist, and what does not exist will not be taken into account for any purpose. Strictly following this methodology will allow everyone to be very aware of the planning:
-Strict deadline compliance.
-Advance planning without last minute modifications.
-Clearer information and in due time.
-Elimination of work peaks and etc.
- Integrity,, with an increasingly large and complex project, it is imperative to keep integrity during development. All code must follow standards..
Ticket
The ticket is the minimum work unit. There is a single person responsible for its completion and it is planned to be carried out in a milestone (version release).
A ticket is the way in which the development work is broken down, so a big feature will be made up by different tickets, on which ideally several people can work.
The ticket must contain a functional or description of the requirements, which can include diagrams, specifications, interface diagrams (mockup), test sets, examples, etc. In some cases it may even contain the analysis and design of the whole solution.
A completed ticket must perform as specified in the functional document (ticket) and the changes that have been made to these specifications must be reflected in the ticket.
The functional is key so that QA can validate a ticket or not. QA will have to reopen a ticket if it does not meet any of the functional aspects.
Members and working groups
Product Owner (PO)
The PO defines where Pandora FMS has to go, in contact with customers, support and
the “real” market situation, providing technical and functional guidelines but without getting involved in development as such.
Product Committee
Group of people who will meet permanently with the PO to agree where the product is going to, trying to ensure that all PO decisions are collegiate. It is made up of the leader of each Development, QA, Support, Projects and Documentation team.
Development Manager (DM)
The DM will manage the entire development cycle: define milestones, priorities, manage
individually all members and make operational decisions. The DM reports exclusively to PO and is the leader of the development team.
Development Team
They are in charge of the development of large features and product improvements, complete code refactoring, change development (small features), bug fixes and product maintenance improvements.
QA Team
They verify that each development atomic unit works as defined in the
specifications. They will also create and maintain an ecosystem of automated testing for both backend and user experience.
Support Team
They are the ones who deal directly with the client solving issues. Their experience with the product’s day-to-day means that their opinions must be taken into account, that is why they are part of the product committee.
Project team
They implement it on the end customer and are the ones closest to the customer, since they are often there before the project exists, and they usually offer ideas and all kinds of features in hand, for all purposes they are the “speaker” of the commercial department, therefore they are part of the product committee.
Training and Documentation Team
Responsible for training and the product’s documentation. They coordinate with the marketing team and the translation team.
Remote working
All team members (development, QA, documentation) telework freely. In fact, developers from Europe, Asia and America participate in Pandora FMS, and within Spain they are distributed throughout the national territory. We are a 100% distributed and decentralized company, although with traditional hierarchies.
In order to telework, we need each member to take responsibility for their work, be autonomous and commit to planning. Teleworking entails minimizing the need for oral communication and physical personal meeting, replacing them not with teleconferences, but with a precise use of the tools of the development process.
Development watch-keeping
A developer on the team is especially devoted to solving incidences involving code, in permanent connection with the support team (from 8 am to 8 pm, CEST). This allows not only to have maximum agility when solving a problem on a client, but also code changes are integrated into the code repository in an organized way.
Ticket creation and classification process
Any member of the company (including salespeople) can create a ticket in GitLab. This includes customers and partners, although in their case there is a prior filter by the support team and the sales team respectively.
The more detailed the ticket, the more unequivocal the development will be. Add images, gifs, animations and all the necessary clarifications. As well as the way to access the environment where the problem has been found or the contact persons. A developer will never contact a customer directly. If there is the need to interact with them, it will be done through the support or project team.
Nobody, except for the DM or PO, can change a ticket milestone. On creation, the ticket will not have an assigned milestone or assigned user. The task of defining which release a ticket belongs to is the responsibility of PO and DM exclusively.
When a ticket is finished and the developer thinks it should be reviewed by a colleague, they mention it in the merge request through @xxxxx. The review must be nominal. This review is independent of the code review carried out by the department manager.
General ticket workflow
- The ticket is assigned to a programmer by the DM. If it does not have a ticket assigned, the ticket will be auto-assigned. (See below the terms that regulate this system).
- The developer must understand/solve any questions that may arise after reading the functional document, if necessary, check with the DM or the author of the ticket. This must be done before starting to develop. Once read, you must, in order:
- Evaluate (by assigning labels) its complexity and size, reaching a prior consensus with the DM.
- Develop the feature following the ticket specifications
- Document everything developed in the same ticket or, if required, in a new documentation ticket. This ticket must relate to the “parent” ticket by ticket #ID.
- The developer must test its functionality at least in:
-standard docker development environment
-docker development environment with data.
- When it is deemed complete, it will be tagged ~ QA Pending and placed in the hands of QA.
- For each FEATURE ticket, there will be a reference person, generally from projects, support or even the PO itself. This person will be the one who will define part of the functional (together with the DM and PO), but above all, this person will be the reference person for the developer to ask any details during development, and most importantly, should see the development progress, step by step, so that it is validated.
- Any change to the functional will be reflected by the reference person in the ticket as comments, without altering the original functional.
- If there is a child documentation ticket, QA will validate the ticket using the documentation generated by the reference person, NOT by the functional of the ticket, validating the documentation and the feature at the same time.
Release planning
When creating a ticket, the milestone must be empty (not assigned) like the user. The only ones that can classify a ticket are: DM and PO.
A series of milestones have been defined to support the ticket classification process, some of them, those dated (releases), can be seen as milestones, while the rest should be seen as simple ticket containers.
- (Not allocated): It is the absence of milestones in a ticket. For all intents and purposes, this ticket “does not exist yet.” The DM and PO will validate each and every one of these tickets to see if they make sense in the product roadmap. No developer should take any of these tickets.
- Feature backlog: Tickets that will be made at some indeterminate time in the future that sooner or later will have to be addressed. No developer should take any of these tickets.
- Low priority bugs: Reported bugs with no priority assigned yet by PO/DM. No developer should take any of these tickets.
- STAGE: Tickets proposed by each department for planning in a product release. At each planning meeting, these tickets will be discussed, and moved to other milestones. At the end of the cycle start meeting, this milestone should be empty. The DM is the one who has the final decision as to which STAGE tickets are assigned to a certain release and which are not, relying on the product committee if necessary. No developer should take any of these tickets.
- XXX: Release XXX. Milestone that groups a series of tickets that will be released on a certain date. A milestone has a deadline associated with it. In the case of RRR releases, this date could change, in the case of LTS not.
- The development of the tickets associated with a release must be finished 5 days before the scheduled day for the release. Tickets not completed before that date will be delayed to the next release and the delay will have to be justified to the DM.
- There are two types of release milestones:
-LTS: in April and November. They are 6 months apart.
-Regular Releases (RRR): There will be 2 to 4 regular releases between LTS releases.
- A developer with no assigned tasks for a release, as long as there are no pending assignment tickets in the release milestones for the developer’s team, can take one of the unassigned tickets from:
-The closest release, based on date.
-Second closest release, based on date.
CICD
Pandora FMS developers integrate the code of their branches in a central repository several times a day, causing a series of automatic tests to be executed whose objective is to detect faults as soon as possible and improve the quality of the product.
These tests run dynamically in a series of executors or “runners”, some of them specific, for certain architectures (e.g., ARM), that execute static code analyzers, unit tests, and activate containers to carry out integration tests in a real installation of the application.
The generation of Pandora FMS packages is completely automated. Packages are generated every night from the development branch for manual testing. They can also be generated on demand by any developer or member of the QA or support teams, from any branch through the GitLab web interface.
When a release is made from the stable branch, in addition to package generation, a series of steps are executed that deploy them to Ártica’s internal package server, to SourceForge, to Ártica’s customer support environment, and that, likewise, update the Debian, SUSE and CentOS repositories along with the official Docker images.

by Guillermo Sánchez | Last updated Jun 10, 2021 | Tech
Pandora FMS is a proactive, advanced, flexible and easy-to-configure monitoring tool according to each business. Pandora FMS integrates with the needs of the business, being able to monitor servers, network equipment, terminals and whatever is necessary.
In this article we will focus on monitoring using Pandora FMS, bearing in mind the new reality, which has arrived to stay, known as “Digital Transformation”.
Digital Transformation
First of all, let’s start by understanding what Digital Transformation is all about, a widely used term, but at the same time somewhat confusing for many people, due to its broad definition.
Digital transformation is a concept that encompasses the integration of the different technologies, used in the different areas of a company, fundamentally changing the way it works and delivers value to its customers. It is also a cultural shift that requires organizations to constantly challenge the status quo, experiment, and feel comfortable with the change.
It is not new that technology advances faster and faster generating a constant challenge, that is why we must be on the watch for these advances, to be able to adopt new technologies and achieve the cycle of “Continuous Improvement”, taking advantage of the tools that allow us to be more and more efficient.
As part of this change, there are key technologies that allow us to digitize our information and adapt to this new reality that is here to stay.
- Cloud Computing (Amazon AWS, Microsoft Azure, Google Cloud): It gives your organization faster access to the software it needs, new features and updates, as well as data storage. Cloud computing allows you to be agile enough to transform quickly.
- Information technology: It allows an organization to focus its investment on talent, research and development, and customized solutions that support the requirements and processes that differentiate it in the market.
- Machine learning and artificial intelligence technologies: They provide organizations with more accurate information for decision-making on sales, marketing, product development and other strategic areas.
- Other technologies that drive business transformation are: blockchain, blockchain, augmented reality and virtual reality, social networks, and the Internet of Things (IoT).
Since the beginning of computing, companies had at least one server/computer as part of their daily tasks. This implied additional tasks such as: technical support, and infrastructure maintenance.
Some years ago, it was common to find email servers, installed in the company, generating the great challenge to keep a critical service, like this one, running 24/7. Today there are private cloud solutions such as: Microsoft 365 or Google Apps, that allow you to have email with a very high SLA, without the need for your own infrastructure, using the service as SAAS (Software as a Service).
To understand where we are at and where to start, with the digital transformation process, we are going to explain the four most common infrastructure scenarios:
On-Premise (Local Infrastructure): Servers that work in the company and require a great effort to maintain them.
IaS Cloud (Infrastructure as a Service): In this scenario, virtual machines can be run in the cloud, such as, for example, a Windows Server, some Linux distribution where you install the essential tools to use the corporate application that you need to use. The provider ensures the availability of the virtual machine and the company is responsible for the software that is installed. In this case, Amazon AWS, Microsoft Azure, Google Cloud, etc. can be used.
PaaS Cloud (Platform as a Service): Services that work in the cloud and that have a platform such as: SQL Server, Oracle, SAP, Docker, Etc.
SaaS Cloud (Software as a Service): Services that work in the cloud and have a management tool, such as Exchange Online, Google Apps (Corporate Gmail), OneDrive, Google Docs, Etc.
After this introduction, we are going to understand the value of Pandora FMS for any of the previous scenarios, at the time of Digital Transformation.
Some time ago, we already published an article on this blog with the installation script for IaS Cloud. As a requirement you need to have a Virtual Machine with CentOS 7, which has 2 GB of RAM and 20 GB of Disk.
Executing the following command: curl -Ls https://pfms.me/deploy-pandora | sh on a computer that has an Internet connection, you will obtain an installation of Pandora FMS Community in an On-Premise scenario or in the cloud that you use:
https://pandorafms.com/community/get-started/
For the Enterprise version, we have a Free 30-day Trial. Request it here!
Now that you know that you can install Pandora FMS in the scenario that is most convenient for you, we are going to see which are the required ports to be able to use the tool from a public cloud:
| Port |
Description |
| 443 TCP (https) |
WEB console |
| 41121 TCP (Tentacle) |
Software Agent Connection/td> |
With this configuration you can use Pandora FMS key features. We are going to see just a few of them. Very useful for this reality of continuous changes.
Remote Configuration, Policies and Collections: With this configuration you can make all the changes on the monitoring agents, using Pandora FMS web console, being able to build the Agent Plugins and distributing them in a centralized and simple way.
Agents with Remote Configuration
Satellite Server: A very interesting possibility is to set up an agent with advanced features. It allows you to discover the different remote networks, servers, and network computers, using ICMP, SNMP and WMI protocols. It is not necessary to open any ports on the firewall, where the Satellite Server is installed. You have the possibility of reaching Pandora FMS server with port 41121 TCP Tentacle and, for example, remotely monitor the devices from the different locations and/or branches.
Several Satellite Servers, reporting to a console in Azure
Ubiquiti AP UC-AC-LR (Satellite through SNMP)
Pandora FMS Ubiquiti AP UC-AC-LR Web Console
https://pandorafms.com/docs/index.php?title=Pandora:Documentation_es:Arquitectura#Servidor_Sat.C3.A9lite
Finally, and as a complementary tool, you can count on the possibility of having usage and consumption metrics in the cloud, from the “Discovery” option, or with add-ons from the Enterprise library.
Discovery Cloud View
At the time I wrote this article, the clouds supported by Pandora FMS were:
*It is possible that new cloud technologies will be added over time.
In the next tree view you can see some of the metrics that we have available for AWS and Azure. In this view, you can see the status of the virtual machines, the consumption of Network, Memory, etc.
All these parameters are configured according to the specific needs of each client.
https://pandorafms.com/docs/index.php?title=Pandora:Documentation_en:Discovery#Discovery_Cloud (Discovery Cloud Documentation)
Finally, Microsoft 365 cloud has an API to be able to monitor the health status of its services. Pandora FMS has a plugin in the Enterprise library that allows you to collect data from the Microsoft 365 API.
https://pandorafms.com/library/pandora-office-365-monitoring/
Partial View of Microsoft 365 Services
I hope this article was useful for you to understand what the best monitoring scenario for your company is.

by Dimas Pardo | Last updated Aug 27, 2021 | Community
You know what it is, but do you know SNMP protocol history?
There was a dark time, more than dark, sepia or beige, in short, that tone in which we find the photos of our grandparents inside the drawer of the oldest and worst decorated closet in our house. A time that is hardly talked about anymore, but that points us as a weapon so that we continue to keep it in our memories. Those were the times of bank robbers and speakers, old rolls, borsalino hats and cameras with lightbulbs, they smoked more, the police were still called “coppers” and toothpaste brands had not yet produced any flavored toothpaste, not even menthol. We go back that far to get to know more about SNMP protocol history.
In this house, Pandora FMS blog, we had already talked before about the relation of the SNMP protocol with the noir part of life. It was hard, few reported that case, but we got to the media, and they, from Newcastle Tribuna to the smallest local newspaper, have endlessly asked us to come back and delve into the subject. That is why we want to make a little review of SNMP protocol history, a story full of caramel nuances and fish bones, swimming pools on the outskirts and tombs in the desert, long and slender legs and hard knuckles like the piles of prelates or pontiffs.
Naaah, in fact, if we want to find out SNMP protocol history and its evolution throughout the years, we just have to go back a couple of decades, no more. In 1988, we started having some news for the first time about this famous protocol. The 80s, pal, a very hard time too, we don’t want to take away any of its prominence. Leg heaters, carded hair and Mustangs ruled. It was around this time that what we know as the first data networks began their journey. More and more “cooler” and more and more widespread around the world.
At that time, with an administrator it was enough for an “analog” or manual way to understand a whole network infrastructure of a company. You can guess the kind of network infrastructure that could exist in a company at that time… It was made up of scarce resources or equipment because the immeasurable variety of services that are provided today did not exist, nor users, nor anything similar.
It was not until more or less the arrival of the 2000s, time of Nokias with poly tones, the return of the bell bottoms and the consolidation of Britney Spears at the highest levels of the music scene charts, that computers, Big Daddy (Internet) and the rest of the technology reached the necessary parameters to accommodate things as far ahead of their time as the SNMP protocol.
The range of services and possibilities was that expanded thanks to convergent networks that we were finally able to handle all kinds of information and data, including voice and video. Infrastructures were expanded by force, and users began to flock like flies to honey. A failure in the system could no longer be accepted. The stakes were high.
That was the time for the proliferation of monitoring systems, yes, like Pandora FMS, owner and master of this blog and my skin. They were shown as essential gadgets for the tasks of technology departments of any company that wanted to stay safe from possible incidents and even anticipate them by detecting them in advance. Monitoring systems, servers, applications, networks, events and a long list of devices. Collecting information, just what we wanted to monitor, all to collect it and represent it visually, in order to carry out the necessary actions that our systems might require. What a monitoring progress!
Like coffee, a morning shower and the geek figures in the office, it is impossible to remove monitoring systems from the daily lives of network administrators, and most of these systems are based on the Simple Network Management Protocol, also known on the streets as the SNMP Protocol, which makes the exchange of management information between network devices easier and fills our lives with hope and management data.
And this is the thick and outrageous SNMP Protocol history. in fact, it has stayed with us for many years. From that first version to SNMPv3, so focused on security and administration… And for many years more old friend! I personally hope you see my grandchildren grow old and I see you get implemented in a crass, ineluctable and ad infinitum way!
Would you like to find out more about what Pandora FMS can offer you? Find out clicking here .
If you have to monitor more than 100 devices, you can also enjoy a FREE 30-day Pandora FMS Enterprise TRIAL. Installation in Cloud or On-Premise, you choose !! Get it here .
Last but not least, remember that if you have a reduced number of devices to monitor, you can use the Pandora FMS OpenSource version. Find more information here .
Do not hesitate to send us your questions. Pandora FMS team will be happy to help you!
And if you want to keep up with all our news and you like IT, releases and, of course, monitoring, we are waiting for you in our blog and in our different social networks, from Linkedin to Twitter through the unforgettable Facebook . We even have a YouTube channel , and with the best storytellers.
Some of the sources used for this article:
https://en.wikipedia.org/wiki/Simple_Network_Management_Protocol
https://coreun.com/2020/07/08/la-monitorizacion-protocolo-snmp-y-su-evolucio

by Guillermo Sánchez | Last updated Jun 10, 2021 | Tech
Do you know everything about Office 365 Monitoring?
Microsoft Office 365 Monitoring (Known as Office 365)
Pandora FMS is a proactive, advanced and flexible monitoring tool which is also easy-to-configure according to each business and their needs. It can be integrated into all the needs of servers, network computers and terminals. Besides, in a world where the cloud has taken more prominence, it can also monitor its services or computers.
In this article, we will focus on Office 365 monitoring from Pandora FMS using the module available in the Enterprise library.
https://pandorafms.com/library/pandora-office-365-monitoring/
What is Office 365?
Microsoft 365, also known as Office 365, is the tool conceived by the giant Microsoft that allows you to create, access and share documents online with different users in Word, Excel, PowerPoint and OneNote, among others. To that end, you only need to have access to the Internet and have OneDrive of course.
Microsoft 365 offers different packages, depending on the size of your company or the number of users who will make use of these services. In addition, users may choose between three types of packages: for private use, for businesses or for students or teachers. Each one has its own features (number of users, integrated programs, space…) and it is offered at different prices accordingly.
Microsoft 365 Health
Microsoft 365 provides a page to see the health of cloud services. You may take a look at the following url:
https://status.office365.com
You may observe the health status of the services in Microsoft 365
What we can see is that, on demand, we can find out in what state the services are, but by having Pandora FMS, we will be able to improve this overview and also have all of this information and generate alerts about the services that may be essential for the daily work or tasks of our company.
Microsoft 365 in Pandora FMS
In order to carry out Office 365 monitoring, what we need is to be able to see the services in our Pandora FMS WEB console, as exemplified in the following image:
To get that result, we are going to use the Enterprise library module . But first, let’s take a look at the requirements you need to meet to achieve our goal:
- In Pandora FMS Environment: The plugin server must be enabled, Python 3.8.
- In Microsoft 365: Read permissions are required for the o365 API.
- Know the following Authentication data: TenantID, ClientID, Secret
The plugin is designed to run as a server plugin but can be run on an agent using module_plugin with no issues at all.
Script Running
So that you can notice, very simply, how the script is executed, we are going to see an example of that, where we will execute its binary version with the following command:
pandora_o365 -c xxxxxxxx-xxxx-xxxx-xxxx-xxxxxxxxxxxx -t xxxxxxxx-xxxxx-xxxx-xxxxx-xxxxxxxxx -s xxxxxxxxxxxxxx~xxxxxxxxxx~xx~xxxxx
When executing the script, if the ClientIT, TenantID and Secret values are correct, we will get the following response:
Finding out the status of the services from Pandora FMS
We already have Microsoft 365 service agents, to finish up this idea let’s look at a service on Microsoft 365 health page and what it looks like in Pandora FMS.
Microsoft 365 Health Page:
We clearly see that there is a service degradation.
Health in Pandora FMS:
We check and verify that, indeed, we have the same information and that with these texts it is very easy to define alerts on the status of the different services.
Log collection
If we have Pandora FMS Syslog Server feature enabled, we can save all the issues that take place in Microsoft 365. For this, just add the parameter -l in the execution of pandora_o365 module -c xxxxxxxx-xxxx-xxxx-xxxx-xxxxxxxxxxxx -t xxxxxxxx-xxxxx-xxxx-xxxxx-xxxxxxxxx -s xxxxxxxxxxxxxx ~ xxxxxxxxxx ~ xx ~ xxxxx -l
That way you can save, very easily and with no issues at all, Microsoft 365 incidences in Pandora FMS.
That way, you may now proactively monitor all Microsoft 365 services. And we achieved our goal, Office 635 monitoring is ready to work!
Would you like to find out more about what Pandora FMS can offer you? Find out clicking here .
If you have to monitor more than 100 devices, you can also enjoy a FREE 30-day Pandora FMS Enterprise TRIAL. Installation in Cloud or On-Premise mode, you choose!! Get it here !
Last but not least, remember that if you have a reduced number of devices to monitor, you can use the Pandora FMS OpenSource version. Find more information here .
Do not hesitate to send us your questions. Pandora FMS team will be happy to help you!
And if you want to keep up with all our news and you like IT, releases and, of course, monitoring, we are waiting for you in our blog and in our different social media, from Linkedin to Twitter not forgetting of course Facebook . We even have a YouTube channel, and with the best storytellers.

by Dimas Pardo | Last updated Mar 26, 2021 | Community
What are Walking Meetings and how can they help us?
I hope you are not tired of “trend” terms, the neologisms that multiply everywhere and the upstart concepts that you can’t seem to memorize that well because they always sound like something else. I actually hope you are not, because here it comes another one, fresh from the oven. Take note, because as soon as you learn about it, as it usually happens, it will start mysteriously proliferating around your acquaintances. Today, in our alien-green Pandora FMS blog, we talk about what Walking Meetings are.
What are Walking Meetings?
Walking Meetings, *drum rolls*, are nothing more than work meetings while you walk. Yes, instead of sitting in an expensive and comfortable desk chair you take a stroll. Therefore, if you work remotely, we recommend you to have a pretty big living room, otherwise, it won’t work, we guarantee…
One of the excuses that surround the concept for its immediate implementation is that it helps us alleviate the sedentary lifestyle of today’s jobs. And it is true that we are all fed up with those pounds we seem to be gaining afterwork, a concept with which I hope you are familiar with, because it is one of the few that truly succeeds today and it is worth it. Although, as for me, I would continue to call it “things got out of hand and I ended up having a hard time the next day at the office.”
Walking Meetings or “Walking while you talk to your boss“, in addition to lowering the volume of your stomach, would help you relax, set you in a good mood and foster a positive environment. The bad thing is that if you are immersed in teleworking and you no longer have data on your business cell phone, your walk would be limited to the place where you still have Wi-Fi connection. That is why it is better to have a big living room.
As we already knew from the famous peripatetic school, walking while talking encourages creativity and reasoning. It is not surprising then that Aristotle strolled around the gardens bordering the temple of Apollo, along with his disciples, to teach them while they did some exercise to digest lunch better.
I know that maybe you are more of an oval noble wood table, blazer and tie, cards and Power Point, seriousness and silence person, while someone explains the new ideas that will no doubt relaunch the company. But things are evolving and what is trending now are Walking Meetings, something like walking the dog but with your work colleagues and while someone assigns, by Skype or in strict presence, the tasks of the week. Sorry, boomer, the elevator pitch is more popular than the static monologues of seniors of the company remembering better times, back in the old days. Dynamism and fluidity, relaxation and conversation, pedestrian exercise and rhythm, cardio and walking, project solutions and original answers. That is what prevails nowadays. And we welcome it with open arms. I have already bought my sneakers for that purpose!
But Walking Meetings already existed
As it is often the case with these types of newly coined concepts, Walking Meetings already existed. There we also have freeganism, for example. Which is basically, for those of you who may not know, “the collection of food that has previously been thrown away or discarded because its expiration date is near or past.” That was already in motion since garbage existed, however now it has a striking name, which some may consider unnecessary, and different nuances, ranging from hipsterism to anti-consumerism.
With Walking Meetings it is the same thing happening again, there were already conversations in the hallway on the way to the cafeteria or restroom, but they have finally become institutionalized and we now have a new excuse to wear shorts to work.
So what before could be a meal for those leading two different companies to reach an agreement of vital importance until way later after dinner, now they meet at the park to talk between gasps while keeping a light gallop. Of course, it is much better for strengthening the core, than the digestive gin tonics and a cigar after a good steak.
Possible benefits of Walking Meetings
For some causal reason, walking is better. Synapses proliferate, our neurons sparkle, everything seems clearer, and creativity arises, from ear to ear, with a rainbow glow. Stanford University does not have to come to tell us about its experiments with sedentary and athletic people, we all know that movement shakes our heads and favors creation.
Until we can eat popcorn without choking and pay attention to Netflix as we drive around with the porch, walking while working is the closest thing to doing something uplifting while exercising. You take a break from the screen for once, relax your burned corneas, and make other just as interesting muscles work.
- Ideal for dealing with complicated topics:
Being locked up, immobile and face to face with someone is not the healthiest way to deliver sensitive news. It is much better to enjoy the air, space, exercise to distress and see the landscape views. If things get ugly you can always accelerate until you leave your teammates behind.
Do you remember how good it felt when the teacher decided to teach the class outside because it was too good a day to be inside? Well, the same happiness and good vibes arouse Walking Meetings in the open air. Encouragement and positivism will flood us when we listen to something more than the photocopier in the background and we see something more than the gray facing of our cubicle.
I hope that with this information you can guess by yourself whether Walking Meeting instauration is worth it and you should give it a chance or whether you should just completely ignore them. Maybe you like them and they seem appropriate but with another name, something more simple and humble like “Meetings strolling” or the always cool “Marathon Meeting” or “Running Reunioning”.
But once you’ve gotten into these ins and outs, would you like to keep going? Go even further but into the world of technology? What about spending a couple of minutes to find out what computing system monitoring is and why it is also very important?
Monitoring systems are responsible for supervising technology (hardware, networks and communications, operating systems or applications, for example) in order to analyze its performance, and to detect and alert about possible errors. And this leads us to Pandora FMS, that wonderful tool thanks to which this blog is possible.
Pandora FMS<;/strong> is a flexible monitoring system, capable of monitoring devices, infrastructures, applications, services and business processes.
Would you like to find out more about what Pandora FMS can offer you? Find out clicking here .
If you have more than 100 devices to monitor, you can contact us through the following form: https://pandorafms.com/contact/
Do not hesitate to send us your questions. Pandora FMS team will be happy to help you!

by Dimas Pardo | Last updated Aug 27, 2021 | Community
Everything Has a Beginning: The Genesis of Tentacle Protocol
You probably know all kinds of remarkable “genesis”: the biblical and canonized, where Adam and Eve have their first Tinder date, the British rock band from the 60s with excellent Peter Gabriel on vocals and Phil Collins on drums, and of course, the Hyundai Genesis, a passenger car manufactured by the South Korean brand Hyundai Motor Company since 2008… But this time, none of them interests us. We’ll leave the trunk capacity of the Hyundai for another day, but not today, today, in our ominous and greenish Pandora FMS Blog, we will talk about an even more important genesis for the history of the beginnings and the startings (drum roll), the beginnings of Tentacle Protocol.
And to talk about the origins of Tentacle Protocol, we had to make an effort to find our colleague Ramón Novoa Suñer, Head of the AI department and Senior Chief Programmer at Pandora FMS, a hero for the company, who has been here for as many years as it exists and that, therefore, houses all the possible knowledge on the matter, right within its experienced and ancient testa.
To find Ramón, we had to undertake a dangerous journey, crossing the icy glacier and the burning desert, traveling day and night without rest, risking our life and our physique, crossing the most spectral swamps and mountain slopes, enduring merciless winds, to finally reach the medieval fortress where he was, always involved in his chores and completely oblivious to the admiration that the world professes him.
Proposing an interview with Ramón was easy, but it took time to carry it out, that’s why I stayed with him as an apprentice. I slept in the highest tower of the castle and devoted myself to absorbing all kinds of technological knowledge that got thrown on me to the ground like little bones. I didn’t want to waste a second spent with him. After all, he is one of the most recognized geniuses in his field. The Dumbledore of programming.
Weeks passed, then years, but finally the long-awaited interview about the origin of the Tentacle Protocol that I longed for and that led me there came. Now I want to share it with you on this blog, as I ride away from the fortress as the voice of Master Ramón still resounds in my head:
Oh Master, what year would you say it was when the Tentacle Protocol was invented?
* Hmm … 2008, if I’m not mistaken, because by now it’s already been a few years… I would say shortly after I finished my degree and started working at Ártica. It still seems to me that it was yesterday, and here we are, more than a decade and a pandemic later…
*Important remark: All of the answers that Ramón gives us, should resonate in your head with the deep voice of a wise hermit, if not, you’re not reading this the right way.
¿Where does that science fiction name come from?
I’m very glad that you asked me that question, little Dim. You see, the Pandora FMS logo at that time was an octopus, so the name seemed like the most appropriate, don’t you think so? It is also a tribute to a popular video game from the 90s. You don’t need me to give you more clues, right? Authentic and pure people, the ones who are really worth it, will know what video game I refer to.
Do you remember who was involved in the project from the beginning?
The idea of the project came from Sancho Lerena, the famous CEO, and I was the developer. Keep in mind that at that time there were only two programmers in Ártica ST. We still had absolutely no idea about the people who would join us in this dream.
From what did the idea of this protocol arise? What is its true origin?
Well, at the very beginning, Pandora FMS agents used SSH or FTP to send data to the server. But users had a lot of trouble configuring these protocols correctly. So we decided to develop a simple protocol that would work without no more additional initial configuration than that of the IP address and the port of Pandora FMS server. Helping and simplifying has always been the purpose of the Tentacle Protocol, and boy did it do well.
What exactly is the Tentacle Protocol?
It is a text protocol (like SMTP or HTTP) to transfer files. The specification is very simple, it is given in our Wiki, the most sacred group of texts that I know, it contains from the Alpha to the Omega of this organization. The Tentacle Protocol is less efficient than a binary protocol, but more readable and easier to debug. Giving it that magic that it has.
What is it for?
Basically send and receive files. The advantage it has, as I mentioned before, is that it is very easy to configure. You don’t even need to specify the destination directory. It also supports slightly more advanced features such as data compression or the use of X.509 certificates.
How important is it for Pandora FMS?
It is essential for transferring XML data files from agents and satellite servers to Pandora FMS server. It is also used to manage remote configuration, file collections, etc. Also, the Tentacle server can work as a proxy.
Is it true that in good hands and used in the right way it could save the world?
If the instructions to save it had to be sent through a TCP/IP stack, I have no doubt.
Let’s fantasize, if you could rename it now, what would you call it?
A) Metal Gear Solid Protocol: Solid Snake you are the boss.
B) Testicle Protocol
C) Tenta-cool protocol
D) Protocol A Feira
E) “Octopus” too, in reference to Doctor Octopus as well.
And that was it for my story of how I managed to find Ramón Novoa at the end of the world and have him explain everything about the genesis of the Tentacle Protocol. I will never forget his hospitality, his erudition, or how the monk’s habit that I wore throughout the training in technological knowledge, there in the tower, was constantly killing my waist.
by Dimas Pardo | Last updated Aug 27, 2021 | Community
Pandora FMS is proclaimed the winner of Peer Awards in its modality
How good it is to welcome you to our blog with such great news. Come in, come in and read, don’t all corner yourself at the back, there is also room in front here. I guess by now you already know IT Central Station, a more than respected platform in its field and where you can find ratings, reviews, features, prices and performance evaluations on cybersecurity, DevOps, IT and other technological products. Experts from all kinds of companies come to this platform to compare which is the best product on the market to get hold of it. Well, we are in luck, the platform has announced this year’s winners of the recognized Peer Awards 2021, which already cover 60 categories no less, and Pandora FMS, yes, is among them!
The Peer Awards, instituted by IT Central Station, classify the best technology products in the world based on trustworthy user reviews always reviewed by the biggest connoisseurs in the world.
To grant the award, IT Central Station is based on an annual average given by its ranking algorithm. The total classification of a product is based on a score and the score is calculated through each of the portal reviews, views or comparisons of the product.
Reviews older than 24 months, as well as those written by resellers, are completely excluded from the ranking algorithm and all products with more than 50 points are designated as leaders in their category.
Finally, Pandora FMS has managed to win the award and it has been, as we can see, thanks to all the followers, users, clients and colleagues of Pandora FMS who have given us a positive evaluation or a favorable review in IT Central Station. Thanks to them, we can boast about this badge and trophy we have been awarded with, in addition to the pleasure of being always and at the top of their lists, finally for all those who need us to be able to find us.
Some reviews that we keep in our hearts
To honor our fans and even to encourage you to join this select club and leave us a review or assessment, we show you some of their examples, which have taken us to the top this year. Thanks again to all of them.
Alexandre Pérez Jorge:
“Single-Point Continuous Supervision Makes It Efficient For Detecting And Solving Problems
My primary use case is the daily monitoring of all the network traffic for my bank client. With it, I supervise and monitor more than one hundred nodes and servers of all kinds, such as print servers, file servers, etc. From Pandora, I can have everything controlled and under continuous supervision. I supervise maintenance and optimization of the network infrastructure from Pandora. When we want to monitor a new server or a new machine installed in the pandora network, it detects it automatically and we already have it monitored. It is very easy and practical to work with this tool and is very…” Para leer más sigue este link >>
JaJavi:
“Saves Costs Related To Monitoring My Camera And Alarm Network
I used this solution to monitor and control a network of jewelry stores. I use AI for the prevention and prediction of future problems in my company, especially in certain points that I could not control before, such as cameras and alarms.
What other advice do I have?
This is the best solution if you don’t want to get in trouble. Their project department has helped me at all times by adapting the software to the needs of my business. Even in the last implementation of the program, they have included a functionality that I asked for myself. Until very recently they didn’t have good multi-tenancy monitoring, but they’re moving fast and they’ve fixed it. Try the free version first, and later you will want the paid version.” Para leer más sigue este link >>
M. Ángel:
“Good Network Visibility, Easy To Use, And Has Good Documentation
What is our primary use case?
We use it for “remote desktop” via eHorus (integrated into console Pandora FMS), to check connectivity, for database status, and disk drive free space capacity. This solution is very useful for keeping track of «Let’s Encrypt» certificates (expiration) for our web blog and its uptime.” Para leer más sigue este link >>
What do they say about our prices?
IT Central Station also has room for opinions that are straight to the point, those that speak openly about our prices, a topic that usually interests, for whatever reason, people a lot. Here you have some of these opinions.
“My rule of thumb would be that if you need more than thirty agents, and you lack an automation tool such as Chef or Puppet, you will save a lot of time and money going to the Enterprise edition.”
“Growing the solution or migrating to the Enterprise version is easy, and various plans are available.”
“In terms of money, the Enterprise version is the cheapest that I have found after a market study.”
“Pandora FMS is easy to implement and the pricing of licenses is competitive.”
Thank you all
We want to reiterate our thanks to all our followers and users for this award. Also to the workers and collaborators of Pandora FMS, and to you, reader of this blog and fan of our tireless social networks. Without all of you, we would not have been able to win this Peer Award for our monitoring service that we are going to boast about ad infinitum.
If you also want to leave a review or assessment about Pandora FMS in IT Central Station, here you have the link to do so, and we will send you a hug in advance. We have won this award together!
Would you like to find out more about what Pandora FMS can offer you? Find out clicking here .
If you have to monitor more than 100 devices, you can also enjoy a FREE 30-day Pandora FMS Enterprise TRIAL. Installation in Cloud or On-Premise mode, you choose!! Get it here !
Last but not least, remember that if you have a reduced number of devices to monitor, you can use the Pandora FMS OpenSource version. Find more information here .
Do not hesitate to send us your questions. Pandora FMS team will be happy to help you!
And if you want to keep up with all our news and you like IT, releases and, of course, monitoring, we are waiting for you in our blog and in our different social media, from Linkedin to Twitter not forgetting of course Facebook . We even have a YouTube channel, and with the best storytellers.

by Jimmy Olano | Last updated Aug 11, 2023 | Integrations
Pandora FMS means flexibility to work with third party applications.
There are more than eight hundred pages of documentation for Pandora FMS. The science – and art, I think – of monitoring is very extensive. The needs of a large company are different from those of a medium or small organization. But even two large companies are not the same and their needs may be totally different. Today we will discuss BMC Remedyforce plugin, an Enterprise integration in Pandora FMS, but to understand the present, it is always good advice to take a look (no more) in the rear view mirror.
However, we are going to stay in the present century. For those who still do not know or have no notion, Pandora FMS Enterprise gets along with two great tools: Pandora RC and Pandora ITSM.
Pandora RC allows remote connection and inventory in a simple way, by itself and without Pandora FMS. I recommend it as an introduction to monitoring, as it presents basic but important options. Together with Pandora FMS, it is when the whole being more than the sum of the parts is fulfilled.
In the case of Pandora ITSM, we are already talking about a robust product for handling issues, but wait because there’s more. With Pandora ITSM you can create a knowledge base and turn the experience of employees, users and/or customers (each company decides how far to go) into inheritance for future personnel who start working. To be more specific, I am talking about the Human Readable Knowledge Base.
And of course, it can be integrated with Pandora FMS… and with many other software products.
What does all this have to do with BMC Remedyforce? We’ll see.
Interoperability
Interoperability is known as the ability of two or more systems or components to exchange information and use the information exchanged. Like any theoretical concept, it is easier said than done.
For instance, a “plain text file” is only really plain if it contains only 7-bit characters according to American Standard Code for Information Interchange… better known as ASCII, does this last one ring a bell? We will see later why it is important, but for now, let’s say yes, we skip books and documents, hundreds of them, and assume that all programmers have already agreed that sharing and speaking under certain conditions is a must… Let’s delve deeper and see what an API is.
Application Programming Interface (API)
Let’s put into practice what a Knowledge Base is: in this blog we have published excellent articles and in 2019 one of my colleagues wrote a very good one about it. There you will also have an introduction to Pandora FMS API. Read, have coffee and come back, this is going to get good with a specific technology that Linus Torvalds absolutely hates…
Extensible Markup Language (XML)
“[XML] is probably the worst format ever designed… It doesn’t really scale as a file format, and overall it’s a complete mess.”.
Linus Torvalds, March 6, 2014.
We already know about the enfant terrible personality from the creator of the Linux kernel and it has been several years since he expressed his opinion about XML (and hopefully he changed his mind).
XML is a markup language for encoding documents, developed by W3C as a subset of the Standard Generalized Markup Language (SGML). Although it was conceived to be easily readable by both machines and people, as we see, some do not find it that way. Earlier I spoke of “plain text” and here this takes on special importance: XML includes mechanisms to specify the encoding of UNICODE characters, and UTF-8 is generally used for this.
I tell you that the “secret” to dealing with XML is to program with libraries that take care of it; we will seldom have to see or read its content. In Pandora FMS, there is the format used to communicate with the Tentacle protocol between the different components; the Software Agents, more than anything else, originate lots of material.
The important thing about XML is that it allows you to add more information than that you had previously agreed, that is, it can be easily extended. But do not mistake freedom with debauchery: XML contemplates Document Type Definition (XML DTD) which is a pattern that each sent message must meet, there should be no excess or lack of information. That is why within the protocol that you make you must include messages precisely to notify of new XML DTDs and from when they will be implemented, among other aspects. So let’s go up one more step in knowledge: SOAP.
Simple Object Access Protocol (SOAP)
SOAP arises from the need to base communication between different systems regardless of their operating system or platform. Yes, you guessed it, it uses XML for sending data and information and is currently recommended by the WWW Consortium or World Wide Web Consortium (W3C). Like XML, SOAP can be extended easily and until today it has established extensions, some are:
WS-Addressing.
WS-Atomic Transaction.
WS-Coordination.
WS-Federation.
WS-Policy.
WS-Reliable Messaging.
WS-Remote Portlets.
WS-Security.
SOAP is used by many APIs, like it is the case of BMC Remedyforce, but it is not mandatory at all. Pandora FMS has its own public protocol that is transmitted by HTTPS (recommended) and many SOAPs also use HTTP as transport, although this is not mandatory at all. SOAP is even used over email, and there are many more aspects. For simplicity I just add that a SOAP message must contain an envelope (mandatory), a header(optional), a body and a fault section for error handling .
This is more than enough to present the BMC Remedyforce plugin, an integration with Pandora FMS.
BMC Remedyforce plugin
As discussed at the beginning of this article, BMC Remedyforce also handles incidences for tickets and Pandora FMS for its flexible alert system can communicate through SOAP (in Perl language) with BMC Remedyforce. You can even go further and receive answers but you better make it simple.
I must emphasize that what has to do with the Enterprise version is the BMC Remedyforce connector, not the feature itself. For this reason, do not take the example procedure at face value, or write in the comments that I made this or that mistake (don’t miss the opportunity of sending questions or suggestions, even greetings are welcomed). Of course, it serves as an example for alert creation and management in Pandora FMS.
First, I remind you that recently Pandora FMS created a new download page and it has also simplified its Cloud installation. Try it, and if you want more you can get a free demo for 30 days and thus have access to many professional plugins from the Enterprise version.
“New Licenses in Pandora FMS. Pandora FMS LITE ”
Preliminary for BMC Remedyforce
A manifest based on Web Services Description Language or simply WSDL must be generated by BMC Remedyforce. This element allows us to know the commands and features of the SOAP that will be used. I personally assimilate it as an XML DTD, not as a strict normative but as informative.
From Pandora FMS libraries you can download the connector and the according documentation. Once unzipped and installed, you can, along with your user credentials and the XML-generated WSDL, manage the infrastructure objects used in BMC Remedyforce.
Alerts in Pandora FMS
First create an alert command and it will be configured as follows:
The complete instructions are (usually) in Pandora FMS documentation, with all details.
The next step is to create an alert action. Actions are the components of the alerts in which a command is related to the generic variables, for the example in BMC Remedyforce, they are the first six fields. Actions allow defining how to launch the command.
Once the command and action have been defined, it can be used in any alert for Pandora FMS to send and start a ticket in BMC Remedyforce.
All you have left is for events to take place and trigger an alarm which sends an incidence record to the BMC Remedyforce plugin. At this point, it is time to contact your BMC Remedyforce staff members. These staff, in addition to the Home tab in BMC Remedyforce by default, have the Remedyforce Console tab. This tab shows the information about Incidences where Pandora FMS requests should arrive.
Before finishing, remember Pandora FMS is a flexible monitoring software, capable of monitoring devices, infrastructures, applications, services and business processes.
Would you like to find out more about what Pandora FMS can offer you? Find out clicking here: https://pandorafms.com
If you have more than 100 devices to monitor, you may contact us through the form: https://pandorafms.com/contact/
Also, remember that if your monitoring needs are more limited, you have Pandora FMS OpenSource version available. Learn more information here: https://pandorafms.org/
Do not hesitate to send us your questions. Pandora FMS team will be happy to help you!

by Rafael Ameijeiras | Last updated May 6, 2025 | Tech
In the IT world, basic monitoring is an essential practice for overseeing servers, networks, and applications. Whether through logs, custom scripts, or specialized tools like Pandora FMS, it provides an overview of the infrastructure‘s health and helps detect performance or availability issues.
However, having all indicators in green does not always mean everything is working perfectly. Sometimes, end users still report issues: a website that takes too long to load, a transaction that does not complete, or processes that intermittently fail. Even worse, if these problems affect key transactions, they could lead to financial losses or user frustration.
Waiting for users to detect and report failures is not an option. This is where transactional synthetic monitoring comes into play, a proactive solution that simulates user behavior and detects issues before they take place.
What is transactional synthetic monitoring?
Transactional synthetic monitoring is a technique that simulates user interaction with an application or digital service using predefined scripts. Its main advantage is that it allows you to detect issues without the need for real users interacting with the system.
This approach allows for:
- Simulating key transactions such as logins, purchases, payments, or information searches.
- Detecting availability and performance issues before they impact end users.
- Testing specific scenarios such as high traffic loads or failures in external components.
- Automating tests in different environments, suppressing the need for real users to validate the system’s functionality.
Thanks to synthetic monitoring, companies can ensure that their digital services work properly, even before users interact with them.
Why traditional monitoring is not enough?
Conventional monitoring oversees the status of networks, servers and applications, but it does not always reflect what end users experience. Some situations where synthetic monitoring is crucial include:
- All indicators are green, but users experience issues: A server may be operational, but a webpage may not load properly.
- Errors that only appear under certain conditions: For example, a payment failure that only takes place when users select a specific currency.
- Difficulty in identifying bottlenecks in critical transactions: Without active simulations, it is hard to pinpoint which part of the process affects conversion or user satisfaction.
Differences Between UX and WUX in Pandora FMS
Pandora FMS allows for the implementation of synthetic monitoring in two specialized environments:
- WUX (Web User Experience): It simulates web transactions using Selenium, allowing for the evaluation of load times, availability, and errors across different browsers.
- UX (User Experience): It simulates interactions in Windows desktop applications, validating execution times, stability, and potential failures.
Both solutions generate detailed reports, real-time alerts, and screenshots in the event of failures, providing a comprehensive view of the performance of digital services.
Key Advantages of Synthetic Monitoring
Implementing a synthetic monitoring strategy offers multiple advantages:
- Early detection of failures: It identifies issues before they impact end users.
- Performance optimization: It improves the digital experience and reduces load times.
- Automation of regression testing: It ensures that new software versions do not add failures.
- Reduced support costs: By detecting errors before users report them, incidents are minimized.
- Evaluation under different conditions: It allows testing scenarios with varying traffic loads and geographic locations.
- Integration with observability: It complements traditional monitoring tools, providing a more comprehensive view.
How Synthetic Monitoring Works in Pandora FMS?
Pandora FMS allows you to configure a synthetic monitoring environment with the following steps:
- Transaction Recording: The user’s navigation or interaction is recorded using Selenium IDE, capturing every step of the process.
- Configuration in Pandora FMS: The recording is integrated into WUX or UX, setting up the monitoring criteria.
- Automated Execution: Transactions are executed periodically to detect potential failures.
- Result Analysis: Detailed reports are generated with performance metrics, response times, and detected errors.
- Real-time Alerts: If a failure is detected in a critical transaction, Pandora FMS immediately notifies to make intervention possible.
Advanced Synthetic Monitoring with Pandora FMS
Pandora FMS offers a set of advanced tools for synthetic monitoring, enabling proactive supervision of the performance and availability of digital services.
- Web and Desktop Monitoring: Support for web transactions with WUX and execution of tests on desktop applications with UX.
- Automation with Selenium 4: Integration with Selenium for simulating scenarios across multiple browsers.
- Distributed Execution with Docker: Ability to deploy scalable testing environments through containers.
- Transaction Segmentation: It allows analyzing the performance of each stage of a transaction individually.
- Testing from Multiple Locations: Simulate traffic from different regions to evaluate global latency and availability.
- Smart Alerts: Real-time notifications for incidents within a transaction flow.
- Advanced Analysis and Reporting: Capture of key performance metrics, visual dashboards, and export of detailed reports.
Thanks to these capabilities, Pandora FMS enables businesses to maintain full control over the digital experience, reducing the impact of potential failures and optimizing operational efficiency.
Conclusion
Transactional synthetic monitoring is a key tool for ensuring a high-quality digital experience. With Pandora FMS, businesses can anticipate issues, improve the performance of their applications, and optimize user satisfaction.
Want to try synthetic monitoring in your infrastructure?
Discover how Pandora FMS can help. Start for free now.

by Dimas Pardo | Last updated Aug 27, 2021 | Community
History of monitoring: find out its controversial origin
Close your eyes and breathe slowly, can you already feel the coolness on the tips of your boots? On the tense phalanges of your hands? The first step is right in front of you. It is a spiral staircase armed with worn ashlars under old voussoirs. The dim light of a chandelier accompanies you. What are you waiting for? Go up! The forbidden book awaits you in the last of the stays, where you will finally find out something about the history of monitoring.
Once in the room, the cobwebs removed and with your medieval sword parked in a corner as if it were a broom, you decide to go to the sacred lectern, made of noble wood, which crowns the annex to the chapel. The codex has heavy covers and hard nerves, and in gold letters it says: The history of monitoring.
That’s when you lick your finger to turn the pages and start with the story without fear of being interrupted by anyone:
“Let’s see, let’s see, History of monitoring, well, as such, I don’t know if there will be”, the book begins.
“Well, that is a good start”, you say to yourself and keep reading.
“Let’s see, let’s see, History of monitoring, well, as such, I don’t know if there will be, but let’s go back to some possible origins. Nothing related to Palaeolithic or from the Restoration, for there to be computer monitoring, computers must exist, and I can already tell you that although a pelican served as an efficient and modern concrete mixer, computers did not arrive until much later.
“We want to focus within this codex, which already came out with yellowed sheets by default, on an idea: Think that the first computers, since Alan Turing were huge hulks that filled rooms and there was always a guy there overwatching that they would work well. That man who lived alone, keeping an eye on pilots and cables in those mouse traps where only he, his lunch and the huge computer fit, that was the first existing monitoring. That is, a discreet guy, perhaps affiliated to some football team, checking that everything went well. That was the first monitoring system. Pure history of monitoring anddd his name was Arthur Bernard.”
“Arthur Bernard?!” you will ask, exalted.
“Well, we actually have no idea what he was called. But we are going to say it was Arthur Bernard to not reify it with a number. But let’s continue with our pilgrim story, dear reader. We suppose, and it is not much to suppose, that, with time and innovations, someone called Arthur Bernard to his office, you know, a guy in a tie, already an expert in the field, and told him ‘Get out of here Ar, I know that it has been many years of service and of monitoring the mercury thermometers of each computer, but we have already managed to read these automatically and present the data on the computer itself, we do not need you, grab your surveillance stool and your lunch and go’.
“Arthur Bernard cried day and night during the first week, earning the hatred of his neighbors, landlady, dogs, wife and children. In fact, those who could, packed their belongings in a bundle and took off. His wife first. She had no respect for crying people. That is why she also left one of the boys with Arthur Bernard.
“Once recovered and rehydrated, Arthur Bernard reconsidered, the first monitoring was no more than custom scripts for each situation. In fact, that was the foundation of companies like Nagios, one of the longest-running monitoring companies. Arthur Bernard saw the light and set up his own monitoring business with his motherless daughter, Galthwey, as a consultant. Both devoted themselves to standardizing the use of those scripts we are talking about, so that they could be centrally executed. It was no longer a single computer, wide in size, there were ten or a hundred, it is true that you could no longer hire a guy, no matter how nice and professional he was, to look at each damn screen of each damn computer. The thing was to collect the information and centralize it on a single screen, a very big and cool one. Flat, if possible. So yes, a single guy, nice and professional, could have visibility of thousands of devices at the same time in a single point.
“And not only that, the Bernards team decided to go further, moving on now to the history of monitoring. They optimized an idea called ‘Alerts by thresholds’, a key piece of how network monitoring is understood today. After that, fame, recognition, and fortune came pouring in. In fact, they wanted to reinstate Arthur Bernard to his old company, from which he was cruelly fired and he said no. What’s more, his old wife wanted to get together with him again and reunite the children, and she told him that the children would reunite but that he no longer returned with her or the dog, that always ended up biting his socks. And the neighbors and the landlady also came in line but he told them no. Now he and his children, all the Bernards, were on their own in this new conquest of the world of technology.”
Once the book is slammed shut, and after the ejected and suspended dust has settled down again on the covers, you are glad to have been part of this new adventure and to finally know that that first company that Arthur Bernard created with his baby was called Pandora FMS, the legend that is already part of the history of monitoring.
Once you’ve read all this and more, we may seem unfathomable, but don’t get scared, take your little paper boat and explore all Pandora FMS features you want with a completely free and functional trial for 30 days . You will surely stay with us!
And if you want to keep up with all our news and you like IT, releases and, of course, monitoring, we are waiting for you in this our blog and in our different social networks, from Linkedin to Twitter not forgetting Facebook of course. We even have a YouTube channel with the best storytellers.

by Pandora FMS team | Last updated Sep 1, 2021 | Features
We check out some of the best Pandora FMS news in 2020
Today we are here to make a small compilation of the new Pandora FMS features launched throughout this last year 2020, a general review of all the small advances that we incorporated and that will be useful when you are at the controls of our software.
Mainly we are going to deal with new features but also great improvements in quality of use that we added to Pandora FMS throughout 2020. To begin with, as features, for example, we added an integration with Google cloud, Inventory Alerts, PEN-based module templates…
And as improvements in existing features, we will discuss some of them like: dashboards, visual consoles and remote module wizard improvements and enhancements. We also added a Discovery task result view, improvements in alert correlation, dynamic services… among others.
USER EXPERIENCE
The first thing we are going to look at is the different improvements in user experience. Pandora FMS compatibility with Selenium has been updated. Right now we are using Selenium version 3 (before, we used version 2), and this allows you to carry out much more complex and detailed user experience monitoring. An interesting new thing about this Selenium version and this update is that right now you can do conditional monitoring, that is, if you don’t find something on the corresponding page, you can look for something else and execute another action. You may also use data on screen as process variables, something quite useful.
DASHBOARDS
These have been painstakingly improved and now look much better than they did. But they have not only been visually enhanced; the process to configure them has also changed. You no longer have a display view and a modifying view, but now you have a button to switch between read mode and edit mode. We also switched to a much more precise grid adjustment, which now makes it much faster to modify the elements. The option to see new widgets has also been revitalized with the search engine. This is a much better option than going through all the pages looking for what you want.
VISUAL CONSOLES
In a similar way to this dashboard improvement we just mentioned, visual consoles have also been improved. The same format has been followed for them, with a simple button that allows you to access the editing mode. The item view has also been modified. Now it is more dynamic and easier to use. Interesting functions have been added to the map view with new correlations between its maps.
One of these new functions is the element cache, a function that now seems indispensable to us. To give you an example, before, when you entered a dashboard, basically all the information was reset every time the page was refreshed, but now, with this cache, you can prevent elements that you do not want to be refreshed so often (for instance, an icon representing a module that only runs once a day) from doing it. This improves the performance of visual consoles substantially, which is always appreciated of course.
SMART SERVICES
We already know the “services” as they are when using Pandora FMS, and we know that they are hierarchical structures that show the status of a specific service with several elements, such as different servers that are part of a cluster, or even Pandora FMS database, server and console… Previously you had to configure these elements manually, configuring the modules, agents and the weight that each one has in the global structure. Now they have been endowed with a certain intelligence and dynamism that streamlines the process and frees you from all that work, since in the smart mode, among other things, weights are loaded automatically.
IMPROVEMENTS ON DISCOVERY
In Discovery, several features have been renewed and added. If we start with what was already there and it has simply been improved, the recognition tasks themselves should be highlighted. Several options have been revamped and added, from which Auto Discover Known Hardware and Review Results are the most significant.
Thanks to Auto Discover Known Hardware, when you launch a recognition task with SNMP enabled, you can automatically detect which device brand you are looking at. This is based on Private Enterprise Numbers, SNMP identifiers of each brand, for which you can generate module templates in the Module Templates section. One more way to automate remote device monitoring.
Review Results is another pretty cool feature. Has it ever happened to you that you prepared a recognition task, and without realizing it, you set a huge network? It is possible that the license you have does not support such a high number of devices and you get an error in the console. Well, with Review Results, one of the things we avoid is that kind of situation. Taking advantage of the fact that we applied this improvement, we also modified the way Pandora FMS console manages the information coming from recognition, so that you can choose which elements have to be generated and which elements must be discarded before they are even created in Pandora FMS.
Support for more applications has also been added to Discovery. For instance, DB2 from IBM, which works and is configured quite similarly to Oracle, with quite similar options: username, password, servers, port, database you want to access…
In the Cloud section, we added Google Cloud Platform. Now you have to manage the credentials at Google level. You must enable database encryption and then generate a service user in Google Cloud, which will allow you to download a JSON. With this JSON you will create the authentication account in Pandora FMS. Once this is done, go back to Discovery and use the new credentials to access Google. Choose the monitoring you want, and after waiting a little for it to be processed, it will generate some agents: the main Google Cloud agent, one for each zone where you have machines, and another agent for each virtual machine.
NEW WIZARDS
The new wizards for SNMP and WMI are similar to the ones YOU used before, but now they are much more customizable. Compared to the two boxes you had with the agent and module, now you have a much more complete wizard, in which you may indicate the name of the modules that are going to be generated, the description, the thresholds… you may even add monitoring filtering by interface name, using the search engine.
INVENTORY ALERTS
Inventory alerts have been added to configure alerts when something that should be in a machine is missing, when there is something that should not be there or simply when you find something that you want to be alerted about.
EVENT CORRELATION
Event alerts also improved in 2020. The event correlation editor interface was updated, so that now you may configure all conditions for an alert in the same section, without the need to generate separate conditions. Now you can also map events with log information in elasticsearch.

by Dimas Pardo | Last updated Mar 8, 2024 | Geek culture
The final list to know them all
“Pen drive”, “memory stick”, for those less attentive: “VHS”… We have given many names to what we actually meant by USB. But you have to know that the term goes a little beyond that gadget of four or eight gigabytes that we use for so many things. In fact, there are several USB types, and today we will delve into getting to know them.
USB Types: What is a USB?
First we should make clear that, as many suspected but few dared to inquire, the acronym USB is derived from the corresponding words: Universal Serial Bus. USB is a connection protocol that allows us to connect several peripheral devices to an electronic device to achieve an exchange of data. It can also be useful to carry out some operations or charge the battery of our devices. It is, then, like a port that works as a connection socket between different devices.
The range of devices that we can interconnect to a computer thanks to USB is quite wide. We just have to think a bit so that they all come to our heads immediately. Mouses, keyboards, video and photo cameras, smartphones, USB memories, music players, webcams, speakers, printers, recorders, external hard drives, PDA… There are countless examples.
We owe this protocol to the fruitful 1990s, a wonderful decade for Britpop and for technology. It was seven large technology corporations (Intel, IBM, Northern Telecom, Compaq, Microsoft, NEC and Digital Equipment Corporation) who joined hands to reach an agreement on the peripheral connection standard for a computer. The idea was good for everyone, and although they started with a first model, USB 1.0, different from the current ones, everything was just a matter of evolution.
Standards
USB devices are classified into four types based on their data transfer speed: Low Speed (1.0), Full Speed (1.1), High Speed (2.0) and Super High Speed (3.0).
- USB 1.0. It was the one that appeared in the mid-nineties. The maximum speed at which information could be transferred was 1.5 Mbps. Well, it could be used for connecting devices like the mouse and keyboard for example.
- USB 1.1. The transfer rate increased to 12 Mbps.
- USB 2.0. It is undoubtedly the most widespread standard and sends data at a speed of 480 Mbps, although its actual rate is 280 Mbps. In the cable you may find four lines: two for data transfer and two for power.
- USB 3.0. We can consider it about ten times faster than 2.0. It reaches speeds of 4.8 Gbps. The best thing is that it is still compatible with the previous ones and on top of that, it includes five additional contacts. At present, it coexists with 2.0. in perfect harmony.
- USB 3.1 It is the last of the standards. In fact it emerged just a few years ago. It reaches a data transfer speed of 10 Gbps. As an incentive, it comes with a new type of connector, connector C.
Types of connectors
Now we go to the shapes of USB, which is why we are more familiar with them.
Type A. It is the one that most users will recognize. That flattened rectangle in which we can see internal connections. The male connector is at the end of the cables, while the female is the port itself.
Type B. The ports and connectors belonging to this type are just as recognizable by users, but somewhat smaller and wider than those of type A. As a general rule, we can find them in devices such as printers.
Type C. The Type-C connector has appeared the same as USB 3.1 and the distinguishing feature is that it is reversible. That’s right, no matter which side you insert, it works both ways.
MiniUSB. You may find two different versions of this one, made by 5 or 8 pins. We can see them in cameras, external hard drives, music players and a few other trinkets.
MicroUSB. The microUSB is the smallest and thinnest of all. It is quite flat and was conceived to connect to our smartphones. With them we can transfer information and charge batteries, so we also know it very well.
Mistaking them with USB Memory
As we have seen, the concept of USB refers to the connection port. However, the term “USB” has also been extended to refer to pen drives. Pen drives are enabled with a memory that works as a place for storing and transporting data. It’s the rightful replacement for floppy disks and CDs (who doesn’t have one, for God’s sake?!), with different capacities ranging from 1GB to 1TB. Simply because the pen drive connects through USB, they have ended up calling it that. To shorten it. We are that practical and love saving that much.
Once you just got into the technological ins and outs, are you hungry for more? Would you like to go even further in the world of technology? What about spending a couple of minutes to find out what computing system monitoring is and why it is also very important?
Monitoring systems are responsible for supervising technology (hardware, networks and communications, operating systems or applications, for example) in order to analyze its performance, and to detect and alert about possible errors. And this leads us to Pandora FMS, that wonderful tool thanks to which this blog is possible.
Pandora FMS is a flexible monitoring system, capable of monitoring devices, infrastructures, applications, services and business processes.
Would you like to find out more about what Pandora FMS can offer you? If you have more than 100 devices to monitor, contact us through the following
form:
https://pandorafms.com/contact/
Do not hesitate to send us your questions. Pandora FMS team will be happy to assist you!

by Dimas Pardo | Last updated Aug 27, 2021 | Community
Internet safe browsing; how our experts do it
Since the “Get it on!” (an instructive old spot on prophylactics) we have never been so aware of safety. It seems like an exaggeration, like a freakout attack I just suffered this morning, for abusing machine coffee, but no. Safety is more important than ever, especially if we refer to the topic of safe browsing on the Internet.
My pulse trembles, like you, like everyone else, when fearful of God and of my Catholic ancestors who are, I suppose in Heaven, I open the incognito window in my browser and I believe myself free and exonerated of all weight to set myself to scrutinize page x. For some reason incognito mode, to me, is like being invisible in a lingerie store or falling asleep at McDonalds’ ball playground and waking up when everyone is gone, leaving you free to play as much as you want. However, lately, I’ve been fraught with doubts, and, of course, the least thing you want when you are in “incognito mode” is to be nervous or hesitant about something. So I started wondering about safe browsing through the wasteland of the Internet. I needed to ask someone, someone who knew more than I did about safe browsing and possibilities beyond incognito mode.
So for that reason, we are going to talk today in our beloved and green blog, about safe Internet browsing. Not for anything else. Just to solve my doubts, and, incidentally, yours. And for this I have seen fit to request help from my dear colleagues at Pandora FMS, the technical guys, they know everything and today they are going to give us the secrets that they use for that, to immerse themselves in the network and not get scared and with several hives between their toes or on both sides of the groin, if you will allow me the metaphorical analogy.
What are the keys or tips for safe Internet browsing?
Manuel Montes, Q/A tester
For me, there are three essential aspects for safe browsing. Take note, I don’t see you taking note and it seems like you need it:
- Common sense. Parents and teachers instill common sense in each one of us from childhood. Look for it.
- Do not get into “weird” places, please. And you know when you have a “weird” place in front of you on the screen. Don’t go in!
- And pray, a lot and daily, because if they messed it up with SolarWinds imagine a normal user like you.
Since you’re here, take a look at this comparison between these two great monitoring titans. Guess what, we came out winning!
Alberto Sánchez, Systems Technician
I focus on pure navigation. If, for example, someone sends me a link directly, I check whether it is a really an HTTPS page, and if not, I look for it directly in Google, that, in certain cases, bans unsafe results. This is Google, watching over us and our money always. How can someone use another browser?
Mario Pulido, Head of systems
What you should do is use private browsing whenever possible so that later on you do not receive ads from your searches on any page you visit. Then you can also use all the pages with secure connections (https). Having a good antivirus with its browser extension activated to filter potentially dangerous websites is also very good. Not saving passwords in browsers with a logged-in session other than your account and separate personal and professional browser sessions. Having different passwords, or at least partially different, in each account you use, so that in the event that any of those accounts are hacked, they will not have access to the rest of the applications connected to it.
All that is what comes to mind and what I always follow by the book, for safe browsing.
Kevin Rojas, Project Consultant.
Let’s see, the first thing you have to do and that is not so difficult is to read well and look at the windows that open by themselves, orp pop-ups. Like when they do it in an abandoned house, they are often suspicious.
By all means, do not enter “suspicious” pages or as Manu said, “weird”, and less if the own navigator tells you to not enter. Please do what your navigator says, for the love of God.
I’ll give you an example, Dim:
One day you’re doing your things, “navigating through the Internet”, and you enter a page, and, suddenly, you see a window asking to “allow notifications”, what do you have to do? Well, always click NO, and if it is a page that forces you to click yes, it is not a reliable page, leave at once.
Read before accepting WHATEVER and check out very well the pages that open (by themselves or not).
Enrique Jesús Martín García, IT Project Consultant
The key and evident thing is common sense, like with anything. Try to avoid or at least be cautious with pages that request you to enter your data or grant storing permissions to files and similar things.
It is also VERY necessary to have an antivirus capable of blocking malicious and ominous pages, and access only safe pages (the padlock icon that appears in browsers), so that communication is encrypted.
Eduardo Corral, Project Technician
Dude, Dim, I tend to browse sites that I know. If I have to access unknown websites or those that I don’t trust a lot, I usually entrust myself to the antivirus. Sometimes I make the leap of faith, like in Assassin’s Creed, and I get into some non-recommended place, but I never give personal information and I usually try not to click on links that I don’t know for sure what they are. Those two points are key.

by Dimas Pardo | Last updated Sep 11, 2023 | Cloud & Virtualization
Pandora FMS launches Cloud installation and new download website.
Here at Pandora FMS we love news. If it were up to us we would wear new dresses and stilettos every week, we would open headquarters in an unknown tropical country and we would change styles, to other more daring and exotic, in our cocktail parties. Just to make our love for the avant-garde clear once and for all. But this time it is not about showing off a convertible car or cutting edge smartphone to impress those in the neighborhood, it is about something that interests us all much more: the possibility of installing Pandora FMS through Cloud. There you have it, cloud monitoring, no more and no less.
That is the good news, which here come announced by a choir of seraphic horns and the most common social networks: Pandora FMS can be installed on Cloud. Cloud monitoring for everyone! You may wonder: “but, what do I need?” Don’t worry, don’t get into despair, here we go:
-It requires an installed version of CentOS 7.x.
-RAM: 2GB (4GB recommended)
-Disk: 10GB of disk.
-Internet: Connection required
-Provider: Valid for all Cloud providers
And that’s it, nothing else, Cloud and execute the following command:
curl -Ls https://pfms.me/deploy-pandora | sh
To this great news you just have to add that we also released a new download page and you already had enough excitement until Foo Fighters release a new album again. Possibility of Pandora FMS through cloud monitoring and new download page. We are definitely saving 2021. Perhaps we will compete with some variety of the Covid vaccine and with Tom Brady, now that it has been leaked how much he earns. But of course we are already among the most awaited and healing news of the year. And we have to say that this is only the beginning, we are not left alone in cloud monitoring, we have a few hectic months ahead, all full of innovation and surprises. But don’t worry, you can enjoy it little by little. You just have to be attentive to our blog and social networks.
Besides this, what do you think of the idea that Pandora FMS has a license that fully adapts to your needs? More flexible and adaptable than one of those memory foam mattresses from Ikea. You don’t believe it? It only takes to monitor our prices.
We may seem unfathomable to you, but don’t be alarmed, take your paper boat and explore all Pandora FMS features you want with a completely free and functional trial for a period of 30 days. You will surely stay with us!
And as I say, if you want to keep up with all our news and you like IT, releases and, of course, monitoring, we are waiting for you in our blog and in our different social networks, from Linkedin to Twitter not forgetting Facebook. We even have a Youtube channel!, and with better storytellers than any other youtuber.

by Guillermo Sánchez | Last updated Sep 1, 2021 | Enterprises
How to use Pandora FMS from Microsoft Azure
In this article we will focus on our on-premise platform, or cloud monitoring after having installed Pandora FMS console in Microsoft Azure. The installation will be made with an automated script that installs the Community version and with a second script, it allows to update Pandora FMS to its Enterprise edition (Corporative), leaving a 30-day test version (Trial).
Requirements
In order to use Pandora FMS, it is necessary to meet the following requirements:
| Requirement |
Settings |
| CentOS 8 Virtual Machine |
2 GB RAM, 40 Disk
(minimum) |
| WEB Console (Firewall) |
443 TCP (https) |
| Tentacle Agents (Firewall) |
41121 TCP (Tentacle) |
| SSH management |
22 TCP (SSH) |
| SSL Certificate |
Public Certificate |
| CNAME alias |
To use your own domain |
Note: The script is only supported on CentOS 8
Pandora FMS running in Azure
Once Pandora FMS is installed in Azure, the functional diagram will be as follows:
Functional Outline
Before continuing, let’s see some screenshots of a Pandora FMS console running in Microsoft Azure:
Virtual Machine
Settings -> Networks
Virtual Machine Creation
For the script to work properly, it is important to use a supported virtual machine for this process. To do that, go to Microsoft Azure console (https://portal.azure.com) and select the following:
Azure Services -> Create Resource
In the Marketplace, look for CentOS 8.2 and select the following image:
Note: The script works using this image. In case of using another, if the repositories are set up differently, the installation may fail.
The rest of the process can be seen in detail in this guide.
Why monitor from Azure (Cloud)
Technology evolves over time and as a result of this evolution, our way of implementing changes. Many customers already have part of their infrastructure in the cloud. Today there are many hybrid on-premise (data center) + Cloud environments and many companies have their mail in SAAS (Software as a Service) format, as it is the case with Google Apps and Office 365.
Bearing this in mind, is Pandora FMS ready to run in the Cloud? The answer is simple. Yes, Pandora FMS is capable of being executed from the Cloud without any kind of difficulty. Software agents send information using TCP port 41121 (Tentacle). That way, all modules created in the software agents, whether Windows or Linux, will be reflected in your Pandora FMS implementation
Pandora FMS running in Azure
After this short introduction, let’s see Pandora FMS running directly in Azure. As you could see from the functional outline, at the beginning of the article, I am monitoring my smart home from Azure. Let’s see the tactical view:
We can see in this case that 52 agents are being monitored, where there are 591 modules, 588 of them in Ok status (Green), 2 in Failure (Red) and 1 in Alert (Yellow). The tactical view is very useful to quickly find out the health status of your platform.
Another very interesting view in Pandora FMS is the group view:
In this view we can group our agents to be able to organize in a simple way the technologies that are being monitored, the place where the agent is or any data that helps us quickly find the monitors that we are creating.
Useful features
Running any application from the Cloud brings new challenges, even if we have a hybrid infrastructure. Bearing in mind that it is a reality in many companies, we are going to focus on the advanced features that Pandora FMS has and that can help us work efficiently by having our solution running in Azure.
An extremely useful Pandora FMS feature is Discovery; one of the options is to perform a network sweep (scan) and sum all the ICMP, SNMP and WMI devices in a very easy way. This is very simple if the agents are on the same network as that of Pandora FMS server or if they have a network connection from another branch with a site-to-site tunnel for example. But all this does not happen having Pandora FMS in Azure; so what happens? Do we lose this feature?
The answer is very simple, we do not lose this feature, we can use it with a Satellite Server (only in Enterprise version).
It allows exploring and detecting new systems, monitoring remotely, executing remote plugins and allowing forwarding data files from the software agents to the main server, working as an agent proxy. It sends the monitoring data as XMLs through a Tentacle connection, so it does not require connection to the database.
Here is a link to the official documentation on Satellite Server and below some screenshots.
Agents created from a Satellite Server:
Firewall discovered by Satellite Server SNMP:
SNMP details:
It is important to bear in mind that the SNMP values seen in the graphs are generated automatically, only giving as values the IP of the device and the SNMP community that it must check.
Remote Configuration and Collections
Another feature available only in the Enterprise version and very useful for companies with many agents is remote configuration and collections, which allow us to solve two great challenges running Pandora FMS in Azure; the first is to manage the agents 100% from the WEB console and the second is to distribute agent plugins in a simple and efficient way that does not require any additional configuration to work in Azure.
Agent with remote configuration enabled:
Collection enabled for an agent:
Synced scripts on the agent in ITSanchez collection:
A link to the official documentation on remote configuration.
Cloud Monitoring from Pandora FMS
Pandora FMS is constantly evolving according to the evolution of technology itself. Bearing in mind that many companies use Office 365 and virtual machines running on Azure, is it possible to monitor them natively?
The answer is very simple: yes, it is possible, you can make a query using Office 365 APIs and obtain the status of the services that are part of the solution.
Office 365 status view
As for Azure virtual machines, from Discovery it is possible to configure the automatic discovery of your infrastructure running on Azure.
In this case, we see 2 virtual machines, one is running and the other is off, as well as a sum of the consumption in the southcentralus datacenter.
Here is a link to the official documentation on Azure monitoring.
Practical Case on Monitoring from Azure
To close this article I am going to share how I can see the health status of my smart home solution based on openHAB.
To run the solution, I am using two Raspberry PIs, where a key value is to know the working temperature of each computer.
Raspberry PI CPU Temperature View:
Dashboard in Grafana integrated into Pandora FMS:
To finish off, here you have a service view (Enterprise feature) that allows you to build a view of any application based on the business.
Conclusion
Pandora FMS is a tool that allows you to monitor the health of your infrastructure by running the solution from the Cloud, in this specific case from Microsoft Azure.
If you want to find out more about what Pandora FMS can offer you, click here.
Moreover, if you have to monitor more than 100 devices, you may also enjoy a FREE 30-day Pandora FMS Enterprise DEMO . Get it here .
by Dimas Pardo | Last updated Aug 27, 2021 | Tech
What is a NAS server and what is it for?
Storage devices for networking, or NAS servers are in good health. And no wonder, since we have increasingly more data to save and more need to use them from different locations.
Traditionally, NAS servers have been considered a cheaper (and also more limited) alternative to other types of servers. However, NAS servers can also be used to carry out different tasks. But before we get into that, how about we find out more about what a NAS server is?
What is a NAS server?
A NAS server is a computer intended for data storage and use through a network.
Therefore, based on its definition, you may already conclude its main function. This type of device is designed to work like a large hard disk that, by being connected to a network, could be accessible from any location that enjoys connection to it. However, a NAS server, as we will see later, is much more than a hard drive.
NAS servers have grown in popularity at the rate that the use of applications and devices created to be used under the concept of “cloud” have done so. What happens is that, in this case, NAS servers would not be linked to the type of “cloud” managed by third parties (usually companies that offer this type of services), but would be a way to enjoy a kind of “Private cloud”, that is, storage that we could access from anywhere but that we would have under our control, locating said servers in our own company or, for more domestic use, in our own home.
That said, we can specify a little more what a NAS server is from the point of view of its components. In this sense, a NAS server usually has the usual components in any server, such as its own CPU, RAM memory and a series of hard drives depending on the storage needs, among others. In addition, it will have its own operating system and different applications, depending on the use you want to give it.
What is a NAS server usually for?
-Backup storage
One of the main applications of NAS servers is to store backups of files generated by different devices. It is, therefore, a way to centralize the backup copies of data that may be being created in different locations.
-Create your private cloud
Although most companies tend to turn to third-party cloud services, the option of maintaining a NAS server could also be interesting. With a NAS server, the computers that store the data remain under the physical control of the company and also not depend so much on the agility and state of service that a third party can provide.
-File sharing system
It is another of the common uses in companies. Instead of having the information spread over a multitude of computers, certain data is stored and made available to workers through NAS servers. In this line of thought, the options to establish permissions provided by the software being used will be important.
-Web server
A NAS server can perform different functions related to the web service. For example, it can support the main web server, work as a test server, or even perform web server functions on its own.
-VPN server
Another obvious use of a NAS server is to perform VPN functions. VPNs or Virtual Private Networks are virtualized networks in which we can work under special privacy conditions. They are usually widely used, for example in companies, to work from home as if we were doing it in the office itself.
-Multimedia storage
It is a more domestic use than the previous ones, but also very popular. Some people use a NAS server in order to store multimedia content that they will play on different devices, such as desktop or laptop computers, tablets, or televisions.
What to consider before buying a NAS server?
-Harware
In a NAS server, we will find components very similar to those we would find in another type of computer, so we will have to look at them as we would for other of our purchases. For example, both the CPU and RAM will be essential for you to work with agility. The specific choice will depend on the use you are going to give it. If you only want it as a storage device that you won’t access frequently, you won’t need a very powerful microprocessor or RAM; however, if you are going to use it to a wide extent, for example as a multimedia server, you will probably need more powerful components.
The section for storage deserves separate consideration. Here you should think carefully about the capacity you need, in order not to fall short in face of the future. Also, keep in mind that, although some NAS servers tend to incorporate hard drives, the most common thing will be that you have to purchase them separately.
-Software
No less important will be the software you have. Most often, each manufacturer has a specific operating system, so you should find out what this will be before purchasing the server.
Similarly, the ecosystem of applications available will depend on the equipment you purchase, so think carefully about the use or uses that you will want to give to your NAS server and what will be the different applications that you will be able to use on the server that you want to acquire.
And now, a little bit of monitoring
To finish off, don’t forget that one of the things you can (and in some cases certainly should) do with your NAS servers is monitor them.
Monitoring systems are responsible for monitoring IT systems (hardware, networks and communications, operating systems or applications, for example) in order to analyze their performance, and to detect and alert about possible errors.
And if we talk about monitoring, of course, we should talk about Pandora FMS. Pandora FMS is a flexible monitoring software, capable of monitoring devices, infrastructures, applications, services and business processes.
Would you like to find out more about what Pandora FMS can offer you? Find out clicking here .
If you have to monitor more than 100 devices, you can also enjoy a FREE 30-day Pandora FMS Enterprise TRIAL . Get it here .

by Dimas Pardo | Last updated Jun 10, 2021 | Community
Discover the top network monitoring benefits
Welcome to “The Top”, a program for grandfathers and children, for those who are idly hanging around and those who are natural achievers, for both nerds and popular quarterbacks. In short, this versatile and massive show is devoted to making the most unusual and genuine rankings. After trying, from 1 to 5, which Spice Girl we like best or which of the Epicurus Tetrapharmaceutical points is above the others, today we are moving on to the very expected: “Top network monitoring benefits”.
You have asked us earnestly for this classification, and although we dared not set their positions in order of importance, we are going to show you the points, within this top, that seem most important and relevant to us, and which you can certainly enjoy. If you can think of any more points, go ahead. Leave your opinion in the comments. A man with a monocle, a top hat and a mustache will review and judge them.
Top network monitoring benefits
1. Make better decisions as your system progresses and scales
It seems that we are talking about measuring, like when you go to those picturesque street markets, where you find all kinds of surprising fruits, vegetables, food and items. But no, we are talking about network monitoring. As we know, thanks to network monitoring, almost anything can be monitored, but what is not so clear to us, and that is the point that we want to highlight in our top, is that network monitoring will continue to work as our IT infrastructure evolves or new providers and technologies are added. Symbiosis and joint evolution. That is the fact.
A good monitoring will assume any element or plus that is added or changed in the network. It will offer a clearer visibility and control of the data, being able to make better decisions and stay more attached to the reality of our system.
2. Save time
It’s not that we are one of those fans with little “Carpe Diem” flags who don’t stop citing Virgilio on birthdays: “Be a fugit interea, fugit irreparabile tempus”, but we do consider that all time saved is time gained. Saving time, among these network monitoring benefits, means having time in your pockets that you can devote to other tasks that are even more rewarding than taking care of your company. And this is what good network monitoring does, save and give you time.
Yes, all this time you waste trying to gather information, urgently, when it turns out that, boom, there is a problem. Thanks to network monitoring you will always be aware of what you need. The system will warn you of slow or failing components, annoying interruptions, overloaded servers, and poor connections, as well as other different problems that usually arise and that thanks to network monitoring can be immediately issued or anticipated.
But, a network monitoring solution that allows you to monitor everything on a single dashboard would be magical. With a single glance and without the need to enter thousands of platforms to monitor problems. That really saves time. Virgil, in the Roman tomb where he is, would be proud.
3. Getting ahead of chaos
We do not want to be ominous either. But in this house we follow the laws of thermodynamics. And as we know from the statement of the second sentence, every system tends to chaos. Frozen particles are condemned to melt, the universe to expand, couples to break up… So, folks, you have to stay ahead of chaos, and there’s nothing better to stay ahead of chaos than fine-tuned network monitoring.
Network monitoring is always looking for features, comparing data, revealing trends, and of course like that it efficiently gets to the root of problems faster, even before they come out.
Good network monitoring makes visible all kinds of minor problems or near-misses, so that one can address and solve them long before they turn and mutate into catastrophic and bloody problems. It’s like making sure that that lizard is gaining weight gets eradicated it before it turns into Godzilla and atomizes the entire city.
This way of working in advance not only helps you be cautious but also to plan for tomorrow. So, for example, we can be prepared for future updates without fear. Long before our current infrastructure reaches a potential limit.
4. Saving money
If our mate Virgilio gave you moralities and Latin advice so that you treasure your time, we, Uncle Sam and the Wolf of Wall Street strongly encourage you to treasure your money as well, and this, as it has been common in this Top, can be achieved through good monitoring.
Managing your IT system can be a burden, and a good one. After all, if something goes wrong with the system, the money per minute you lose would make even the hardest and most fearless ones collapse. But thanks to the guardian angel, which is a good network monitoring system, you make money and rest. If it is well tuned and, that said, it is as worthwhile as Pandora FMS, you will reduce any possible downtime due to a problem, so it will be rare that you lose money.
As we know, good network monitoring provides alerts about problems in your IT infrastructure. You can also customize those alerts with the ease with which you program those of your smartphone to wake up. Alert thresholds can be based on the standards that the industry dictates at that time or on the parameters that you want or need. So end the stress, end a possible period of inactivity due to some kind of problem, and end the million-dollar loss of money for not solving that problem on time.
So far our “Top” this week. I hope it has been very helpful to you and supports you in your decision to get a good network monitoring system. Next week we will return with more crazy and fun tops like “Series from your childhood that could not be PG rated”.
To finish off this article about network monitoring benefits, remember Pandora FMS is a flexible all-in-one monitoring system, capable of monitoring devices, infrastructures, applications, services and business processes.
Would you like to find out more about what Pandora FMS can offer you? Find out clicking here .
If you have to monitor more than 100 devices, you can also enjoy a FREE 30-day Pandora FMS Enterprise TRIAL . Get it here .

by Jimmy Olano | Last updated Aug 27, 2021 | Community
How to contribute to free software projects
«Beethoven was a good composer because he used new ideas combining them together with old ones. No one, not even Beethoven, could invent music from scratch. It’s the same with computing.»
Richard Matthew Stallman.
The previous sentence is attributed to a famous hacker – not cracker – from the Massachusetts Institute of Technology (better known as MIT). As well as we have the word “present” with double meaning, “free” means both “with no cost” and “free” as in what enjoys freedom, so Dr. Stallman proposed the name free software to highlight the importance of freedom on economic matters. Yes, today I am talking about free software, which encompasses open source, and although they are different, in essence both retain the same spirit: being able to be our own owners (or, if seen in a funny way, “having the upper hand”).
Why is free software necessary?
“Free Software (CONATEL Venezuela, 2019)”
As you all know, this blog is about monitoring and our powerful tool Pandora FMS. I say ours because I’ve already become entangled in the user forum of pandorafms.org, where we write down and try to solve the doubts and/or problems of the community version.
However, most of the proprietary applications have such forums with employees paid – with our money – to assist us. That is fine and should continue to exist. The difference with free software (thinking selfishly) is that we can adapt it to our needs. In addition, we have the true possibility of directly proposing solutions to the original developers and even being recognized as authors, no matter how tiny our contribution is.
The latter comes to mind when I found out through the social network Twitter about the eight hundred and forty-third author of the famous curl software, a project that dates back to the last century and that to this day is still widely used in countless applications (Pandora FMS included). I was curious to find out what the contribution was and I was surprised: it was moving a comment to the right place. You may laugh at it, you are free to do so, that is what free software is for: freedom without debauchery. A good laugh brightens the day, encourages us and prepares us for hard tasks such as, for example, surpassing ourselves the contribution that we found funny.
Another thing to highlight is that the repository is hosted with the GitHub company, which, at the time this is written, is owned by Microsoft Corporation®, a leader in proprietary software, which I honestly consider an irony and leads us to the following point.
Git and free software
I have already talked about it in a brief story about Git, the software version control system most used today in all kinds of projects, both free and proprietary. GitHub is revolutionary because it allows you to host your repositories with free software for free, and you earn your income by hosting private repositories.
Good programmers know what to write. The best, what to rewrite (and reuse).
Eric Raymond in his book “The Cathedral and the Bazaar”
His philosophy is to make our lives as programmers easier. For example, the tutorial “Hello world” has been visited – and executed – by millions of people. It is well written in English and captures the purest essence of working with Git. Would you like to “build” your own online website to host your code? That is what GitLab is for, the closest competitor to GitHub but strongly focused on Steady Software Development.
Pandora FMS has been open source since the end of 2002, and uses everything available like the previous ones, in addition to Sourceforge, Word Press (these article that you are reading now) and a big compilation of utilities united by its own code: more than 700,000 lines, 102 contributors representing more than 212 years worth of programmer work at a cost equivalent to about 14 million US dollars. In addition, in the world of free software there are gigantic projects like Red Hat®, to name one that is listed on the US stock exchange.
12 tips for contributing to free software projects
Using free software is not more difficult, it requires matching knowledge. Those who made the effort to learn about proprietary software at the time should do so again today to learn about free software
Linus Torvalds, Author of Linux®
- Organize or just promote face-to-face or online seminars dealing with free software.
- Extend the tool to meet your needs and then share it as a new feature. Whether the community accepts or disregards it does not matter! Maybe your ego will be hurt, but you have already done your duty: you received something for “free”, you improved it (for your selfish benefit) and then you shared it. Period!
- Most likely, you are not a programmer… but just by using free software, finding bugs and properly reporting them, you can be very helpful. If there are many users who report the same, surely it is some important bug that no one dared to report before… or some programmer already has the solution and is waiting to publish it just after reading your report.
- If that was your case or if you are just happy with the free software developed, thank the team directly or tag them in the social network of your choice.
- Would you like to further show your gratitude? Donate. Most of the projects accept donations and if not they explicitly indicate it (for example PuTTY suggests collaborating through mirror sites).
- Also using social networks or forums devoted to that, if you are already an advanced user of a free software tool, you may help answer questions, clarify doubts or even publish tutorials on the matter. The golden rule remains the same: a lot of humility, a lot of patience, and a lot of respect when addressing others. “No one was born learned”
- Not only with the general public we can help: if at the time of reading the project documentation, we find a spelling error or something completely illogical, reporting such mistakes in the documentation text can be very helpful. Even checking features that we did not know is useful, since if we find that it does not do or is not capable of doing what the documentation indicates, we can contribute as I described in the third point.
- On the contrary, if the documentation is wonderfully written but it is not in your preferred language… help with the translations! I have translated articles not only from English -the most frequent-, but also from French or even sections in Chinese into Spanish. Always read the rules first before contributing: for example, the Python language is extremely rigorous in its syntax and indentation, and it is no less so for its translations!
- If you’re feeling really brave you can fork the code; yes, I recommend that you read the project licenses in depth. In essence we must properly and without pettiness credit each and every one of the original authors and contributors, even if it requires a lot of disk space; in 2021 we have a good amount of hardware and memory for these purposes. Also, by using Git all of that is well recorded in the history when branching.
- I am an older person, I never get tired of repeating it nor am I sorry to admit it: I feel good reading forums and articles to stay up to date. But I have noticed that because of social networks, and now more so with the COVID-19 pandemic, they publish video tutorials… Yes, the new generation needs “quick solutions and right at their fingertips’ reach” and the immediacy of information has never before been so close. Do you have good diction -and even some charisma- and are you an advanced user of some free software? It is relatively easy to record yourself talking about a specific topic and seven minutes is more than enough. You may even go further and set up your own PeerTube® server, which allows the first visitor to lend their computer to help broadcast your video while it enjoys it (note: this exposes your IP address to third parties and your firewall; if properly configured, it will warn you). There is even something called YouTube® that you might know.
- I am a lousy artistic draftsman, but when it comes to vector graphics (SVG format) and assisted design programs (CAD) I consider myself good, I have even successfully passed courses. If web design or graphic design is your thing and you are talented at it, you can contribute to improve a free software project. What’s more, many times there are sponsoring companies that donate prize money for design contests. If you are really good, you may even reach an economic benefit. Who knows?
- Many free software projects have test environments and need specialized hardware or equipment with specific characteristics (say, for example PowerPC processors). Donating or lending these devices, as long as they are in good condition and the project members accept and approve their use, is a good way to help. I beg you not to donate something that you are going to throw away, for that there are specialized charities.
- Yes, there were twelve but I add one more: share this article, not only for Pandora FMS and its community version but also for the essence of my message. I will be personally very grateful for it.

by Dimas Pardo | Last updated Sep 1, 2021 | Features
Discover Pandora FMS SaaS version
Times change and so we do. If you are one of those who pay attention to their surroundings, who does not miss anything, you surely realized that our website has since a few days ago a mysterious new tab in its browsing menu that corresponds to the acronym “SaaS”.
This acronym refers to the term “Software as a Service” and refers to a software distribution mode in which the software and data are located on external servers to those of the user, which are accessed through the Internet.
Software as a Service is increasingly being demanded by companies of all sizes and that is why Pandora FMS wanted to keep up with this trend and offer this modality through three international partners that will offer our SaaS service in Asia, EMEA and South America. Would you like to get to know them a little better?
Meet our SaaS partners
-In Europe, the Middle East and Africa, our reference partner will be Uniway Technologies. With more than 20 years of experience, Uniway Technologies is a system integrator and reference service provider in the IT market. If you want to learn more about its uMonitor service, which integrates Pandora FMS, you can do so by clicking here.
-In South America, we joined hands with SITS Solutions. SITS Solutions has more than 15 years of experience in the IT sector, in which it has worked with the most prestigious manufacturers in the market proving its ability to advise, implement and launch a wide range of IT services. Do not miss the opportunity to also visit their website.
-For the Asia and Pacific Ocean market we count on Rworks. Rworks is a Tokyo-based company with extensive expertise in comprehensive managed services in critical environments. Our partner has a team of network technology experts, who know how to get the most out of the resources available. Here you can find their website.
Who is the SaaS version for?
Our SaaS version is aimed at businesses of any size, from SMEs to large companies. However, this Pandora FMS mode is an extraordinary opportunity for small or medium sized companies to easily and economically access a high-quality monitoring tool such as Pandora FMS.
Why choose Pandora FMS SaaS version?
Although our On Premise version is still available as usual, your business or organization may find more benefits in our SaaS version. Let us show you some of the advantages it will offer!
-SaaS monitoring provides unlimited scalability and instant access from anywhere and from any browser or device. It also gets rid of worrying about maintaining storage, servers, backups, and software updates.
-It represents significant initial and maintenance cost savings by not having to make large investments in hardware and support. In addition, maintenance and updates will be faster and you will be able to have a constantly updated technological ecosystem without the need for qualified personnel.
-The SaaS service does not mean lower security. Rather, we have the best industry standards.
-In addition, the SaaS model allows pay-as-you-go. That means you’ll pay for what you use, so you can scale up or down your resources through a 5-agent pack system and depending on usage level.
If you want to find out more, visit our web page about SaaS or contact our sales team. They will be happy to answer all of your questions and, if you wish, help you with a totally free demo.
Don’t waste another second and get into the SaaS world!

by Dimas Pardo | Last updated Apr 3, 2024 | Cloud & Virtualization
Although it is not well known to the general public, virtualization technology is widely used in technical environments for being useful when carrying out multiple tasks and for the possibilities it offers for better resource usage.
Virtualization technology software is increasingly used by professionals in the sector, having already become an essential tool for the work of many of them. In this article, we are going to find out what virtualization is and we will discover some of the most common uses it is usually given. Let’s begin!
What is virtualization technology?
We know virtualization technology as the creation, through software, of the virtual version of an environment or technological resource. Let’s take a better look at this definition through an example.
A virtualization software can allow you to create several “virtual computers” (for example 3) within one. Thus, the software will create the “illusion” of generating 3 different computers, each one with its own operating system and its own resources.
Does this mean that with this software you will be able to multiply by 3 the capacity of your computer? Not really. The actual capacity will stay the same, but its functions will get divided into 3, allowing you to obtain multiple advantages, such as using different operating systems on the same computer.
How does virtualization technology work?
In order to carry out virtualization, the VMM (Virtual Machine Monitor), also called Hypervisor, generates a abstraction layer between the hardware and the operating system of the virtual machine, in such a way that it divides and manages the hardware resources between the number of virtual machines that you wish to use.
So, each of the virtual machines can be used to carry out different tasks, and even, as we said, different operating systems can be used. Another interesting question is that the attributions of virtual machines might be fixed (so that the resources devoted to each of them stay always the same) or they might be variable (so that the tool will distribute the resources among each of the virtual machines depending on the existing needs).
However, this example we are talking about only gives a glimpse of a small part of the many tasks that virtualization technology is used for today. Let us take a close look at a few of them.
5 examples of virtualization technology
For the last few years, and as “cloud” services have become more popular, virtualization has grown to become the widely used tool that it is today.
Today, virtualization technology is used to carry out multiple functions. Let’s see some of the most common ones.
Application virtualization
Widely used in recent years, hand in hand with the concept known as SaaS (Software as a Service). Application virtualization allows the user to use software that is not installed on their computer. Therefore, and on demand, the software provider’s server supplies the user with a package that saves the settings and the environment necessary to run the software, so that they can use it without having to carry out a complete download.
Desktop virtualization
It has also become a very popular application, widely used in work environments. Thanks to it, a virtual desktop that is not stored on the user’s computer, but on the servers of the service provider is created. So, each time a user is accessing their virtual desktop, the programs, applications, data, etc., will be hosted on said servers, which will offer multiple possibilities to the user, for example allowing the use of the desktop on different devices and from multiple locations.
Server virtualization
It is common for both companies and service providers. Server virtualization divides these into a series of virtual servers, which offers advantages such as cost savings or the automation of some tasks.
Thus, many companies use virtual servers instead of physical servers, generally for economic reasons, but also for other reasons such as higher service stability.
Storage virtualization
Although in other types of virtualization the common practice is to divide a physical resource into different virtual resources, this does not mean that virtualization always follows that direction. An example of the opposite is usually found in storage virtualization.
In this type of virtualization, it is common practice to centralize the information in a single hypervisor where you may access all the data, regardless of whether it is stored in different places and media, making management easier and improving availability and speed.
Network virtualization
This is the form of virtualization that uses the physical resources of a network in order to create different virtual networks that work independently and separately from each other.
Network virtualization has also been widely used for years, especially for compatibility and security reasons.
And so far we have seen what virtualization technology is and what some of the most frequent uses that it is usually given are. You have to bear in mind, in any case, that these are only some general outlines, since virtualization can be very heterogeneous and complex. And, of course, on many occasions it will make a lot of sense to monitor it, which leads us to Pandora FMS. Don’t you know what it is yet?
Pandora FMS is a flexible monitoring software, capable of monitoring devices, infrastructures, applications, services and business processes.
And, of course, one of the things that Pandora FMS is capable of monitoring are virtual environments. Do you want to find out more? Go here.
If you have to monitor more than 100 devices, you may also enjoy a FREE 30-day Pandora FMS Enterprise TRIAL.

by Dimas Pardo | Last updated Sep 1, 2021 | Community
Interview with Sancho Lerena about the current business changes
This year, no sector has been spared from the business changes caused by the Covid-19 pandemic, which have almost always been painful ones: millions of dollars in losses for theaters, which still do not know where or when they will premiere their films, a dying tourism sector, the world of hospitality ruined, parents who fear taking their children to school, bankrupted real estate companies… and a lot of glances towards heaven waiting for an answer, from the Most High above or from the extraterrestrial ship that will end us after this fateful 2020.
At this time it is best to turn around in search of the eyes of the experts to understand the business changes that are to come. And I am not referring to some religious and enlightened person on duty who proclaims the end of the world is coming from the corner of a square or some people who enjoy talking about conspiracies on TV as well as they may talk about ghosts or whatever. I mean real experts.
In our case, in the business and technology sector we have many experts to ask for an answer, but we must set some filters first, of course. We are not interested in any tongue-in-cheek brother-in-law with access to Wikipedia, and neither Bill Gates, he no longer picks up our calls. That is why we have chosen to have a small discussion with Sancho Lerena, CEO and founder of Ártica ST, the creator of the successful Pandora FMS monitoring software. Does he sound familiar?
When I decided to meet with Sancho, we both avoided the crowded tables at Starbucks for just the cliché and preferred to stop by the new location of the company. As many of you know, Artica ST moved its headquarters from crowded Gran Vía to the more accessible Pérez Iglesias Business Park. I was lucky enough to be able to visit both at the time and perhaps I would choose with this new one, in a more diaphanous location.
Once there, I greeted the charming employees, who always have nice words for me, and went to Sancho’s office. It would take him a little bit to arrive, but he did so with the demeanor and class that characterize him and offered me one of the two cups of steaming coffee he carried. That’s how working becomes nice! Like in an advertisement for nougat.
To start things smoothly and not go so straight to the point, we caught up on literature and science fiction, so when the conversation was in full swing we began with the questions that had really led me to meet him.
Could you tell us what your relationship with the business world is?
I feel more like an engineer than a businessman. Being an entrepreneur was the only way to do things “my way” and to be able to create a product, something that requires a long-term vision, incompatible with the reality in which we live. However, I have always been a free spirit and ending up setting up a company was something unavoidable in my life.
What do you think the state of the business sector is right now?
In major crises is where you have the opportunity to show what you are made of. Especially in our sector, companies that know how to innovate and adapt in an agile way have the best growth opportunity in decades. We are living in a moment of historical change.
What do you think are the essential elements for the business change we are experiencing?
I would summarize it in the concept “business resilience”, and that in my opinion should include the following aspects: higher focus on essential business lines, improving financing capacity in different ways, knowing how to integrate remote working in the organization, internationalization and R + D + i as a medium-term strategy.
Based on your knowledge, are the predictions favorable or unfavorable for 2021?
Absolutely optimistic! 2021 is going to be a historic year.
When I finished the talk, I had no choice but to smile. Not because of the comfort coat of the interview’s approach or because of the ease with which the interpellations and replies had followed one another, but rather because of the joy that comes from hearing an expert clarify everything in such a simple way, of course, finally, with optimistic overtones. You see, it is not that you have to spur your horses and go out to throw flares into the streets as if the team from your region won the league or something, no, we are not talking about that at all. However, you do get the warmth of that light finally outlined at the end of this black tunnel that we are all going through, on foot, swimming, in uncomfortable heels, or squatting and saddened.
When I left the new Pandora FMS facilities, although it was bitterly cold, I was walking at an accelerated pace, because I had been given strength. I did not think of Pandora FMS as a top product that is sold on the five continents for companies to manage their own technology and avoid crashes and failures in their systems. I thought of it as a new way to get out of all this viral mess going on where everyone from the fairgrounds to the automotive sector or the construction sector itself has taken the brunt. It may seem like a hackneyed political slogan but, together (it seems that) we can!

by Jimmy Olano | Last updated Dec 18, 2020 | Tech
QWERTY layout; where does it come from and what does it mean?
SOS. Those three letters?, they represent almost at worldwide level a naval distress call… What does the QWERTY layout have to do with the keyboards we use every day? Spoiler Alert: Morse Code Is Involved!
Well, someone might say, “here is another boring article on the QWERTY layout”, but what they did not count on is that the “F” in our name means flexibility and we tend to see things as a whole; Similar to Pandora FMS Web Console dashboard.
Morse Alphabet
Or Morse code: in the 19th century they set out to give practical use to electricity and its electromagnetic wave, which travels almost at the speed of light. Mr. Samuel Morse first used it to send coded numbers and then it was extended to the rest of the English alphabet. I have already talked about trits and I think Morse code is based on it too, but without negative numbers: pause (zero), period (one) and dash (two).
Well, in French CQ, abbreviation for security, “sécurité” (sécu) instructed operators to stop broadcasting as there was an urgency to communicate something important (something similar to a network wide broadcast message).
A letter D was later added at the end standing for “Détresse” (aid); that meant “stop transmitting, distress call!” (I’m actually paraphrasing). This was literally spelled by radio telegraph, that is, they inserted a space between letter and letter. While this happened in 1904 in France almost academically, in Germany they proposed the use of SOS not spelled but as a symbol, without spaces: that way it stayed like three points, three dashes and three points, being shorter and less prone to misinterpretations. This must be represented with a line upon the three letters, to indicate symbol unit (SOS).
Then at the beginning of the twentieth century, the radiotelegraph was like the Internet at the beginning of this XXI century, and many standards were being proposed and implemented. Although CQD was proposed and approved, pragmatism was imposed with SOS!
Francisco Salvá Campillo
By Jordiferrer – Treball propi, CC BY-SA 3.0, https://commons.wikimedia.org/w/index.php?curid=20672461
This notable Catalan doctor stood out more as a physicist, since in 1796 he made a demonstration of the feasibility of telegraphy in Madrid, but he was too ahead of his time: he needed many cables to be able to represent each letter and symbol and it was complex to implement with the technology and human habits of that time.
Guglielmo Marconi, inventor of radiotelegraphy or wireless telegraphy, was able to see and recognize the courage and inventiveness of this Spanish scientist. By the way, look at the suit they advised to protect radio operators from alleged harmful radio waves. Any resemblance to the present is not pure coincidence, our human nature is always like that in the face of the unknown.
By Rolfe Hensingmuller (or Rolf Hensingmüller) – The Atlanta Constitution, page C6, Online, Public Domain, https://commons.wikimedia.org/w/index.php?curid=20517458
But, as I said at the beginning, also here simplicity prevailed, and it was easier to connect a positive and a negative wire with short and long pulses separated – sometimes not – by pauses, to send the information. The technological miracle had taken place, but now it remained to be seen if human beings were capable of learning the convoluted code. They hoped that with more technology something faster and more secure could be established (so as not to lose data, I mean).
The piano and the typewriter
Johannes Gutenberg had developed the printing press around the year 1450 and he made movable types, made of metal, to replace those made of wood, weaker and more tricky to manufacture. Another important issue was their number, about 150 different ones, and from there he began, through trial and error, to study which letters or characters were used most often.
With this technology, it was possible to revolutionize book manufacturing, something previously done manually and slowly and prone to transcription errors. In the century of telegraphy, typewriters were a great advance for any common person, as was the power of having a machine that emulates a printing press in their own home.
By the 1860s, telegraph companies were open to innovation – telecommunications were, and are, a flourishing business – and they were buying Hughes-Phelps printing telegraph even though they had piano-like keyboards, but with only 28 keys. They assigned from letter A to letter N at the top (“black keys”) and the rest at the bottom (“white keys”), but these were in reverse order (from right to left). Yes, I know what you are thinking: and numbers?
Tying up loose ends
That was the demand made by the first buyer of the typewriter created by Carlos Glidden, James Densmore, Samuel Willard Soulé and Christopher Latham Sholes, the latter known as the father of typewriters.
Who bought this prototype was Mr. Edward Payson Porter in 1868, head of his own telegraph school, Porter’s Telegraph College. Why did the telegraph and the typewriter cross paths? The messages needed to be transcribed in a single step and in a presentable way, because we all have different handwriting. From using computers so much, it sometimes takes me three seconds before I start writing with pencil and paper: what is not used, the brain forgets over time. If before my handwriting was ugly, now without practice, imagine the result… because at that time the issue was also that, legibility and uniformity.
In 1870, they delivered a second version of the typewriter, with 38 keys. It included the numbers two through nine, hyphen, comma, period, and the question mark. You may be wondering where the numbers one and zero were, and the same question I asked myself in 1981 when one of my maternal uncles “migrated” from mechanical to electric typewriters in his office and gave me one of the old typewriters: the letter “L” worked as number one as well and the same for letter “O” and zero.
At this time, the alphabetical order was broken, since there were four rows of keys:
- The first row contained the numbers and the dash at the end.
- The second row contained the vowels, with the period and question mark in the center and the comma at the end. As a rare thing, the letter “y” was also included.
- The third and fourth ones kept the similarity with the “piano keyboard” of the first model, of course without the letters named above.
With this improvement working smoothly, Mr. Sholes and his sponsor and partner Densmore soon faced another much bigger stumbling block: They made a sales pitch to the American Telegraph Works represented by George Harrington, whose partner was Thomas Alva Edison himself, creator of the manufacture of the electric light bulb that we still use in our ovens and kitchens.
For Edison, the key layout was horrible and he saw no commercial possibility for that model. Considering that Edison tested more than 300 different materials for his electric light bulb and accumulated more than a thousand patented inventions throughout his life, this key layout problem was not little thing at all.
Mighty Mr. Money
Harrington also had another partner named Daniel Hutchins Craig and both, against Edison’s will, offered to make a good purchase for typewriters as long as the keyboard was improved: the QWERTY layout was about to be born.
They soon studied and relied on the trades of the common telegrapher, such as the frequent errors of confusing letters like “c” and “s” or the letter “z” with the pair of letters “s” and “e”, in addition to many other peculiarities. But in the end it was all well rewarded and as sales increased (they managed to capture the large Western Union Telegraph Company in Chicago as a customer) they soon realized that they were not able to manufacture enough units to satisfy the market.
In 1873, Sholes went to New York and made a deal with E. Remington & Sons, prosperous arms manufacturers: The model brought into production was QWE.TY and almost reaching the QWERTY layout! It had 43 keys and thus the Sholes & Glidden Type-Writer was born. At the end of that same year, Remington employees modified the keyboard again, replacing the dot by the letter “r” and the letter “y” by “u”, creating QWERTU.
They also added another key only used in the telegraph, the three vertical dots that indicated “paragraph break” and, surprisingly this was not included in the ASCII encoding in 1963 and it was not until 1993 that they added it to UNICODE for multilingual purposes.
Patent for QWERTY distribution
But the one who did not agree with this QWERTU distribution was Sholes himself, who moved the letter “y” between “t” and “u”. This was the birth certificate of the QWERTY distribution as he quickly went on to patent the new mechanical contraption in 1874. Although very determined for that moment, after time and shortly before he died, Sholes published a different distribution but that never became popular.
In 1875, the Remingtons bought the idea of capitalization with the same key for the same letter (it is better to be explicit with these things) and in 1878, the Remington Type-Writer No. 2 was born and this model brought with it almost the modern typewriter and keyboard. Here came small changes related to the subject of patents, the ways of typing, learning methods, in short, an enthusiastic community of users started contributing, sharing, founding companies and unifying ideas…
What the existence of the QWERTY distribution sealed, came with the meeting of five leading companies in typewriter manufacturing: Remington, Smith-Premier, Caligraph, DensmoreandYost (under the figure of Union Typewriter Company) and chose this layout as the norm. In 1910, the Teletype also adopted the QWERTY layout and, as we know, computer keyboards were direct heirs, if you will, of these keyboards for Télétype®.
By Flominator – Own work, CC BY-SA 3.0, https://commons.wikimedia.org/w/index.php?curid=59338
Going back to Gutenberg, in 1885 the linotype was invented, “a kind of typewriter” for printers, and based on the letters most used in the English language, the ETAOIN SHRDLU distribution emerged. In 1930, the Dvorak distribution (patented in 1936) was introduced by August Dvorak and William Dealey, which is also governed by the principle of the most frequently used letters and for several languages (not only the English language exists).
Rest of the world
Most of the planet at least has a notion of the QWERTY layout, but many countries do not have it. In the case of the French language, they use the AZERTY distribution, in German it is QWERTZ, etc.
In Asian countries, which use ideograms instead of the alphabet, this issue becomes more difficult. In fact, they use QWERTY keyboards because the motherboards and their BIOSes are not yet made in 64 bits, although the processors are to be able to support a large amount of RAM and huge hard drives. There is still a long way to go in this regard, since it was partially with the introduction of the UEFI, but for each monitor in text mode to represent each UNICODE character (and not to mention the keyboards) is a task that will take some time to solve.
Before finishing, remember Pandora FMS is a flexible monitoring software, capable of monitoring devices, infrastructures, applications, services and business processes.
Would you like to learn more about what Pandora FMS can offer you? Find out clicking here .
If you have to monitor more than 100 devices, you can also enjoy a FREE 30-day Pandora FMS Enterprise TRIAL . Get it here .

by Dimas Pardo | Last updated Feb 29, 2024 | Tech
What are MAC addresses, what are they for and how to find them?
At the shadow of the widespread IP addresses, MAC addresses say even more about our devices than its more popular sister.
As a kind of “identity document for network devices”, a MAC address informs us about “who is who” when connecting to a network. Of course, remember that the one called “MAC” has nothing to do with Macintosh computers. In fact, you can find it on devices of any brand.
In this article we will find out what the MAC address of a device is, what it is for and how to find yours in a very simple way.
What are MAC addresses?
MAC, or “Media Access Control” is the unique identifier that hardware manufacturers assign to the network card of each of the devices they make in order to be unambiguously identifiable when accessing any network (which of course includes the Internet).
MAC addresses are made up of 48 bits, represented by hexadecimal digits. Translated to a more understandable language, this means that the MAC addresses will consist of 12 digits (both letters and numbers) divided into 6 pairs usually separated by a colon (although they will not always have this separation). So, MAC addresses will have a structure like this one: 00: xx: 01: xy: x0: y1 (for example).
And now you may wonder… how is it possible for each number to be different? How does a software manufacturer know that the MAC number it is giving to a device has not already been used by another manufacturer? Well, it’s very simple: part of the MAC address, in fact, is made up of manufacturer identifiers. Particularly, the first 6 digits of the address tell you what the device manufacturer is, while the last 6 are those that the manufacturer assigns to that specific device.
What is the MAC address for?
As we said at the beginning of this article, the MAC address is something like the “identity document” of network cards that your devices use. It is the identifier that a device must “present” before accessing a network and through which it is going to be recognized, with what this entails. Thus, for example, a network administrator can allow or deny access to a network depending on the MAC of the device that wants to connect.
In theory, the MAC address is registered by the device manufacturer, so it would not be possible to modify it, but you know that in life almost nothing is impossible, so some people are capable of, at least, making the network members believe that the MAC address is a different one from the real one.
How can you find out the MAC address of a device?
As you can imagine, the way to access this information will depend on the operating system you are using. Let’s see how to do it in some of the most common ones.
-If you have Windows:
- Press Windows + R keys (that will open Run).
- Type cmd and press Enter. That way you will access the Command Prompt.
- Type ipconfig /all.
- If you look at the Physical Address you will find the MAC address of your computer.
-If you use Linux:
- Access the system console
- Once there, type iconfig.
- Find the field HWaddr. That is the MAC address.
If you use macOS:
- Go to System Preferences.
- Click on Network and, within the left board, select the one you are connected to.
- Click on the Advanced button, which you may find at the bottom of the window.
- Select the Hardware tab. There you may find the MAC address.
-If you use Android:
- Go to Configuration
- Click on Wi-Fi and select the option Advanced settings
- Nothing else. You will find the MAC address at the bottom of the screen.
-If you use iOS:
- Go to Settings.
- Click on General and once inside, choose the option Information.
- Do you see the field Wi-Fi Address? There you have your MAC.
And now, a little bit of monitoring
Now that you have discovered what the MAC address is, what it is for, and even how to find out your computer’s address, how about taking a few minutes to explore the exciting world of system monitoring?
System monitoring is responsible for supervising technology (hardware, networks and communications, operating systems or applications, for example) in order to analyze its performance, and to detect and alert about possible errors. And that leads us to Pandora FMS, that wonderful tool thanks to which this blog is possible.
Pandora FMS is a flexible monitoring software, capable of monitoring devices, infrastructures, applications, services and business processes.
Would you like to find out more about what Pandora FMS can offer you? You’re on the right path! Find out clicking here.
If you have to monitor more than 100 devices, you may also enjoy a FREE 30-day Pandora FMS Enterprise TRIAL . Get it here .

by Pandora FMS team | Last updated Aug 27, 2021 | Community
Pandora FMS new year greetings to our followers
HAPPY NEW YEAR!
And this is not a normal “Happy New Year”, the same as always, the flamboyant and festive one that we all shout on 1st January at family meals or, hopefully, already “merry” at the party organized by our town’s neighbor association. This is a different one. Because it is almost a gold medal, a master’s degree, a hug from the Pope, because, mate, yes, you have already achieved it, you have gone through the threshold of a year as fateful as 2020 to meet the promising and herbal 2021.
And no matter what comes in 2021 just today, day 1, it is still a blank canvas in which, optimists, we do not have to worry about anything, well, yes, about our future projects, because as usual, we will have to keep fighting with renewed strength, after 2020 made us have a hard time. Let’s get it!
On our side we already have our duties written down, our future projects for which we will strive and from which we will surely come out victorious in 2021.
FUTURE PANDORA FMS PROJECTS FOR 2021:
- Creating our very own Tiktok account and with our choreographies draw the attention of viral consumers.
- Meeting Rosalía at a top party, paying our respects and making her understand that it would be an honor to work on a project together.
- Presenting a new edition of Ninja Warrior..
- Winning the tennis championship that Rafa Nadal is the most greedy about, an Oscar with something that moves Steven Spielberg himself, and overtaking Elon Musk in the space race with our own intergalactic/transdimensional prototype that we have prepared in our garage.
- Connecting Pandora FMS AI to the Pentagon computers and let it explore and feed on the mega data on a world scale until it becomes self-conscious and conquer the world.
And yes, that’s it!
Maybe they seem like very ambitious plans, but that’s how we are at Pandora FMS, optimistic and high-sounding. And if these plans end up failing, surely others, on a smaller scale and always related to monitoring, will be achieved. But, of course, always with your help and approval, because friends, this 2021 is all ours, and we are going to reach, together, the very top.
HAPPY 2021 FROM PANDORA FMS!


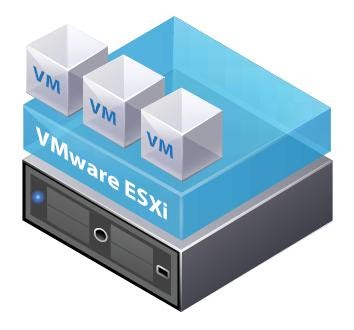
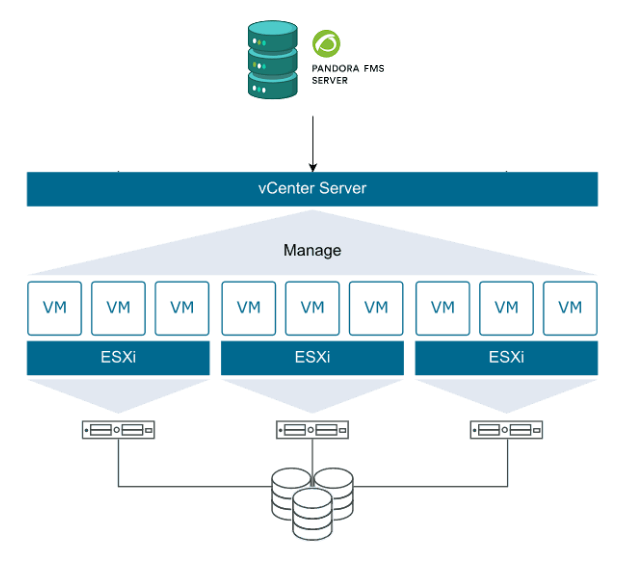


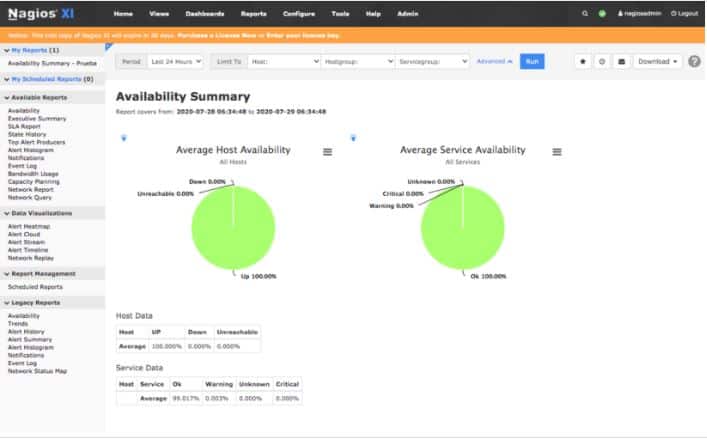
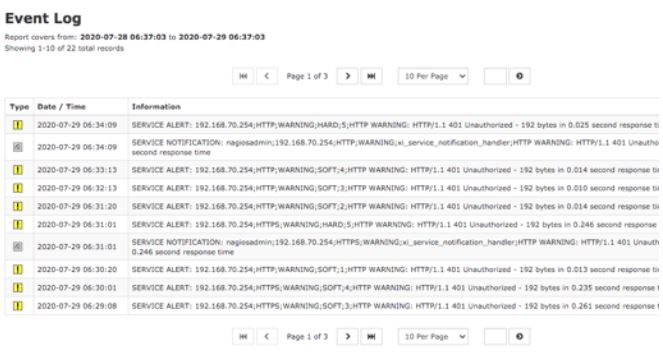
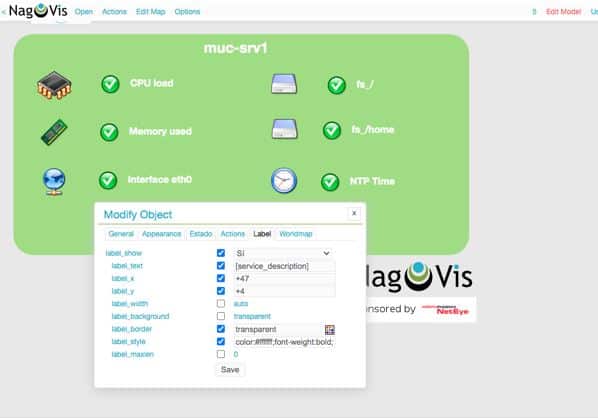
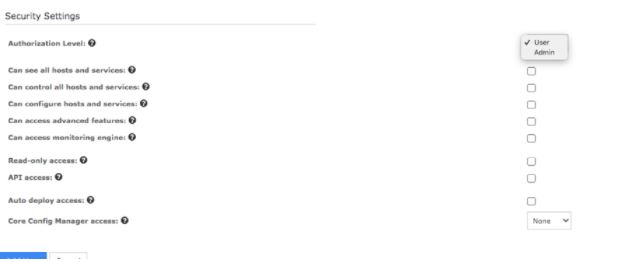
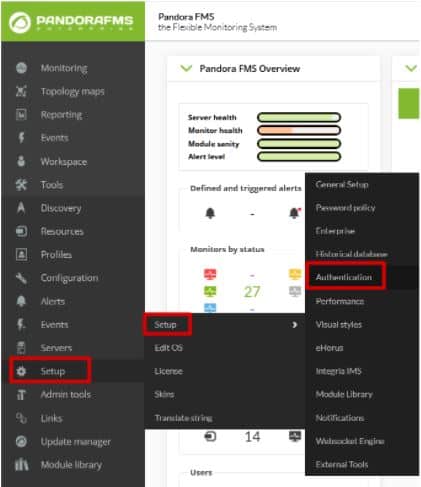

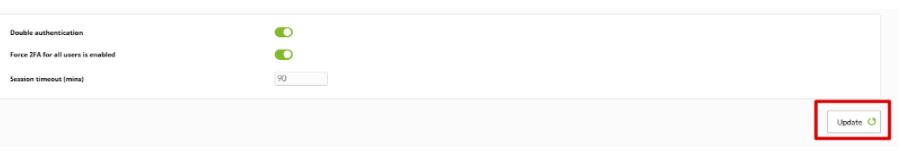
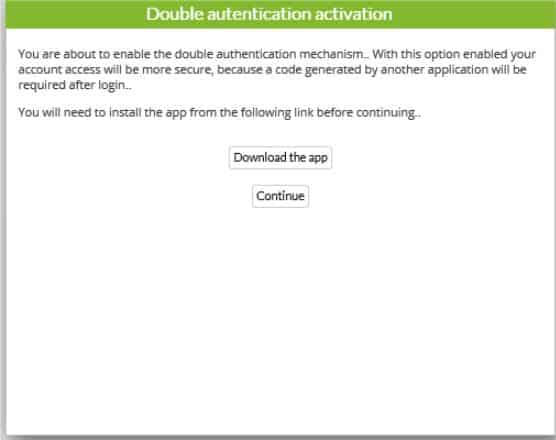


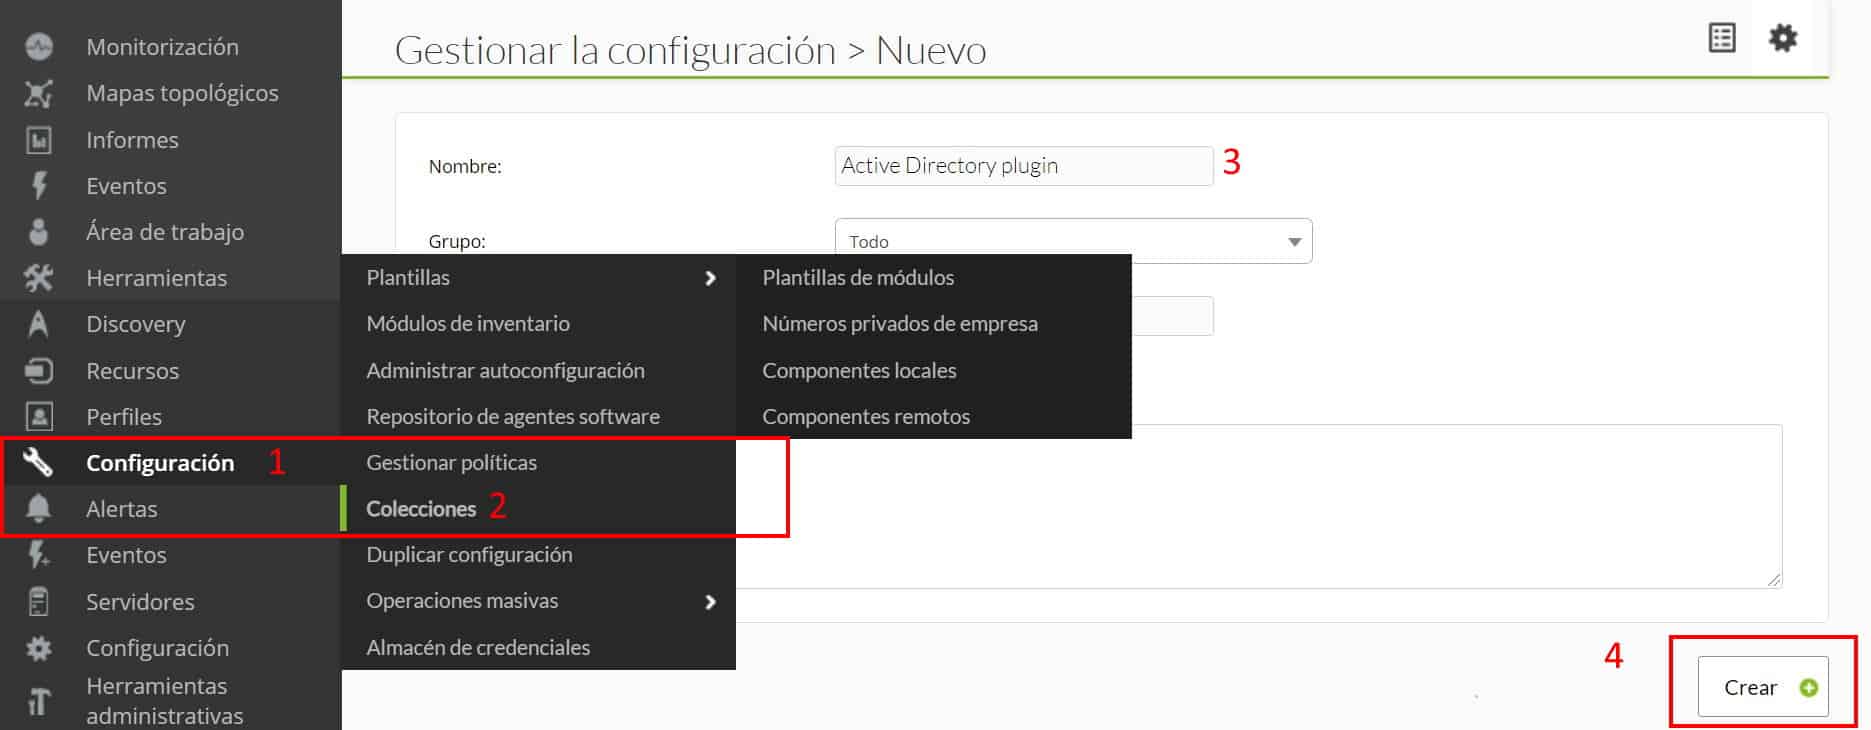
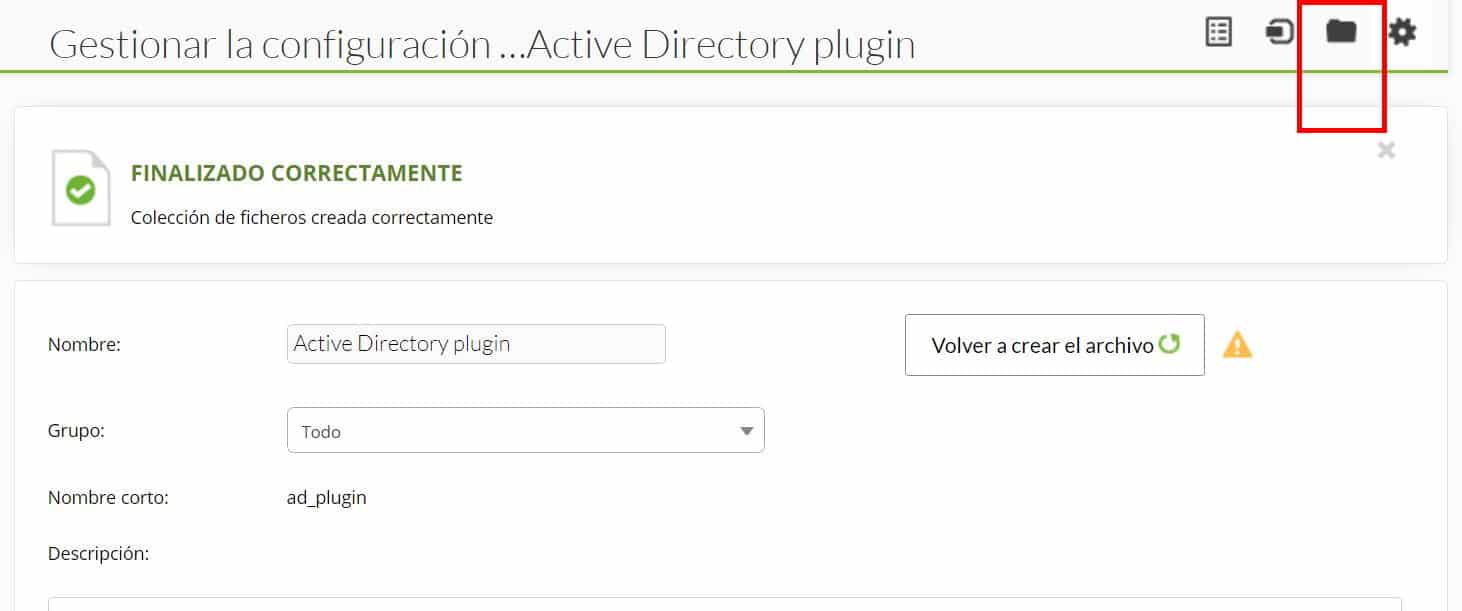
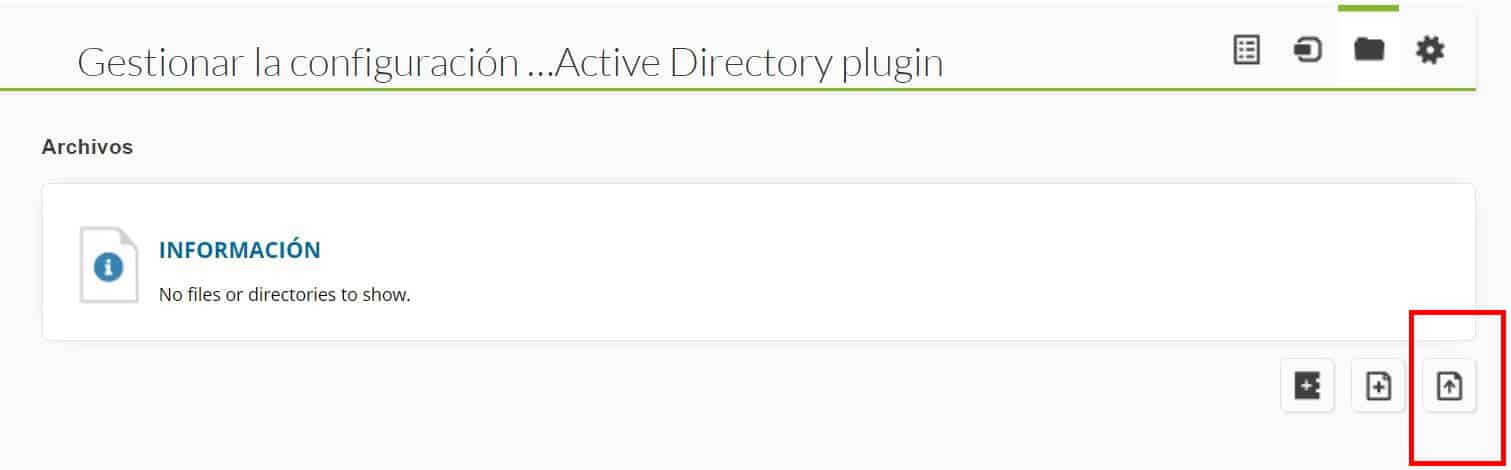
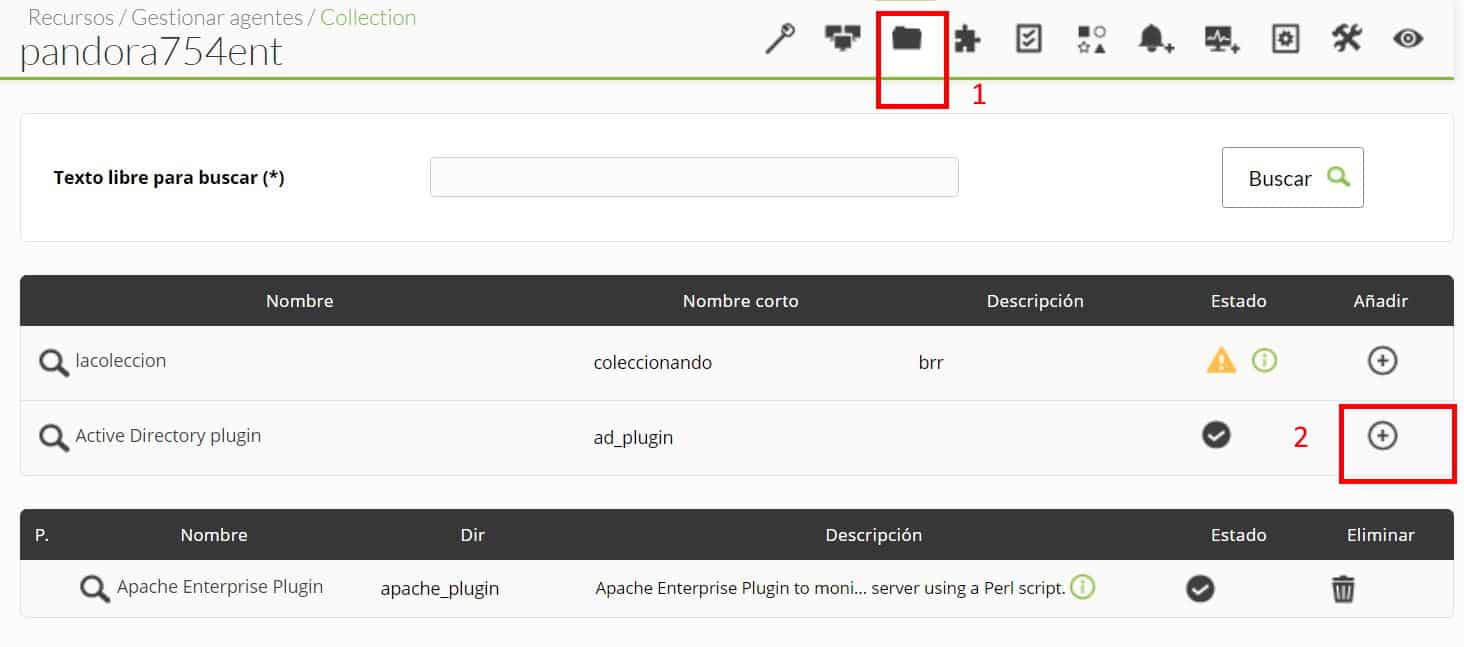
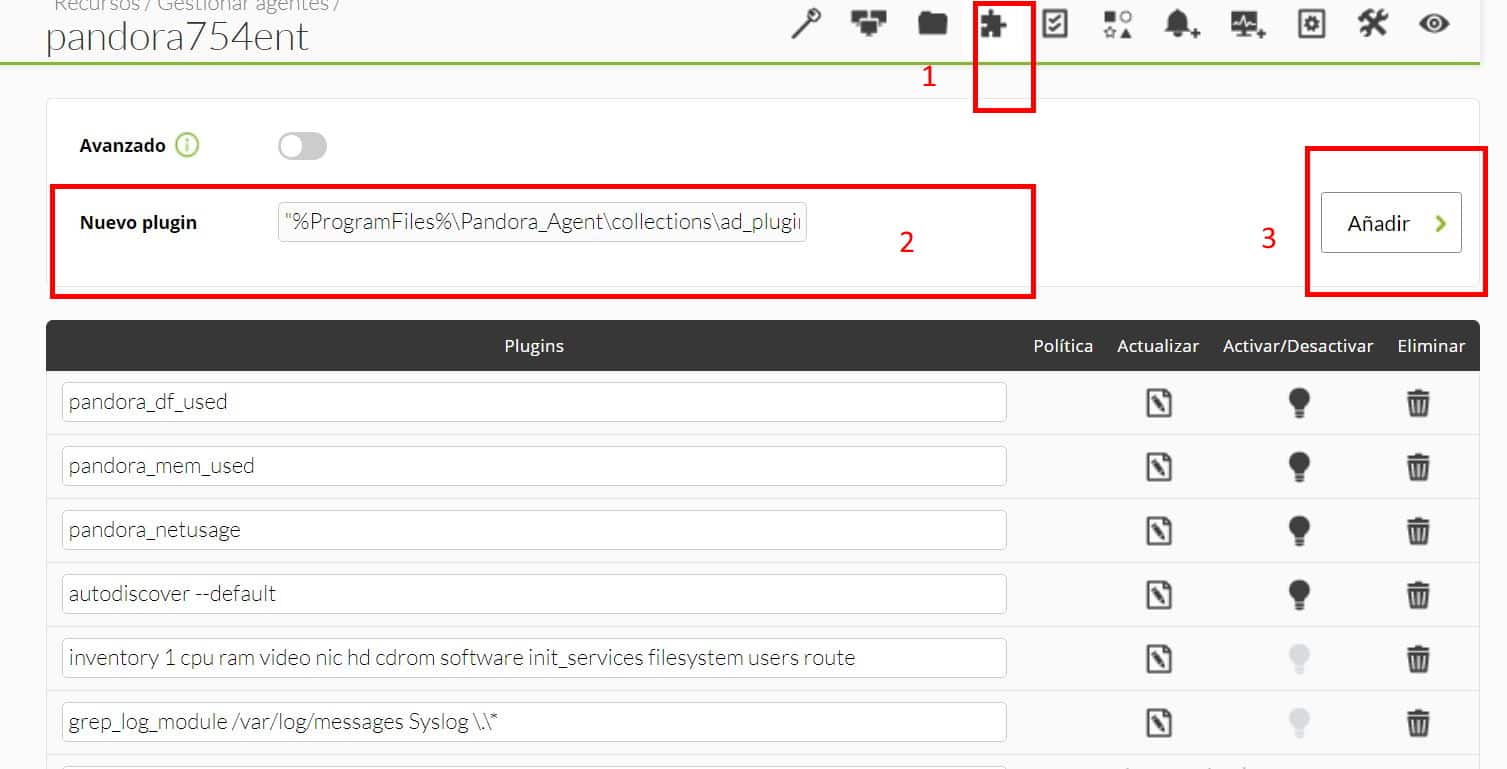
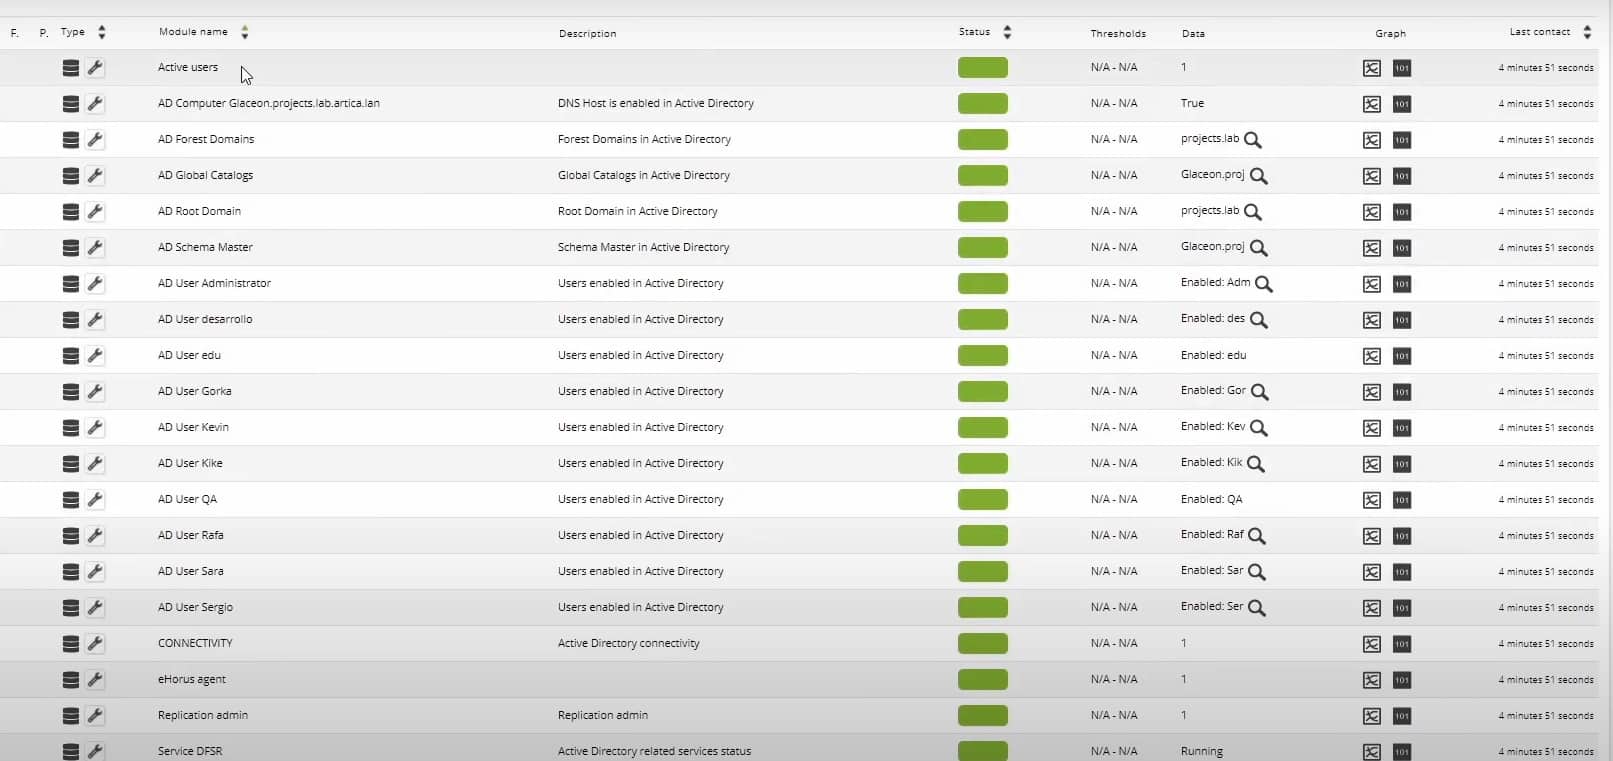

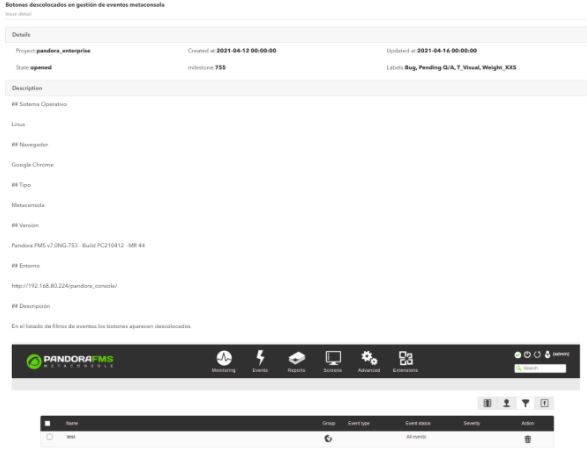


 Several Satellite Servers, reporting to a console in Azure