


Python Language: Graphing our monitoring data in GNU
Benevolent Dictator For Life
Chill out, we’re not here to talk about politics. Now that we have your attention, we have to clarify that Benevolent Dictator For Life is the actual title that Guido van Rossum, creator of the Python language, had until July 2018, when he decided to resign without leaving a successor, and without leaving clear policies on the future of the Python language. However, you shouldn’t think that the Python language has lost the course of its development or that it won’t continue.

We will not talk about the very long history of the Python language; we only bring you today a pleasant observation about the uses of this ” Python Language”.
Python language and monitoring software
In this blog we have talked very briefly about the uses of Python language in computing in this sector:
- This is one of the basic tools every GNU/Linux system administrator should have. Uninstalling the Python language in GNU/Linux causes severe problems!
- PostgreSQL allows you to save Python programs directly in the database and interpret them directly.
- Nagios, in its plugins uses it (apart from other languages).
- PRTG Network Monitor occupies it in its “sensors” (agents).
- To display the ambient temperature on an LCD screen by means of a Raspberry Pi.
- Our readers recommend it, read the comments of this comparative entry of Pandora FMS, Zenoss and Nagios.
And we leave it only up to here because it is time to show you a practical use of the Python language. If we write only “Python” you will know that we are not talking about a snake… 😉

Installing Python… or almost
In GNU/Linux systems, as we stated, Python comes by default and we will use the version available for Debian/Ubuntu, version 3.6.3 and in our case, although in several images that we will show it says “Anaconda, Inc” we actually use Miniconda… and no, we are not talking about snakes!

- Anaconda is a programming environment that takes up several gigabytes of hard disk space. It is used for scientific work and so-called “artificial intelligence”. It is so vast that the Python language itself is considered as one more component: Anaconda contains Python and not the other way around.
- Miniconda, as its name indicates, only occupies a few hundred megabytes with the basic libraries and the software catalogue. This is the one we use for our studies in computer science.

- Pip, on the other hand, is a lightweight package manager, with a very broad catalogue of utilities. As the previous ones we will have to install it in our computers. Pip is part of the “Cheese Shop”, the key name for the various “containers” of packages in Python.
- Windows Subsystem for Linux,or “for GNU”, will allow us to install pip on a computer with Microsoft® Windows 10®, as if we were in a GNU/Linux environment; in this link we can find the instructions and also the Python code to run Tetris®.
- It is necessary to say that Python can be installed in Microsoft® Windows 7 SP1® or higher, but we will not have the GNU utilities but we will have to have Powershell and WMI.
Installing pip and matplotlib
Having said that, we proceed to install pip in the following figure: the first instruction installs it (in our case it was already installed) and in the second instruction we ask to update (and you see that it places the last version, version 10):

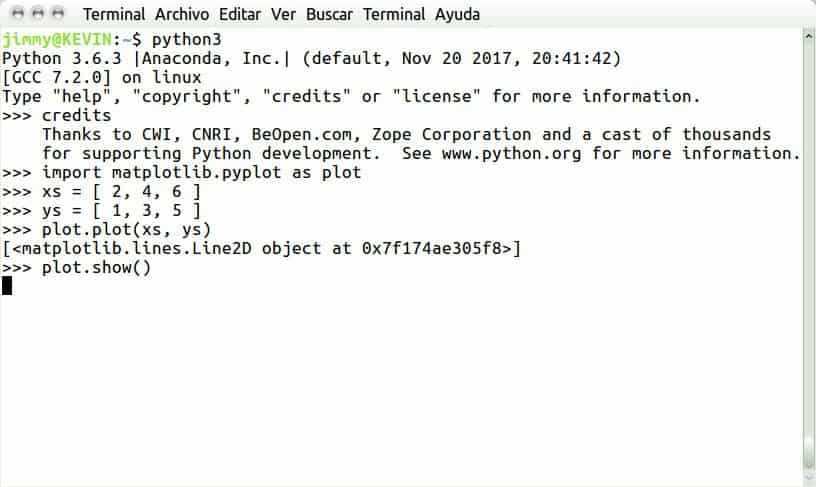
Then we run the Python interpreter where we will place, line by line, the following:
>>> import matplotlib.pyplot as plot

>>> xs = [ 2, 4, 6 ]

>>> ys = [ 1, 3, 5 ]

>>> plot.plot(xs, ys)

>>> plot.show()
You’ll see something like this in your terminal:
And it will open in a separate window a nice graphic and we can interact with it. We can change the legend, for example:


What have we done?
- In the first line we will tell Python to load (“import”) in memory the necessary libraries to graph.
- In the second and third lines we introduce arbitrary values in two single-row matrices.
- In the fourth line we graph in memory.
- In the last line we ask to show by screen.
Monitoring temperature on hard disks
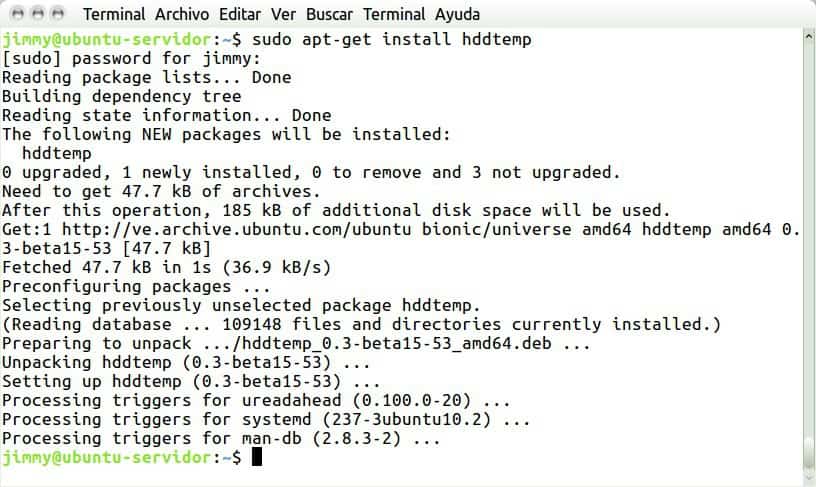
Now let’s do something practical, we will install the program hddtemp and every five minutes we will take the measurement of two hard disks, “a” containing the operating system and “b” containing the user data:

Graphically representing with Python
Now we will interactively introduce a small program with the temperature values obtained:
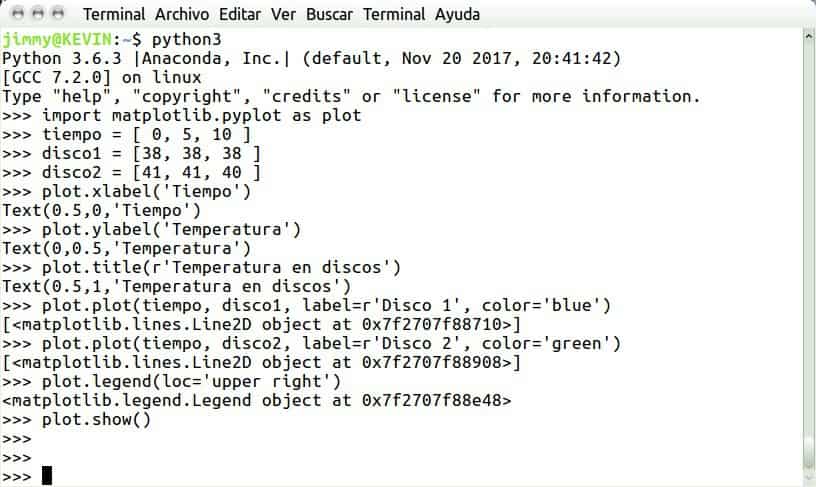
>>> import matplotlib.pyplot as plot

>>> tiempo = [ 0, 5, 10 ]

>>> disco1 = [38, 38, 38 ]

>>> disco2 = [41, 41, 40 ]

>>> plot.xlabel('Tiempo')

>>> plot.ylabel('Temperatura')

>>> plot.title(r'Temperatura en discos')

>>> plot.plot(tiempo, disco1, label=r'Disco 1', color='blue')

>>> plot.plot(tiempo, disco2, label=r'Disco 2', color='green')

>>> plot.legend(loc='upper right')

>>> plot.show()
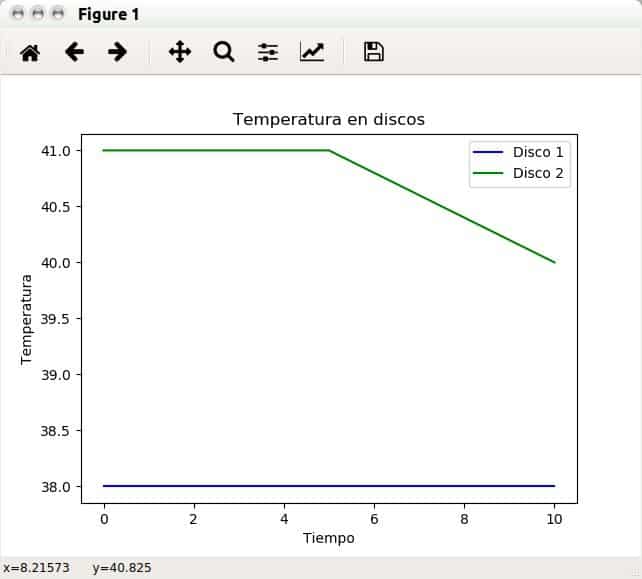
Of course, the next step would be to create a program with Python language that executes hddtemp every certain time, and to store in two matrices, then to load the data for the graph and instead of showing on screen, save in disk images numbered successively every hour; in order to do this instead of using plot.show() we would use plot.savefig(‘fichero-ene.png’) Do you want to go a step further?
Pandora FMS modules that use Python language
This is more advanced: to use Python language to do a complete job and deliver its results to a Pandora FMS agent.
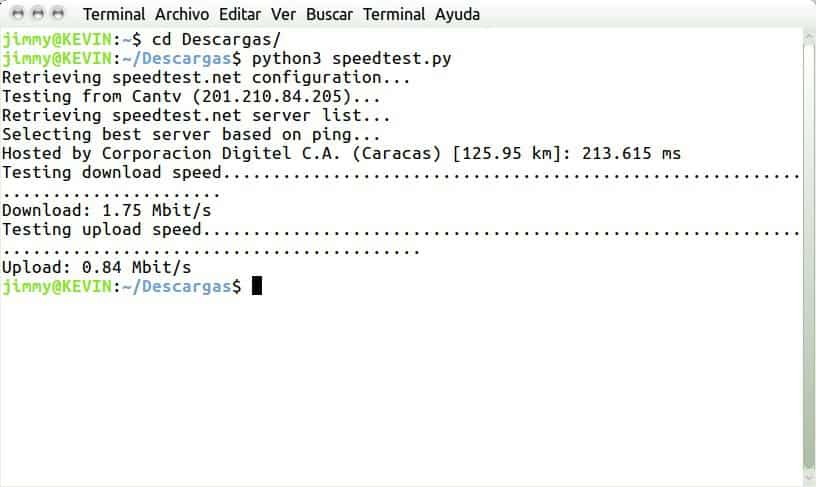
We have chosen one of the threads created in the Pandora FMS questions and answers forum where they use a Python program to deliver data to a plug-in, measuring the access speed we have to the Internet.
First we have to install the program with “sudo apt-get install speedtest-cli”. Then we’ll download the forum code we mentioned and save it with the name “speedtest.py”. In a first attempt we will simply execute the following, “python3 speedtest-cli”, in the folder where we downloaded the script:
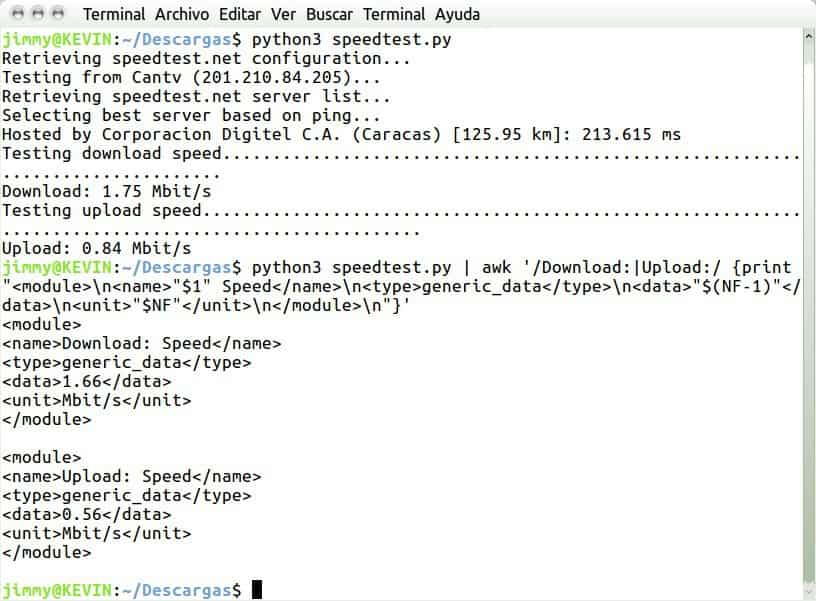
We can see its result and now we are going to use the standard input and standard output (STDIN, STDOUT), contemplated in the POSIX and that allows to pass values between different programs. The artifice we will use gets the previous output and “processes” it with these commands (a single line):
| awk '/Download:|Upload:/ {print "\n"$1" Speed\ngeneric_data\n"$(NF-1)"\n"$NF"\n\n"}'
The last thing we see is the format that Pandora FMS expects to receive to convert it into information and save it in the database. If you have any questions, concerns or comments, please contact us!
Present and future of Python
Since 2010, Python has progressively increased the percentage of search engine queries, reaching a score of 60 in 2018. 40% of the professionals use it and of those who don’t use it, 25% say they want to do it in the future! In the last year in America the number of searches on Python has surpassed those on Kim Kardashian, a popular television star on this continent. What do you think?
See you next time!

Programmer since 1993 at KS7000.net.ve (since 2014 free software solutions for commercial pharmacies in Venezuela). He writes regularly for Pandora FMS and offers advice on the forum . He is also an enthusiastic contributor to Wikipedia and Wikidata. He crushes iron in gyms and when he can, he also exercises cycling. Science fiction fan. Programmer since 1993 in KS7000.net.ve (since 2014 free software solutions for commercial pharmacies in Venezuela). He writes regularly for Pandora FMS and offers advice in the forum. Also an enthusiastic contributor to Wikipedia and Wikidata. He crusher of irons in gyms and when he can he exercises in cycling as well. Science fiction fan.


