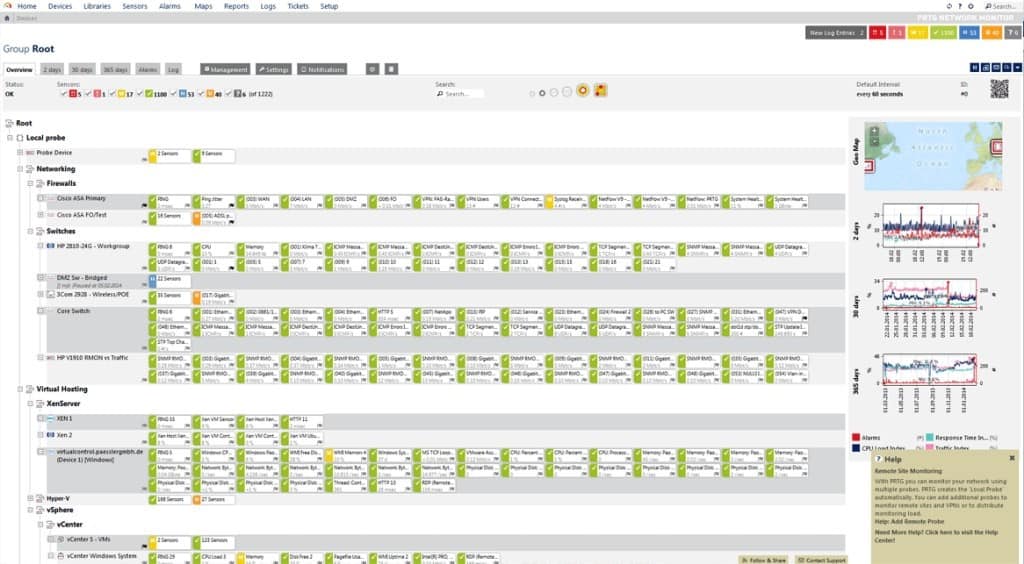
Introduction to PRTG Network Monitor
Previously in this blog we have published comparative articles about monitoring software such as Nagios or Zabbix, as well as about backup supervision and its definition, planning and implementation with software like Bacula and Veritas (monitored with Pandora FMS, of course), among many other topics. On this occasion we will talk about “PRTG Network Monitor” or simply PRTG as the company “Paessler AG” calls it on its official website. The company is based in Germany, in Nuremberg and they have been working since 1997. It is member of the “Cisco Solution Partner” program and the “VMware Technology Alliance Partner”, so we are talking about real heavyweights in the world of software and hardware (and their monitoring).
PRTG Features

Installation and induction to PRTG
Although they do not express it explicitly, they have a strong dependence on the Microsoft software because it only works under that operating system (they recommend “Windows Server 2012 R2”; for other editions, install the package “. NET framework 4.5” with its updated security patches). There are even those who say that it can be installed in virtualized environments and we respect that view.
It is not necessary to remember that the source code is completely proprietary (unlike Pandora FMS which is open source) and where they mention the use of open source code is just given the case one is willing to use the “PRTG Application Programming Interface (API)”: to do this, we must publish the script in GitHub -with open source code license- the add-on or supplement that we do and then register it to “Paessler AG” in the “PRTG Script World” and after the approval of the technical staff we will be allowed to publish an article explaining the use of the programmed entity. As you can see it is part of the program’s security and up to today’s date there are 208 scripts or sensors available.
The previous paragraph was completely necessary to introduce the term “sensors“, something very important in PRTG , as important as the money we are going to pay for such software. Let’s see the sensor definition:
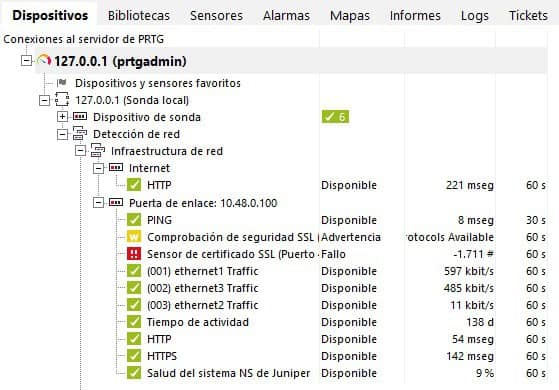
We define a sensor as an aspect that is monitored in a device. Therefore, a sensor monitors, for example, a specific URL, the traffic of a network connection, a switch port or the CPU load on a machine.
They have 200 predefined sensors and they estimate that each client uses between 5 and 10 sensors per device and, in turn, they introduce another new concept: the channels that depend on a sensor. Each channel corresponds to each of the characteristics of a sensor, for example if we have a hard disk free space sensor, the free space value in each of the hard disks present in a device counts as a channel. As a final consideration, there are sensors that have limits on the number of channels, such as the advanced Python, which has a maximum value of 53. From PRTG version 12 onwards, new sensors have been programmed and published:
- Host Vmware Status Sensor.
- WMI SharePoint Process Sensor.
- WMI Application IIS Sensor.
- SNMP Connections VPN Cisco ASA Sensor.
- SNMP Traffic VPN Cisco ASA Sensor.
- Interface WAN Fritz! box Sensor.
- Options Ping SIP Sensor.
- Google Analytics Sensor.
- WMI Ping Remote Sensor.
- Xen Host Sensor.
In the basic sensors there is coincidence: both Pandora FMS and PRTG have tools to monitor databases, applications, ping, ports, servers, etc. But with Pandora FMS we don’t have to worry about sensors or channels, nor be doing mathematical operations, we only add the number of devices (plus their agents, if necessary) that we must and/or want to monitor, and that’s it, fast and easy. Since Pandora FMS launched its first version in 2004 (being a new project that started from scratch), it responds to the needs for which there was no solution in a single software tool. Its evolution is based on the experience of both the Open Source community and the manufacturer’s customers: their requirements and demands have made Pandora FMS to adapt and grow, covering a wide range of needs for a wide range of users and always under official updates.
Data storage in PRTG
In Pandora FMS the collected data is stored in a MySQL database like Zabbix (and in the case of Nagios with the help of NDOUtils) but PRTG manages its own database, claiming that it is faster and represents less load for the system that runs the data collector. They ensure that the information is always available to export to different formats (PDF, XML and JSON) but it does not match the simple creation of a user with read-only rights in a database: That’s transparency in the information given the case an audit firm is hired to measure the total performance of any company’s computer network, you can extract data in real time from the data engine instead of waiting for a report to be generated and then process the results again!
User interface or “Front end”
Another additional difference PRTG has, is that it makes use of its own user interface program, which makes sense, given its strong dependence on Windows : only one compilation needs to be done for this operating system. It even has another application that launches the web console and in this case it does follow the same path chosen by Pandora FMS: it is much better to use the web browsers since every modern device always has one installed (or more). PRTG requires Google Chrome 49, Mozilla Firefox 45 or Internet Explorer 11 (or their latest versions). Also in the induction section we explain how to create our own API-based interface, thanks to other open source components.
Data collection and analysis engine
PRTG is programmed in “Microsoft Visual Studio ” and accepts the Python language for other components; Pandora FMS is written in Perl and PHP, its Linux agent also written in Perl, Windows Agent in C++ and Android Agent in Java. Pandora FMS also has an extensive plugin library aimed at fulfilling much more complex missions, mainly designed for the total monitoring of applications, both locally and remotely to the most important parameters of the most used applications in both the proprietary and open source software fields.
License types available in PRTG
There are four types of licenses available and they are mutually exclusive (which means that sensors don’t “add” to each other):
- “Freeware” up to a maximum of 100 sensors.
- “Trial Edition”: 30-day trial version with unlimited sensors; at the end of the trial period you can either purchase the following two licenses or opt for the “Freeware” and its limitation to 100 sensors.
- Special Edition
- Commercial Edition
In any case, the license value will always depend on the number of sensors, not the number of devices.
In Pandora FMS we have the “Open” version without any monetary cost so the software community can collaborate and even fork the source code to create their own special solutions. From all these improvements -and those specially developed by the Pandora FMS development team- some are chosen, debugged and thoroughly tested to publish the Pandora FMS “Enterprise” version. In fact, when you buy the “Enterprise” version you have direct communication with our team of professionals, ready to develop new solutions, as we always work with long-term commitments.
Agents in PRTG and Pandora FMS
In the section “Installation and induction to PRTG ” we mentioned briefly the Agents: both programs use them, but what is an Agent?
An Agent is software specifically compiled for the operating system of the device that we need or want to monitor (later we will see how to monitor the devices that use firmware instead of an operating system) that gathers and extracts information and then sends it when requested or when it has a scheduled agenda (event on request or chronological event). Both programs offer Twitter alerts for the latter case.
PRTG monitoring in Microsoft Windows
Windows offers “Windows Management Instrumentation” (WMI) (or Windows Management Interface) which is a set of extensions for the “Windows Driver Model” and which makes available a whole series of data and events recorded by the operating system kernel. However this method represents a cost both in the short and long term. In the long term, WMI queries generate a certain workload on the performance of the computer to be monitored, which we must always bear in mind.
In the short term, the installation cost is: if we have an “Active Directory” and a previously configured Domain, we will be able to perform the massive installation of said Agent in each one of the machines in an automated way (in Pandora FMS we have the integration with “Active Directory” from version 6). But if we are not keen,on this configuration, we will have to help in the creation of scripts in PowerShell so that from a repository we talk about it can be installed. Finally, if there are few computers, we can connect via Remote Desktop or in a very safe and low cost way with our eHorus software (we recommend the isolated execution version, since it does not require an installation routine as such) and from any web browser can perform this task.
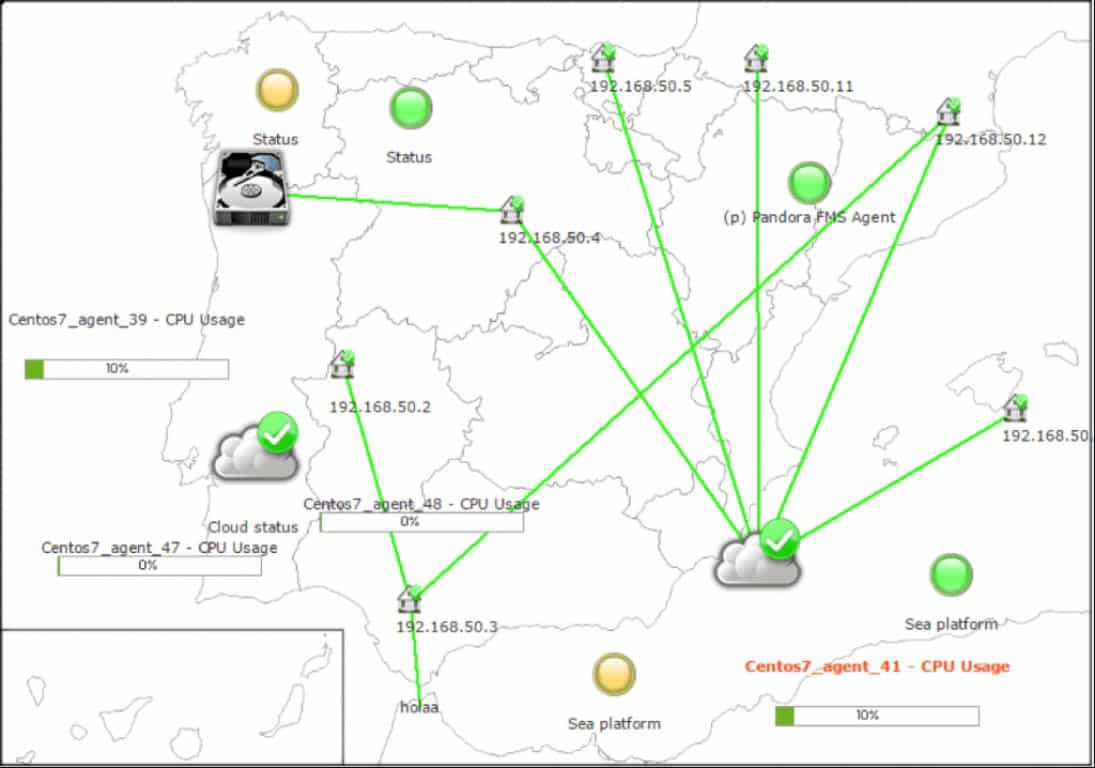
What in Pandora FMS we call Agent in PRTG is called Remote Probe and we need a Local Probe -which is installed automatically when we install the Central Server– and both programs will maintain permanent communication even if they are located in different local area networks (LAN) or even geographically dispersed. As a PRTG alternative, for Pandora FMS this does not represent any complication and when centralizing all operations is necessary, we can enable it with the metaconsole, the Central Server and its Satellite Servers.

One thing that we observe with concern in the case of PRTG is that the more sensors we need, the less options we have to group them in clusters : when reaching 5 thousand the problem gets complicated as they even confess on their website. For Pandora FMS the amount does not represent any hurdle!
In the following figure we can see the function of the Local Probe and its intermediation to communicate to the Central Server and the Remote Probes in PRTG :

In both programs, Agents or Remote Probes must be duly authorized by means of credentials and lists authorized by IPv4 or IPv6 addresses. In this link we have an example about how Pandora FMS can extract the CPU temperature information from a Windows device through WMI.
PRTG monitoring in Linux GNU

In this section, both programs work in the same way: by means of SSH, that is, a secure and encrypted tunnel to prevent interception and/or modification by third parties. But since not everything in the garden is rosy, we must also consider which Linux distribution we are using, in order to guarantee the programs that are installed are able to return the values we want to collect. Today, due to the computing power of modern computers and hard disk capacity, most of them will be pre-installed and generally we shouldn’t have any problems in this regard.
Monitoring with SNMP
SNMP is the abbreviation for “Simple Network Management Protocol” (for a detailed description see our dedicated article). This protocol allows the standardization of information – that is, data in a predefined form – thus allowing us, for example, to perform an automatic discovery of devices in the local area network that support this feature (network detection).

It is necessary to point out that for both Windows and GNU/Linux we will have to install the SNMP service or “daemon” – allowing us to offer the public values generally with the V2c standard, since the V3 standard offers the benefit of communication encryption but requires additional work to configure it as well as a load added to the machine that’s going to be monitored. Again, we emphasize: if we have “Active Directory” and a Domain installed, we will use “Group Policies” or GPO to install this service in an easy and practical way.
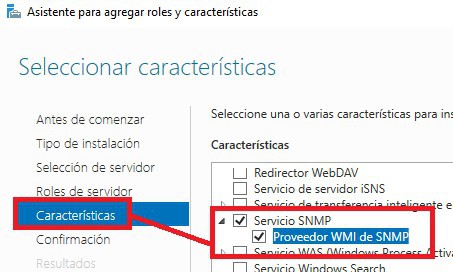
Special Windows dimensioning: PRTG requires that when installing the SNMP service also be installed the “WMI Provider SNMP” which will allow scripts or scripts to be made through WMI, which as we have already explained have an operational cost on the performance of the computer. Finally, Microsoft has always been known for introducing its own closed and proprietary standards to open standards.

At this point, since we will already have configured the credentials in our Central Server, we will access the computers and establish the extraordinary events that we want to be informed about, this is known as “SNMP trap alerts”: it will simply not be necessary to ask the device “how it is”, it will warn us itself in the case of it “not feeling well”.
Monitoring of “Active Directory”
This is the point in which PRTG stands out over Pandora FMS. Which is the Active Directory replication error sensor and they strongly recommend monitoring the “high performance impact of your monitoring system”. This is because you perform the following tasks:
- Prevention of error replication.
- Identification of inactive and disconnected users.
- Number of consecutive synchronization errors.
- If the source has been deleted.
- If the programmed synchronization has been disabled.
- Time of last attempt at synchronization.
- Result of the last synchronization.
- The last time a successful synchronization was performed.
- Number of aligned synchronization sequences.
- Number of pending replication operations.
All this is possible through the “. NET framework 4.5” which is the programming environment of “Visual Studio” and allows programming on “Active Directory” in a relatively easy and fast way.
Conclusions
While the control and management of Microsoft Windows Active Directory by PRTG offers a slight advantage, it does not compare in any way to the fact that Pandora FMS runs in GNU/Linux environment with Perl language, thus enjoying the multiple advantages of open source code. If we also add that Pandora FMS hosts its data in MySQL, without anything to hide, and with the possibility of replicating said databases for backup purposes and possible audits, we conclude that Pandora FMS offers the best option against the so-called “Manolo V1.0” but at an enterprise level: a company should not rely solely and exclusively on another company to monitor its computer resources, it should have the alternative of being able to solve the problem.
“Paessler”, “Paessler The Monitoring Company”, “PRTG”, “IPCheck”, “Site Inspector” y “PhotoMeister” son marcas registrada de “Paessler AG”. Otras marcas registradas son marcas de sus respectivos propietarios. Esta información legal está publicada en el siguiente enlace web:
https://www.paessler.com/company/contact#imprint
All the images used here have been captured and/or modified under our authorship and are under license. Creative Commons Attribution-Share Alike 4.0 International
About Pandora FMS
Pandora FMS is a flexible monitoring system, capable of monitoring devices, infrastructures, applications, services and business processes.
Of course, one of the things that Pandora FMS can control is the hard disks of your computers.
Would you like to know more about what Pandora FMS can offer you? Discover it by entering here: https://pandorafms.com
Or if you have to monitor more than 100 devices you can also enjoy a 30 days FREE DEMO of Pandora FMS Enterprise. Get it here.
Also, remember that if your monitoring needs are more limited you have at your disposal the OpenSource version of Pandora FMS. Find more information here: https://pandorafms.org
Do you want to know more about Pandora FMS?
Pandora FMS’s editorial team is made up of a group of writers and IT professionals with one thing in common: their passion for computer system monitoring. Pandora FMS’s editorial team is made up of a group of writers and IT professionals with one thing in common: their passion for computer system monitoring.


