
For many computer scientists, Raspberry Pi is a very well known device in terms of programming.
They are economical, they use very little energy and are very flexible, for some people it might remind them of the description of Pandora FMS, for those reasons both are complementary.
Monitor Raspberry Pi with RPi-Monitor
n this blog we have used these devices to create an interactive dashboard on a TV, to monitor bandwidth at home and in companies (in this last article we have described in great detail how to install it), this time we will learn all about Raspberry Pi monitor with RPi-Monitor, but it will not be enough because Raspberry Pi actually have hundreds of different uses! Let’s take a look.
Raspberry Pi: History and introduction
In Wikipedia we can find all the details about Raspberry Pi, we would like to highlight the following:
- Although its hardware is privative and made in China, its operating system and applications are completely Open Source.
It has many operating systems, a well-known one that is derived from Debian is Raspbian.There are also Pidora (based on Fedora), SUSE and Arch Linux, based on ARM (see the following point).
Its Central Processing Unit (CPU) is its Reduced Instruction Set (RISC) Computer Architecture called ARM (Advanced RISC Machine), 32-bit and now 64-bit on the Raspberry Pi 3 model. This architecture allows for the saving in transistors, thus resulting in a small processor size and consequent energy savings.
A special feature of Raspberry Pi is that they do not have a real-time clock (RTC) so they depend on the communication with the outside world through the Network Time Protocol (NTP) in order to record the date and time of their operations, which is very important when monitoring. They always start with the date of November 30, 1999 and if we are in a “hostile” environment, where they are unable to connect to any local area network, we can buy a PSTN such as this one. Again, if we don’t have the exact date and time, we’ll be in trouble when it comes to monitoring.
Do you want to discover the most flexible monitoring software on the market?
Pandora FMS Enterprise is capable of monitoring devices, servers, applications, services or business processes. What are you waiting for to get to know it better?
If the size and efficiency is already impressive, there is also the Raspberry Zero model, even smaller, more affordable but of course with different connectors: when it comes to video it comes with miniHDMI instead of HDMI, for example ( there is no Raspberry Pi with the old VGA analog connector).
They have no power source of their own, but that doesn’t mean that they don’t overheat (since every converter from alternating current to direct current produces heat by infrared rays) and that is one of the points that we will monitor in this article. RaspBerry Pi are powered by a 5-volt microUSB connector or by General Purpose Input/Output (GPIO); connectors; the latter will also be used to connect an RTC to maintain time and date when turned off, if necessary.
Depending on the model, it has different input and output devices: Ethernet connector, wireless network, USB port, Bluetooth, audio output, video output, etc.
The RAM memory is shared with the video memory, it can bring 512 or 1024 megabytes but cannot be expanded.
The storage is external via USB card or SD card, it is recommended 8 gigabytes at least because we can allocate 5 gigabytes for the image of any operating system and 3 gigabytes for applications and data. Once integrated into the firmware, the Raspberry Pi will start for the first time with a mini operating system that will allow us to install the desired operating system.
The Raspberry Pi comes naked, so to speak, not only for its economy but also for its flexibility: each user will have a different use and will connect the accessories needed. Generally, manufactured by third parties, we can find Raspberry Pi casings of all kinds. On online sales websites they sell sets of casings, cables, memory cards, sensors, either combined or even each component separately. Each set of accessories is designed for a specific use: industry, learning, scientific uses, etc.
RPi-Monitor
RPi-Monitor is open source software written in Perl language by the Frenchman Xavier Berger. It was created as a result of the need to monitor these useful devices, which were originally designed for teaching computer science, but nevertheless, companies and industries noticed their great capacity to adjust to production and manufacturing, as well as to commercial activities. It is a very good idea to keep an eye on these economical devices, which, are easy to replace because of their cost, in order to always be online and to avoid problems with our work when predicting a malfunction or misconfiguration.
Since version 2.6 (year 2014) an official service that allows you to install and update a large amount of software for Raspberry Pi is available at the software store called “The Pi Store”. We will need to install the “pistore” software (in fact it is already installed by default) but in case of doubt we can always run it on the command terminal sudo apt-get update && sudo apt-get install pistore.
Installing RPi-Monitor on a Raspberry Pi (Monitor Raspberry Pi with RPi-Monitor)
We will start from a Raspberry Pi configured as described in this article (we can connect to the Raspberry Pi via SSH, web interface or even by Remote Desktop with eHorus by downloading the official Raspbian packages, on request). To install this software we can either download it directly from its version control webpage at GitHub, add an additional repository to the Raspbian of Raspberry Pi or from the official Raspberry Pi store that we have mentioned earlier. Anyway, we must first install the following libraries (dependencies) for version 2.8:
- librrds-perl
- libhttp-daemon-perl
- libjson-perl
- libipc-sharelite-perl
- libfile-which-perl
- aptitude
Basic operation
RPi-Monitor only needs the Perl language. It saves the data in a format called Roun-Robin-Database which is simply one or more files that are reformatted and subdivided into time periods and fields to be saved with the same fixed size. The detail lies in using a cursor pointing to the last active record to record the next one and when it reaches the end of the file it will begin to overwrite the first record.
So with this approach we can determine the time to monitor (for example, the data of the last week or month) safely knowing that we will never exceed the storage capacity due to the circular strategy of writing.
Given the electronic simplicity of the Raspberry Pi, there is no need to save more configuration, but as it is written in free software, we can create a Perl agent to back up data in a remote database (such as MySQL, for example) by reading all the records and comparing each record by date.
Aspects to be monitored
RPi-Monitor is capable of tracking packets sent and received by one or more network interfaces installed on a Raspberry Pi. As well as the use and status of storage devices (SD or USB cards), swap memory, RAM memory, running time and even the temperature of the CPU. In the case of the operating system it informs us about its version and whether there are updates to be installed, this is quite important because it corrects vulnerabilities to protect our devices from potential attacks by people or other malicious organizations.
Hey, if you are interested in monitoring, you can do it for FREE using the best software on the market
How?
Sign up here and I’ll tell you:
Web interface
The user interface is completely independent from the monitoring software and requires a Ngix web server, in order to give secure access to our Raspberry Pi with the help of SSL, htpasswd and shellinabox and the generation of the required certificates. This scheme of work would be necessary if our devices were exposed to the Internet, since no credentials are required to view the data collected. We must emphasize that all data is readable, not in real time (we must refresh the website if we want to see updated data), it has no binding data beyond the IP address and it is not very attractive to any attacker, however, our privacy and/or that of our clients/users has to be extreme in any case and at any time.
Configuring RPi-Monitor on a Raspberry Pi
We will quickly go over the main values to be changed according to our needs, for all the details we will have to consult both its repository in GitHub and its blog.
- Change listening port: modify the file
/etc/rpimonitor/daemon.confand change the default value that is 8888 to the value needed.
To monitor the wireless network card (Wifi), like the previous point we must modify the same file and write the following line #include=/etc/rpimonitor/template/wlan.conf removing the numerical symbol at the beginning of it.
To monitor the USB drives go to the file /etc/rpimonitor/storage.conf and also write #include=/etc/rpimonitor/template/storage.conf (additional configuration is required depending on the number of connected volumes).
For other services the Raspberry Pi has the clever programming of the RPi-Monitor: it has a chart of the most used ports and just by writing #include=/etc/rpimonitor/template/services.conf we can include programs such as PostgreSQL or MySQL.
Finally we will be able to customize the form and order of the monitored data, so if we want it to show us the status of MySQL first and then PostgreSQL add the following lines:
dynamic.1.name=mysql

dynamic.2.source=netstat -nlt

dynamic.2.regexp=tcp\d? .*:(3306).*LISTEN
dynamic.2.name=postgresql
dynamic.2.source=netstat -nlt
dynamic.2.regexp=tcp\d? .*:(5432).*LISTEN
As we can see, we only have to carry the consecutive numbering of each service to be monitored and to be sure, we specify the port of each application.
To finish the configuration we restart the RPi-Monitor with sudo systemctl restart rpimonitor. Then in order to know its status instead of “restart” we will set “status”, “stop” in order to stop the service and to start it “start”.
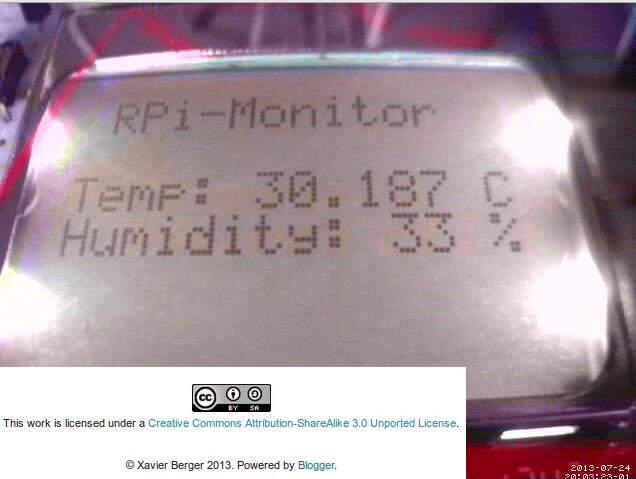
An LCD screen on Raspberry Pi?
Raspberry Pi monitoring can go beyond remote monitoring and can even provide data locally and directly. If we buy a PCD8544 LCD screen (quite popular in mobile phones), we connect it to one of its GPIOs and with a little Python language we can display the current temperature of the Raspberry Pi on the screen. We must be careful to replace “localhost” with the actual IP address (or even the web address) and port 8888 to the port we have configured:
#!/usr/bin/env python

import httplib, time, os, sys, json

import pcd8544.lcd as lcd
Start the connection to the integrated web server of RPi-Monitor
# remember to change localhost and 8888 to the appropriate values
connection = httplib.HTTPConnection(“localhost”, 8888)
# Request the dynamic.json file (json data format)
conexion.request(“GET”,”/dynamic.json”)
# Server response
answer = connection.getresponse()
# for a correct answer get the data themselves
if ( answer.status === 200):
data = answer.read()
# Open a function to analyze the data, to communicate
# and turn on the display to display the data
screen = json.loads( data )
lcd.init()
lcd.backlight(1)
# For example, get temperature:
rpi_temperature =[‘temperature’] display
Close the connection to the integrated web server of the RPi-Monitor
conexion.close()
# and turn off lcd screen
lcd.backlight(0)
Using Raspberry Pi with Pandora FMS
Pandora FMS is known for its flexibility and we will be able to create a plugin to import the data of our Raspberry Pi.
A script in Python language could be the previous one used to show the monitoring data on LCD screen but redirecting the data to the plugin created for this purpose; in this article we can get more details about the creation of plugins in Pandora FMS.
Peripherals on Raspberry Pi: humidity and ambient temperature
These are two variables that could affect, among others, our server room. Although this is not part of the Raspberry Pi monitoring itself, it can be integrated into the RPi-Monitor if we purchase a DHT11 for measuring ambient temperature and a DHT22 for measuring ambient humidity.
For this we will need experience in electronics, as additional components such as a resistor, wiring and a board are required to house the components. That’s why this part is to go over concepts: we downloaded the drivers for these components from Adafruit and we will add the following in the RPi-Monitor configuration (replace”.ene.” by the following numeric value in the configuration file):
dynamic.ene.name=humidity

dynamic.ene.source=Adafruit_DHT 11 27

dynamic.ene.regexp=Hum = (\S+)

dynamic.ene.postprocess=

dynamic.ene.rrd=GAUGE
We will also need to add it so that it also displays it on the integrated web server:
web.statistics.1.content.ene.name=humidity

web.statistics.1.content.ene.ds_graph_options.humidity.label=Humidity (%)

web.statistics.1.content.ene.ds_graph_options.humidity.yaxis=2

web.statistics.1.content.ene.graph_options.y2axis={ position: "right", min: 0, max: 100 }
Conclusions
Due to the wide variety of hardware that can be connected to Raspberry Pi in order to Monitor Raspberry Pi with RPi-Monitor and because it works with free software, the combinations are unlimited for every need and taste and we have adapted it to the set of statistics that we must monitor in a local area network to facilitate our daily work. So this is it, this is our article on how Monitor Raspberry Pi with RPi-Monitor.

Programmer since 1993 at KS7000.net.ve (since 2014 free software solutions for commercial pharmacies in Venezuela). He writes regularly for Pandora FMS and offers advice on the forum . He is also an enthusiastic contributor to Wikipedia and Wikidata. He crushes iron in gyms and when he can, he also exercises cycling. Science fiction fan. Programmer since 1993 in KS7000.net.ve (since 2014 free software solutions for commercial pharmacies in Venezuela). He writes regularly for Pandora FMS and offers advice in the forum. Also an enthusiastic contributor to Wikipedia and Wikidata. He crusher of irons in gyms and when he can he exercises in cycling as well. Science fiction fan.