In this article, we will carry out another comparison that we hope will help you make a decision. Nagios is one of the tools with a long history of comparisons. For many years, it has been the leading monitoring software, but it is now losing ground to other alternatives, with Zabbix being one of the most popular.
The main goal behind our comparisons is to give an objective point of view on the compared tools, as well as adding Pandora FMS into the mix, so you can also check the features and capabilities this tool—our tool—has (if we can be allowed the license to do so).


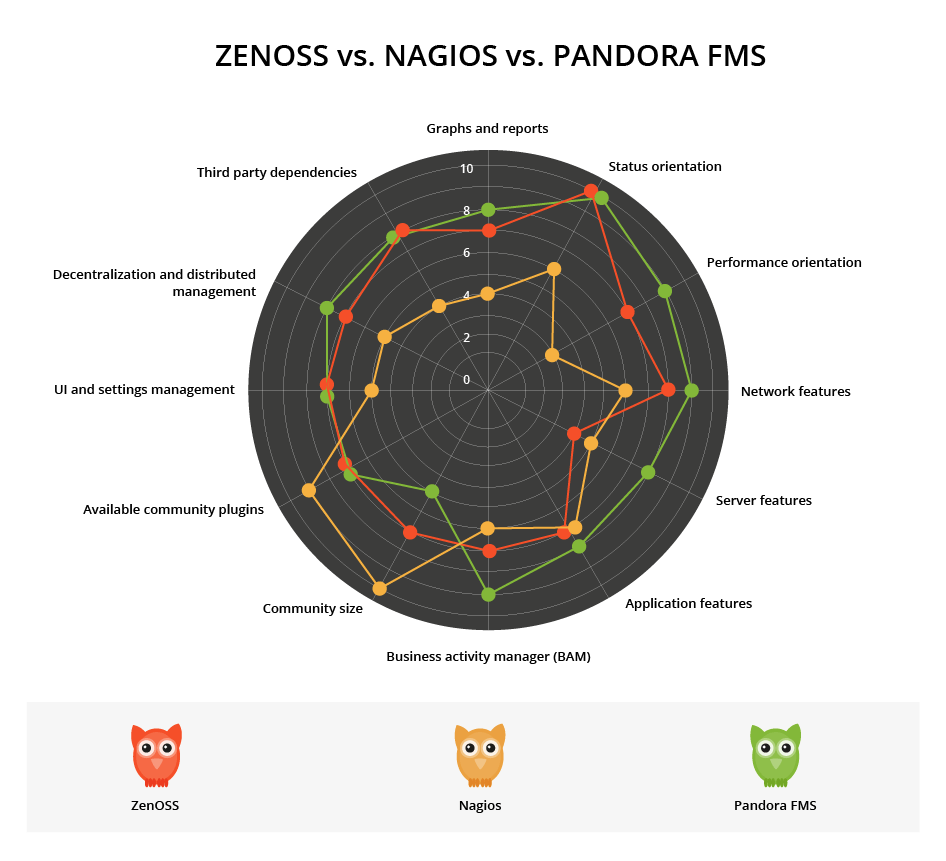
The Final Result
If you are in a rush, let us show you before you start the result of our analysis. If you want to go into detail, we invite you to keep reading through the full article.
How was this comparison made?
In order to make this comparison, we’ve set up two devices in our lab with one of the tools installed on each. From there, we’ve begun to monitor our systems and we’ve tested the features we believe to be most relevant in terms of monitoring software.
Zenoss vs. Nagios vs. Pandora FMS
ZenOSS represents an alternative to NetCool, rather than an alternative to agent-based solutions such as Nagios, Zabbix or Pandora FMS. Located in Austin, TX, ZenOSS strives to be the innovative leader in an IT niche that is quite worn out: ITOM (IT Operations Management), betting for something that back in the day someone said would be the future: agentless monitoring.
It’s true that the use of agents represents a certain resistance: in the end, you do have to install them. For this reason, on many occasions, the use of agents represents a great disadvantage because of this initial deployment. What is usually left silent is that for supposed agentless systems—such as NetCool or ZenOSS—to properly work, you’ll need to set said systems up, and in many cases activate or install software components on our systems which we previously didn’t have. It’s a lot of work to only obtain a fraction of the information we could retrieve from agents. In agentless monitoring we must always bear in mind the following factors that on occasions can generate a lot of issues: the system load is equal or superior to the same with an agent and the security can be compromised, since it requires an external system to access the host device in order to extract information, whether this be via WMI, SNMP or remote executions (generally SSH). In order to obtain certain information, there’s no other option but to run commands on Windows, activating the WinRM subsystem that allows for remote connections. NetCool, for example, copies a type of “customized” agent every X amount of time, runs it, and then deletes it. Against this, Pandora FMS’ agents don’t allow for incoming connections, this means that it’s much safer than activating remote execution on each server.
Zenoss vs. Nagios regarding low level settings: a rough start.
Although ZenOSS is sold as a very visually driven tool, the truth is that the installation and post-configuration processes are filled with text files, arcane terminal commands, and many interactions with different pieces of the operating system and third-party applications alike. You only need to quickly scan their documentation to realize that there are more screenshots of the console and text files than those corresponding to visual screens. In this sense, ZenOSS is worse than Nagios, since this contender, even though it also has a complex set up process, it’s still quite centralized. There aren’t as many different places to fiddle around with. Compared to Pandora FMS it has a centralized system and a much simpler design. One wonders why the people that develop ZenOSS still boast about being the simplest monitoring tool in terms of use.
If we visit this link (which lead to the ZenOSS official documentation) we can see how complex it really is, and the number of files, console commands and different subcomponents that we need to tangle with.
Many users run from complex setups. Sometimes it’s true that a good regular expression can be the most compact and precise solution, but ZenOSS goes way overboard. Back in my college days, I’d heard people talk about the Inverse Polish Notation used to define an operation; ZenOSS uses this for postprocessing values. Being blunt, you may have to have a university degree in order to use ZenOSS.
Flexibility and growth in monitoring: monitoring for everything. Yes, everything; thanks to Zenpacks.
It’s easy to say that there’s monitoring for anything… anything that has a ZenPack that is. If not, you can make a ZenPack yourself, as long as you thoroughly study all the documentation on how to become a ZenPack engineer. Unlike Nagios or Pandora FMS, in order to implement small checks, we have to do so following some very strict guidelines and learning a technology that’s pretty limited.
This last detail, combined with the absence of agents makes obtaining information from systems when needed an uphill climb. The ZenOSS manual explains how to connect to those systems using the terminal and how they should be configured in order for them to report information remotely. It’s true that in an ideal world if all systems were configured properly, they could always be monitored remotely, but the real world is filled with problems and overall with the need to take better advantage of our time, instead of having to add configurations to the snmpd.conf file on our Linux systems.
Opposite to the cheerful anarchy related to Nagios, and the flexibility Pandora FMS offers, ZenOSS is known for being rigid in how it’s proposed to users. It’s true that once the monitoring method is defined, along with the model and hierarchy system for items, information fluxes are identified, different data sources are configured and the rest of the hundreds of details are finely tuned; ZenOSS can be closer than the other two when it comes to being the ‘Holy Grail’ to “Root Cause Analysis” (detecting what issues there are, and their causes). This is something that has been pursued so long in monitoring, but with the cost of having a very rigid corset that prevents an operations team from performing calmly. Apart from the ZenOSS software itself, you’ll need a small development team to help you make your own ZenPacks and a team of engineers that can take care of the monster. In order to do this properly, just like it’s recommended to be done. Of course, there are always intermediate paths, shortcuts and in very extreme cases, users can even “cut corners”.
Zenoss vs. Nagios: Tending to third party integrations.
Integrations with third-party tools are vital to any monitoring tool since one of the main goals behind these tools is to be able to include—overtime—the most amount of tools to monitor on the same monitoring panel. In ZenOSS we highlight a large amount of rigidness when it comes to integrating the tool with third-party applications, both in the way to obtain the information (via complex processes, defined by the user, with previously existing tools) and the way they produce results (notifications) in third parts, reusing third party technology. The tools that ZenOSS has—because, in theory, it can do anything—are rigid and systematically establish how everything is supposed to be done, meaning that simple tasks—such as interacting with an external database to notify an issue—can be much more complex than a simple 4 line script, like it would be on Nagios or Pandora.
Nevertheless, it’s true that ZenOSS has a rest type API (JSON API) which allows integrations much like Pandora FMS would, which are much superior to what Nagios allows.
Event management
It’s quite obvious that both ZenOSS and Pandora FMS have been “inspired” by many of the same sources when it comes to working with events; something that Zabbix, Nagios nor many other tools have done. The influence that event management from traditional platforms such as Tivoli or Patrol have had is noticeable: automatic validation, event lifecycle management, workflow iterations, notifications, and correlations are some of the things that both ZenOSS and Pandora FMS solve in a very similar fashion.
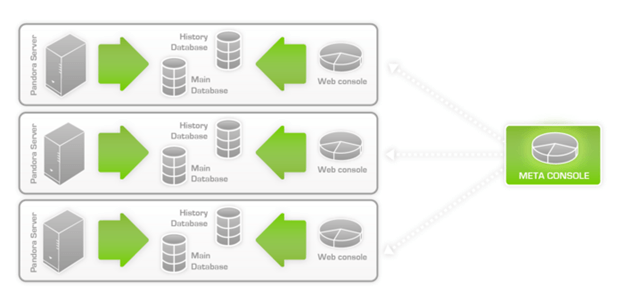
Zenoss vs Nagios when it comes to scaling and architecture
Nature is wise. That’s why we can find so many curves in nature: evolution makes the shapes that best adapt to the environment survive. Because of this, we can find similar designs in different points of the planet. The same thing happens with the architecture meant for larger environments on ZenOSS or Pandora FMS.
The philosophy regarding large deployments (8000 nodes or more) is similar between Pandora FMS and ZenOSS, leaving Nagios out of the game. Both ZenOSS and Pandora FMS reassure, using success stories with names and faces, the success of their productive environments with dizzying digits. Nagios, is yet again left out of this category.

Zenoss vs nagios in graphs and reports
When it comes to graphs, ZenOSS and Pandora FMS are quite similar, offering the final user not only the capacity to view data graphically but also to use the graphic motor and the stored data as a real-time analysis tool, something way over what Nagios can do in this aspect.
From the report perspective, again ZenOSS applies a philosophy that is too technical. It allows the administrator to create reports based on item “types” and filtering results through TALES expressions (something similar to a regular expression), offering reports that are most useful to technicians. From this point of view, ZenOSS offers an interface for technicians and reports for technicians. It fails, since it doesn’t allow for a user without deep knowledge of the system to generate a report, nor for said reports to be interpreted by a manager or final customer. Pandora FMS is thought out to offer an interface for report creating that is meant for end customers and the final reports can be presented as-is—directly in PDF format and in the customer’s inbox—since it was the main purpose behind the report system from the beginning. Nagios in this sense is again far behind both ZenOSS and Pandora FMS.
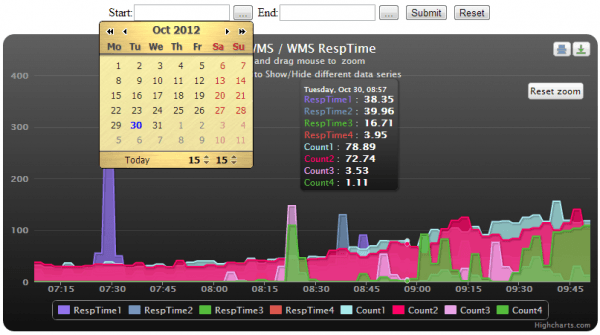
Snapshot of a graph in Zenoss Dashboard:
Snapshot of a graph in Nagios dashboard:
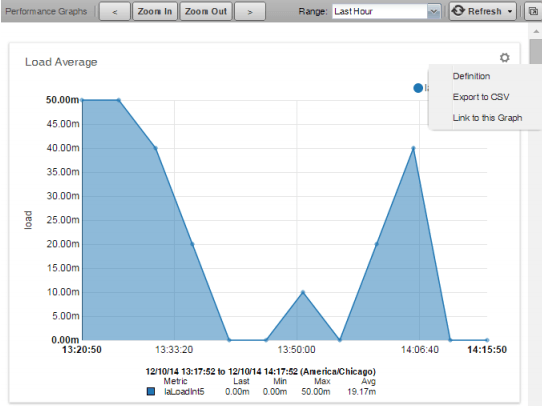
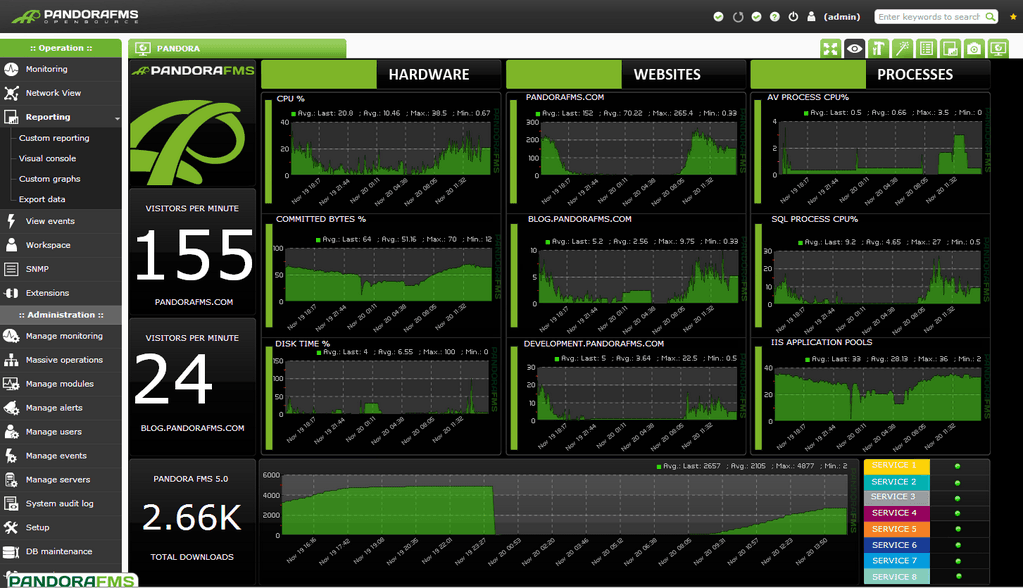
Snapshot of a graph in Pandora FMS dashboard:
Unified Monitoring
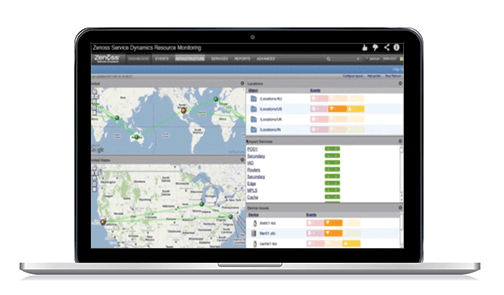
This is one of the strong points ZenOSS has. Its distributed architecture and combination of business oriented tools allow it to be used in complex networks, that are geographically distributed, also monitoring business applications, servers, virtual environments; operating in hybrid cloud/local environments.
It offers different dashboards and summary screens that allow hem to show off these capabilities, similar to those on Pandora FMS but much superior to the poor integration that Nagios has which cannot aspire to monitor complex networks, work applications or hybrid environments.

Predictive monitoring.
Just like CA and IBM systems, ZenOSS favors that which they call “predictive analysis” and heuristic root cause detection systems. The magic, in this case, is based on the prior definition and classification of all the assets in a series of related “types”. It’s a very well designed system that provides a necessary order many times, but that also makes deployment very complex, forcing those who are deploying the monitoring to be omnipotent and to know the system they want to monitor very well, something that in the real world—unless you have a small system—doesn’t really happen too often.
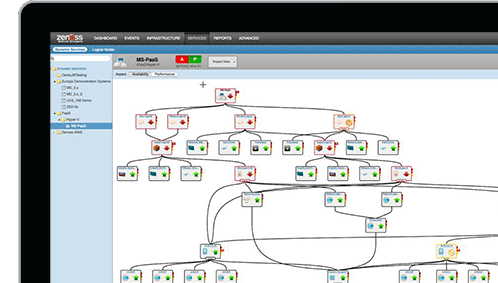
The dependencies graph—part of the magical essence to root cause analysis—is a really beautiful flash-based graph that allows users to see how systems are connected, but it doesn’t’ show any additional information apart from if the systems are alive or not. Clicking on it won’t take you anywhere either, in other words, it’s not really useful for daily tasks.
Final thoughts on the Zenoss, Nagios and Pandora FMS comparison
ZenOSS’ GUI is visually pleasing but it ends up being a bit tiring for proper daily use. It’s not fluent enough.
The automatic discovery feature that they promise only works correctly for network environments with static paths, file systems, and network interfaces. Everything that isn’t obvious has to be described “by hand”. Since it’s remote, it usually ends up being twice as tedious as if it were based on agents and had real access to the OS, instead of doing so through remote WinRM or SNMP interfaces.
Since it’s designed to be agentless, its SNMP, WMI, and remote execution capabilities are very powerful, configurable, and well-proven; yet again they need for the other end to grant ZenOSS complete access.
Finally, we would like to add a new article added on 25th August 2016 related to other Nagios alternatives. If you are planning to move from Nagios, we recommend you to check it out.

Pandora FMS’s editorial team is made up of a group of writers and IT professionals with one thing in common: their passion for computer system monitoring. Pandora FMS’s editorial team is made up of a group of writers and IT professionals with one thing in common: their passion for computer system monitoring.