What Can Pandora FMS Offer as a Server Monitoring Tool?
When your server goes down, it can certainly throw a wrench into your daily processes, costing you money and even causing you to lose customers until it’s back up and running again. Thankfully, Pandora FMS can help you prevent it from happening, and in the worst-case scenario when it does, you have the tools to get back up and running again in no time with our server monitoring solution!
An All-in-One Server Monitoring Software
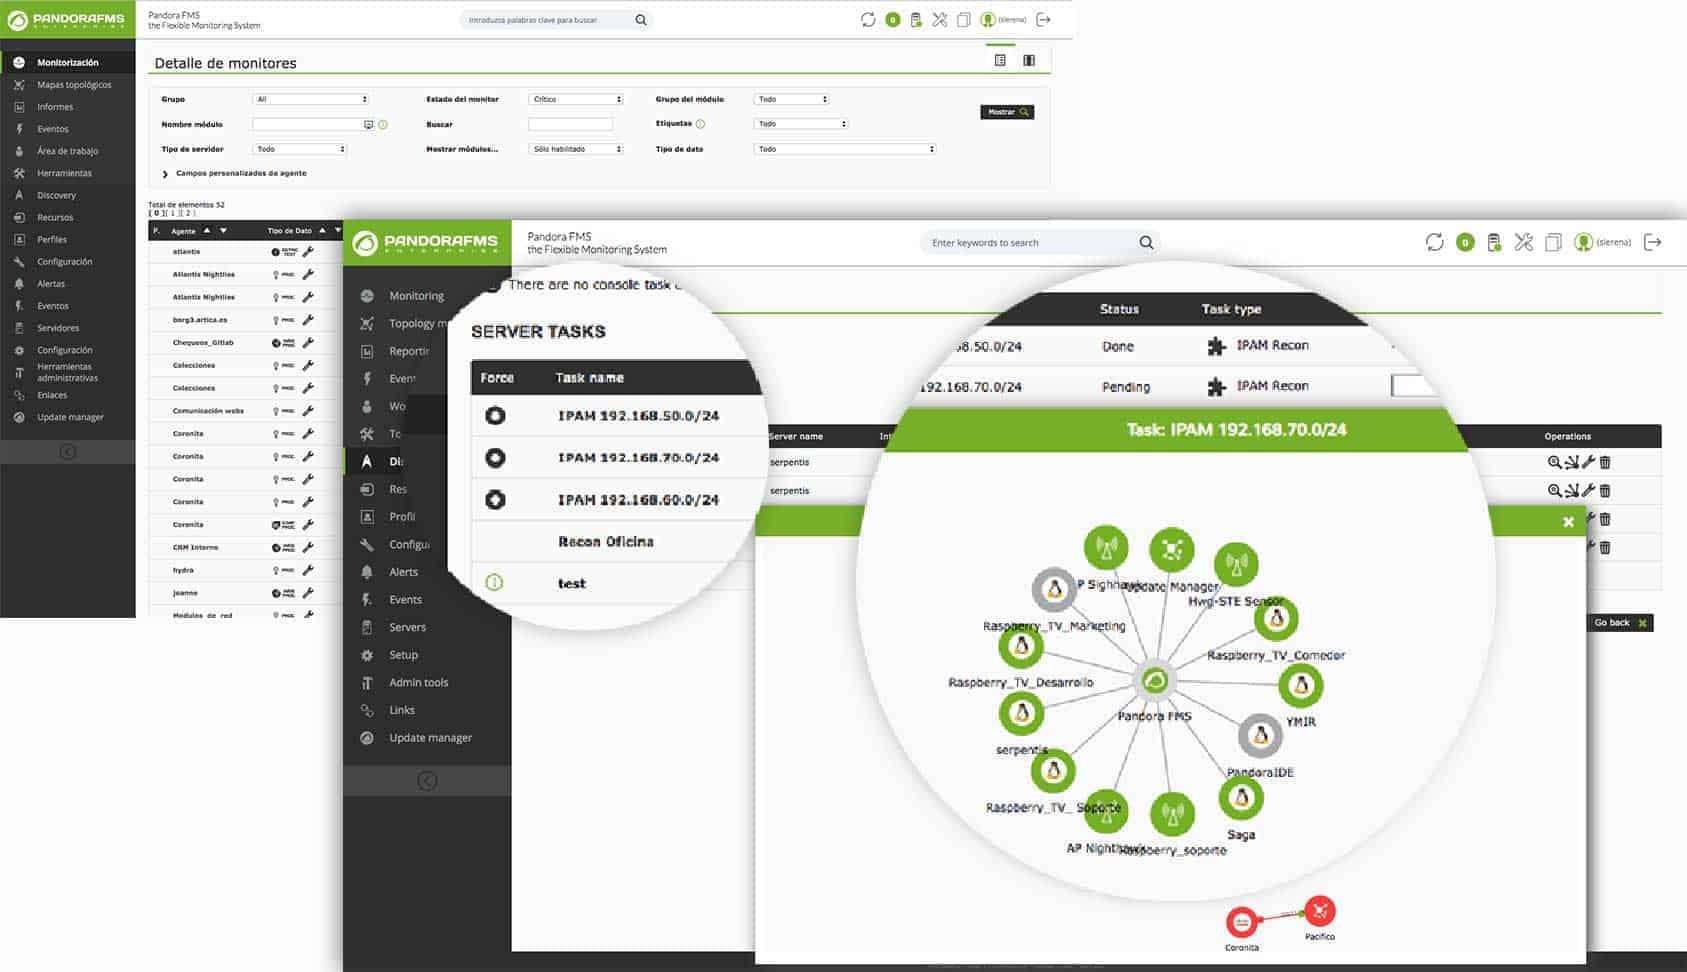
One of the best things about the server monitoring software available from Pandora FMS is that it’s a one-stop-shop for all of your server monitoring needs. Our software comes equipped with default policies for each operating system, application, and user environment. We also cover everything from user applications to hardware; our monitoring software is also compatible with both Linux and Windows.
Our Comprehensive Server Monitoring Solutions
When you invest in Pandora FMS server monitoring tool, you’ll be able to:
- Unify different information sources (applications, logs, base operating systems, storage, networks, user experience, etc.) into a single point.
- Manage everything in a centralized location equipped with plugin deployment features, remote configuration, templates, and more.
- Access expansive information, including multi-year history performance data, and unlimitedly access application and server logs.
- Manage tens of thousands of servers through a single console.
- Ensure that your software and hardware meet your expectations thanks to various SLAs, trend reports, and Top-N reports.

Some Server Monitoring Best Practices
When it comes to server monitoring practices, there are some specific things to keep in mind that will help you and your IT team utilize your new monitoring solutions to the fullest. How easy it will be to deploy some of these practices will depend upon the monitoring tools you’ve employed as well as your knowledge of the applications, but it’s important to be aware of them nonetheless.
Phase 1: Actions to Start Monitoring
First and foremost you need to take some actions, including:
- Identifying Your Assets: Identify all of your assets, including databases and the systems they feed, to make it easier to determine where the issue lies.
- Identify What Needs to Be Monitored & What Doesn’t: Establish priorities to determine what is critical in terms of monitoring and what falls at the bottom of the list.
- Classify Your Assets: Once you’ve developed a hierarchy for your assets, classify them by service, application, system, or resource to make identifying issues easier.
- Categorize Alerts: Categorizing your alerts will make it much easier to collect data on certain issues and keep track of them when they arise.
- Come Up with an Action Plan: When it comes to solving server issues, the fewer surprises the better, so come up with an action plan for every scenario you can think of to minimize downtime.
Phase 2: Identifying Problems Before they Happen
Unlike phase 1, using the right server monitoring software can also help you identify problems before they occur by providing intuitive monitoring solutions. The right software solutions will be equipped with automatic monitoring tools like big data monitoring solutions, dynamic monitoring services, event correlations, and smart thresholds, enabling users to identify things that can become major issues down the road.
What Exactly is Preventive Monitoring?
When it comes to preventive monitoring there are two important aspects, the first being defined by receiving small alerts when something leaves the normal operating thresholds. In this first scenario, it doesn’t necessarily signify a major issue, simply that something unexpected has occurred. However, defining clear parameters in such a scenario that leaves no margin for error in misunderstanding is key, that way a major event doesn’t go unnoticed.
In the second scenario, users can create monitoring displays or dashboards that are labeled and designed to compile information and create a real-time graph, enabling IT teams to determine precisely when something isn’t right.
Some of the most important tools for successful preventive monitoring include:
- Alerts: Such alerts must include item groups and allow for users to define complex tasks, with the ability to insert an event into a group, including a graph and a clear description of the issue.
- Graphs: Graphs can be used combined with other data to form a comprehensive understanding of an event.
- Logs: Logs help users understand the raw information when an issue has arisen. These can be created through the use of data charts or analyzing the raw data being introduced to the system via log registries.
- Direct Access to the Source: Direct access to the system creating the issue, as well as all of the detailed information behind an event, enables users to quickly address any issues and close the cycle.
Development from the Ground Up
Unlike many other forms of server monitoring software, the solutions from Pandora FMS have not been developed by any third-party developers; our team has built everything from the ground up. This means that you can get any necessary information directly from the source through native calls to the operating system. There’s no need to waste time dealing with going through third-party connectors to troubleshoot or obtain the info you need when you need it!
Contact Pandora FMS for your server monitoring needs!
Pandora FMS is one of the leading server monitoring companies because we offer comprehensive solutions at every level, working to meet our clients’ specific needs.
As experts in the IT monitoring sector, the team from Pandora FMS also offers a range of other solutions, including virtual monitoring, remote control solutions, MSP monitoring, and much more.
To receive a quote or learn more about the solutions we offer, call +1 (305) 900-6683 or contact us online today.
Pandora FMS’s editorial team is made up of a group of writers and IT professionals with one thing in common: their passion for computer system monitoring. Pandora FMS’s editorial team is made up of a group of writers and IT professionals with one thing in common: their passion for computer system monitoring.


