
Find out how to create Grafana dashboards with Pandora FMS data
About a year ago, in another Pandora FMS blog, we talked about what Grafana is, we explained what it was and how it was related to other software. Now we go a little further and we want to show you how to create Grafana dashboards with the data provided by Pandora FMS.
It is undeniable that this tool enjoys the support of a large user community, due to the versatility it offers to use different data sources to have displayed on its boards.
And naturally, we wanted to offer our Pandora FMS users the possibility of displaying monitoring data through Grafana dashboards. That is why today we provide you with a simple guide to achieve it.
What do you need to create dashboards in Grafana with Pandora FMS data?
Well, as obvious as it may seem, you need to have at least one Pandora FMS installation already running. This integration will allow to represent data obtained through Pandora FMS modules in Grafana dashboards. For the examples we give here, we will use as a base a standard Pandora FMS installation from the official ISO.
You will also need to have your own Grafana server, of course, since in the end it will be where you configure the boards that will display the data.
And as a communication requirement, you will only have to make sure that the Grafana server has communication through HTTP with your Pandora FMS console enabled (or HTTPS, if you have it configured that way). In this case, all communication will go through HTTP.

Configure integration in 3 steps
As the title of this section said, there are only 3 steps to make this integration work.
1) Adding Pandora FMS extension
First of all, start in your Pandora FMS console the extension that will allow you to obtain the data to be represented in Grafana dashboards.
To that end, just download the ZIP package that you may find in your library and upload it to the Pandora FMS console from the menu: Admin tools > Extension manager > Extension uploader:
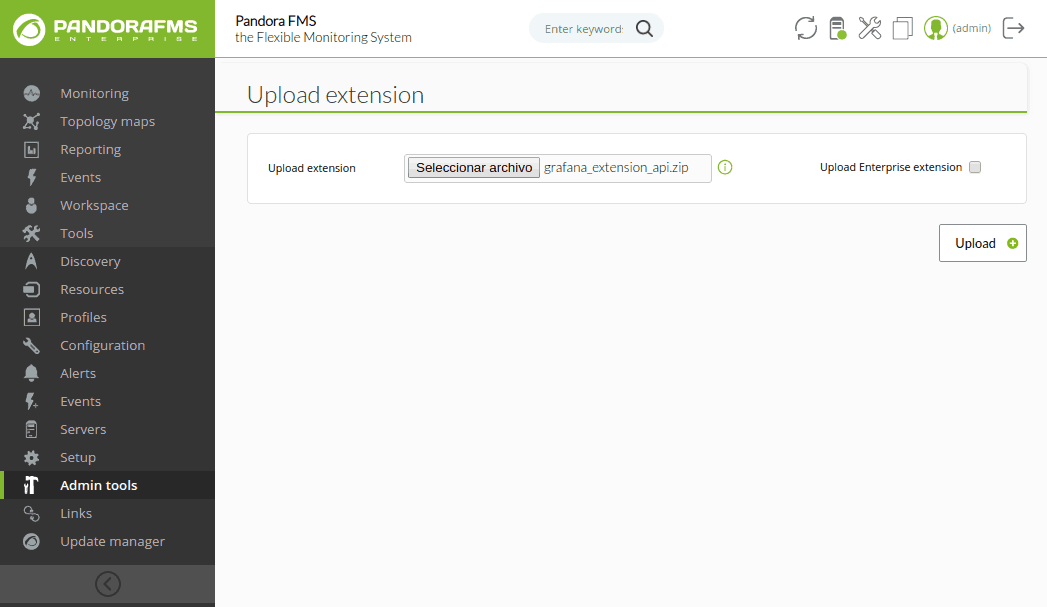
It is important not to check the “Upload enterprise extension” option.
In short, these steps basically locate the contents of the ZIP file in the extensions directory of the Pandora FMS console, which will lead to the directory being created:
/var/www/html/pandora_console/extensions/grafana
If, as in this case, the installation is based on a Pandora FMS ISO, it will also be necessary to modify a configuration parameter of the Apache server.
Simply edit the file /etc/httpd/conf/httpd.conf, and set the parameter “AllowOverride none” to “AllowOverride All”, within the directives of the block ‘<directory “/var/www/html”>’ since that is where the Pandora FMS console is located. Therefore, it should be this way:
<Directory "/var/www/html">

#

# Possible values for the Options directive are "None", "All",

# or any combination of:

# Indexes Includes FollowSymLinks SymLinksifOwnerMatch ExecCGI MultiViews

#

# Note that "MultiViews" must be named *explicitly* --- "Options All"

# doesn't give it to you.

#

# The Options directive is both complicated and important. Please see

# http://httpd.apache.org/docs/2.4/mod/core.html#options

# for more information.

#

Options Indexes FollowSymLinks
#

# AllowOverride controls what directives may be placed in .htaccess files.

# It can be "All", "None", or any combination of the keywords:

# Options FileInfo AuthConfig Limit

#

AllowOverride All
#
# Controls who can get stuff from this server.
#
Require all granted
</Directory>
We will also add a parameter in the PHP configuration. We will have to add the following line at the end of the file /etc/php.ini:
serialize_precision = -1
And for these changes to go into effect, the Apache service must be restarted:
systemctl restart httpd
2) Loading the Pandora FMS plugin for Grafana
Now everything related to Pandora FMS is ready. The only thing left is to include in Grafana the plugin that checks the data with the extension uploaded in the previous step.
Upload the ZIP file to the Grafana server with all the plugin files and place it in the path “/var/lib/grafana/plugins”. Unzip the file on this path with the “unzip” command and restart the Grafana service to load it:
cd /var/lib/grafana/plugins

unzip pandorafms_grafana_datasource.zip

service grafana-server restart
3) Configuring Pandora FMS as data source for Grafana dashboards
Add the following lines to the Grafana final configuration file (/etc/grafana/grafana.ini):
[plugins]

allow_loading_unsigned_plugins = "pandorafms-datasource"
After this change, the Grafana service must be restarted with the following command:
service grafana-server restart
We’re almost done, don’t panic! At this point, what you have to do is configure the plugin uploaded in Grafana so that it connects to the extension loaded in Pandora FMS and allows you to use its data in Grafana dashboards.
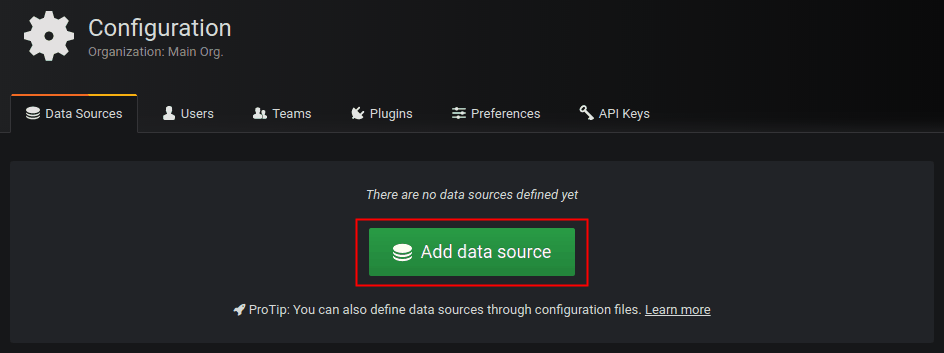
Access the “Configuration > Datasources” menu in Grafana and click on the “Add datasource” button:
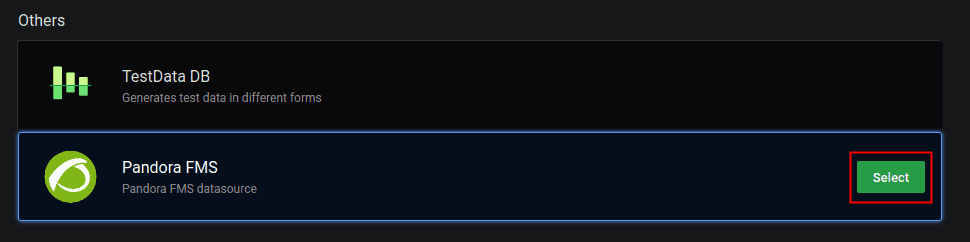
You will see different plugins that you may configure, and at the bottom of the list, you will see the plugin that you just loaded for Pandora FMS. Click on it:
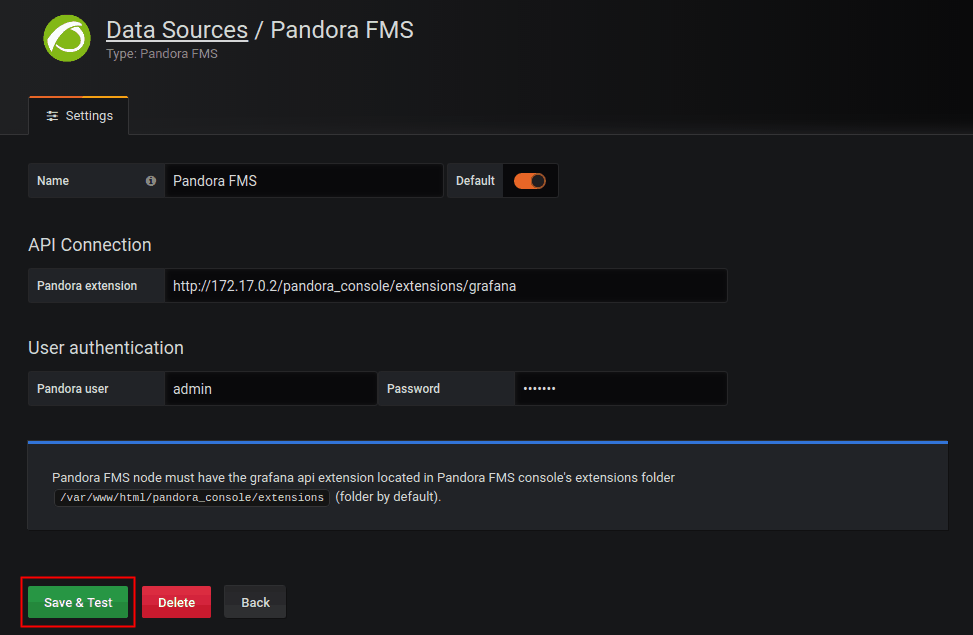
This will take you to a form where you only need to fill out 3 fields for the connection with the Pandora FMS extension:
- URL to the extension, which according to the suggestion we will see will be (by default) “http://x.x.x.x/pandora_console/extensions/grafana”, where “x.x.x.x” is the IP address or DNS name of your Pandora FMS console.
- Pandora FMS user, which will allow you to obtain data for Grafana dashboards. This user must have at least agent read permissions (AR) and can only obtain data from those agents on which it has permissions.
- Pandora FMS user password.
With these fields completed, you may click on the “Save & Test” button to verify the operation of your new data source:
What happens if it does not work properly? In configuration you might see different errors, such as:
- HTTP Error Bad Gateway → If Grafana could not connect to Pandora FMS or if the indicated IP address was incorrect.
- HTTP Error Not Found → If the indicated URL was not correct, for example because the Pandora FMS extension was not correctly loaded or simply because of an error when typing in the URL in the form.
- Datasource connection error: Unauthorized → If the user and/or password indicated were not correct or if the user did not have basic agent read permissions (AR).
But if you have followed all the steps up to this point, you should not have any problems. And just like that you are ready to create your first dashboard in Grafana with Pandora FMS monitoring data.
Creating your first dashboard in Grafana with Pandora FMS data
Although we are done with the Pandora FMS configuration as a data source, we will briefly see how it would work.
First, go to the “Create > Dashboard” menu, and in the panel that will appear, click on the “Add query” button:
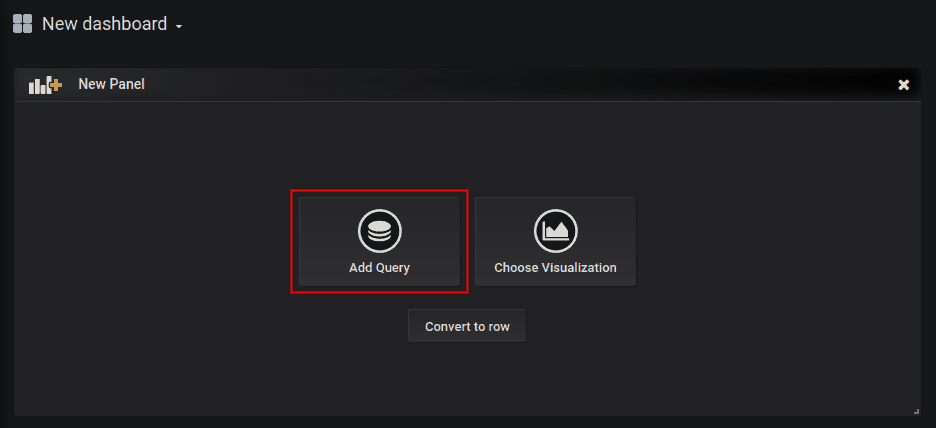
This will take you to a form where to choose your “Pandora FMS” data source in the “Query” drop-down. This will make the bottom of the form change and you will see a query to choose a module from which to display the data on the board:
- Label: It will allow you to specify the tag that you wish for the data represented for this query to have.
- Group: It is used to filter the agent about which to represent data. A group must be chosen.
- Agent: It is used to filter the module about which to represent data. Some agent must be indicated.
- Module: It is used to specify the module about which to represent data.
- TIP: It is a field that will allow to indicate whether the data to be represented will be compacted or not. If unchecked, the data will be compacted, which will result in easier-to-interpret and faster-loading graphs, although the data sample will not be the actual one but rather an average.
And once done, there you have your Pandora FMS data in Grafana.
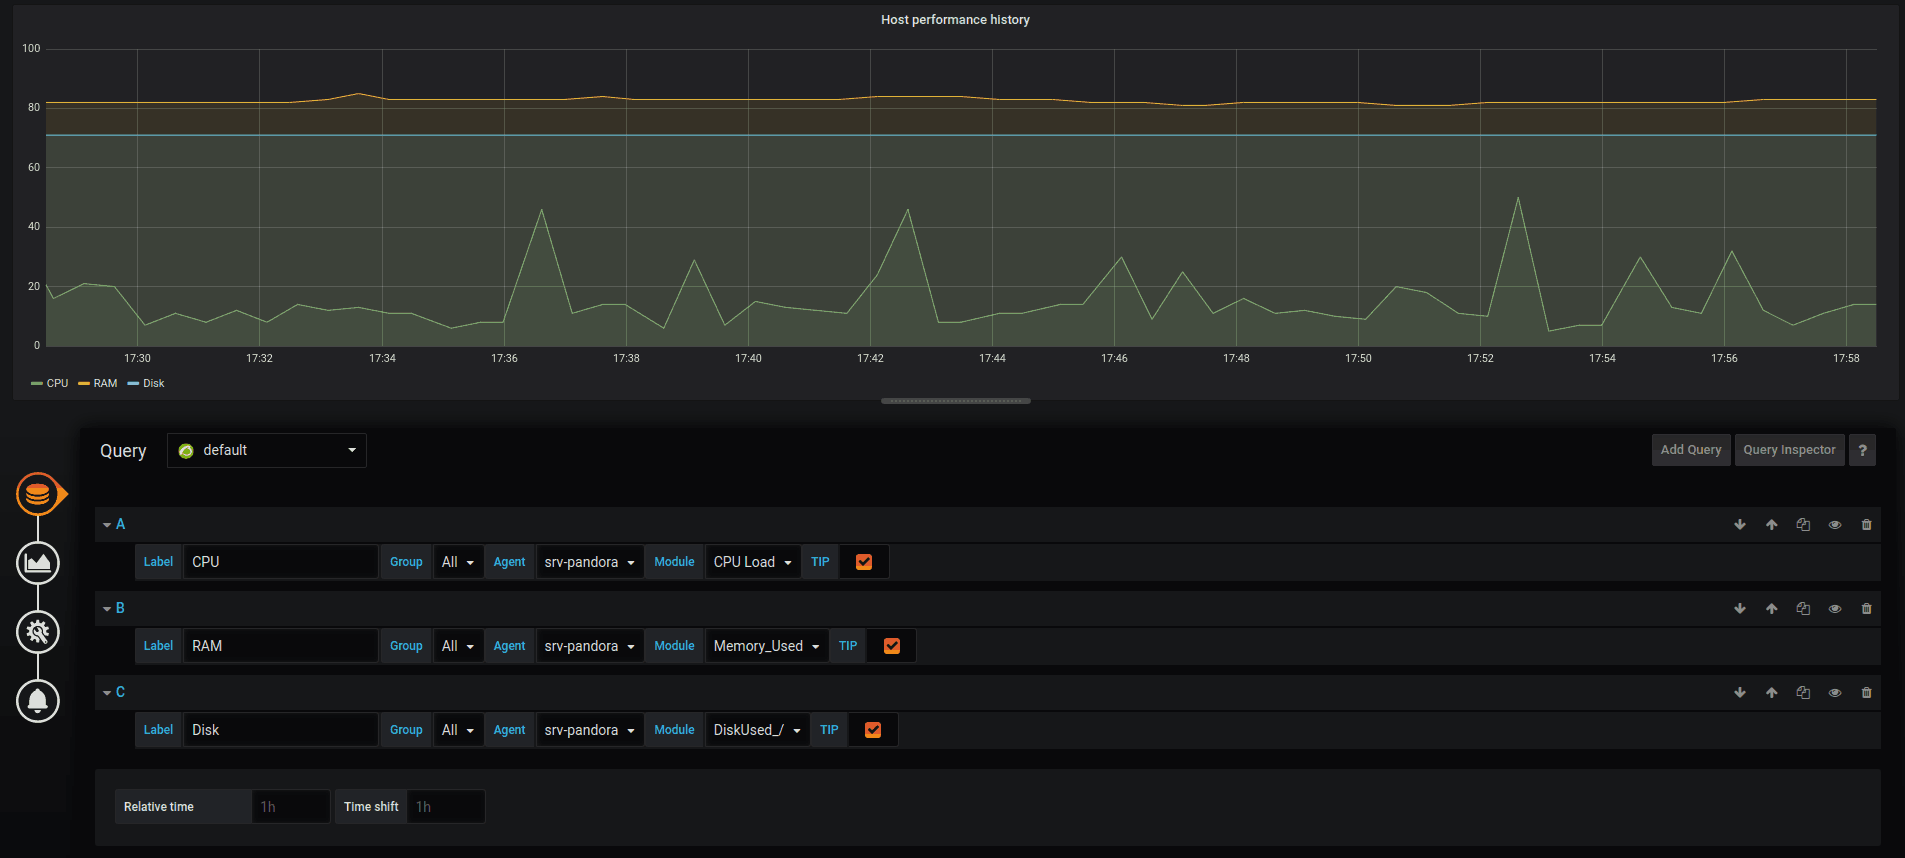
You may include more than one query in the same board, which allows you to compare data from different modules:
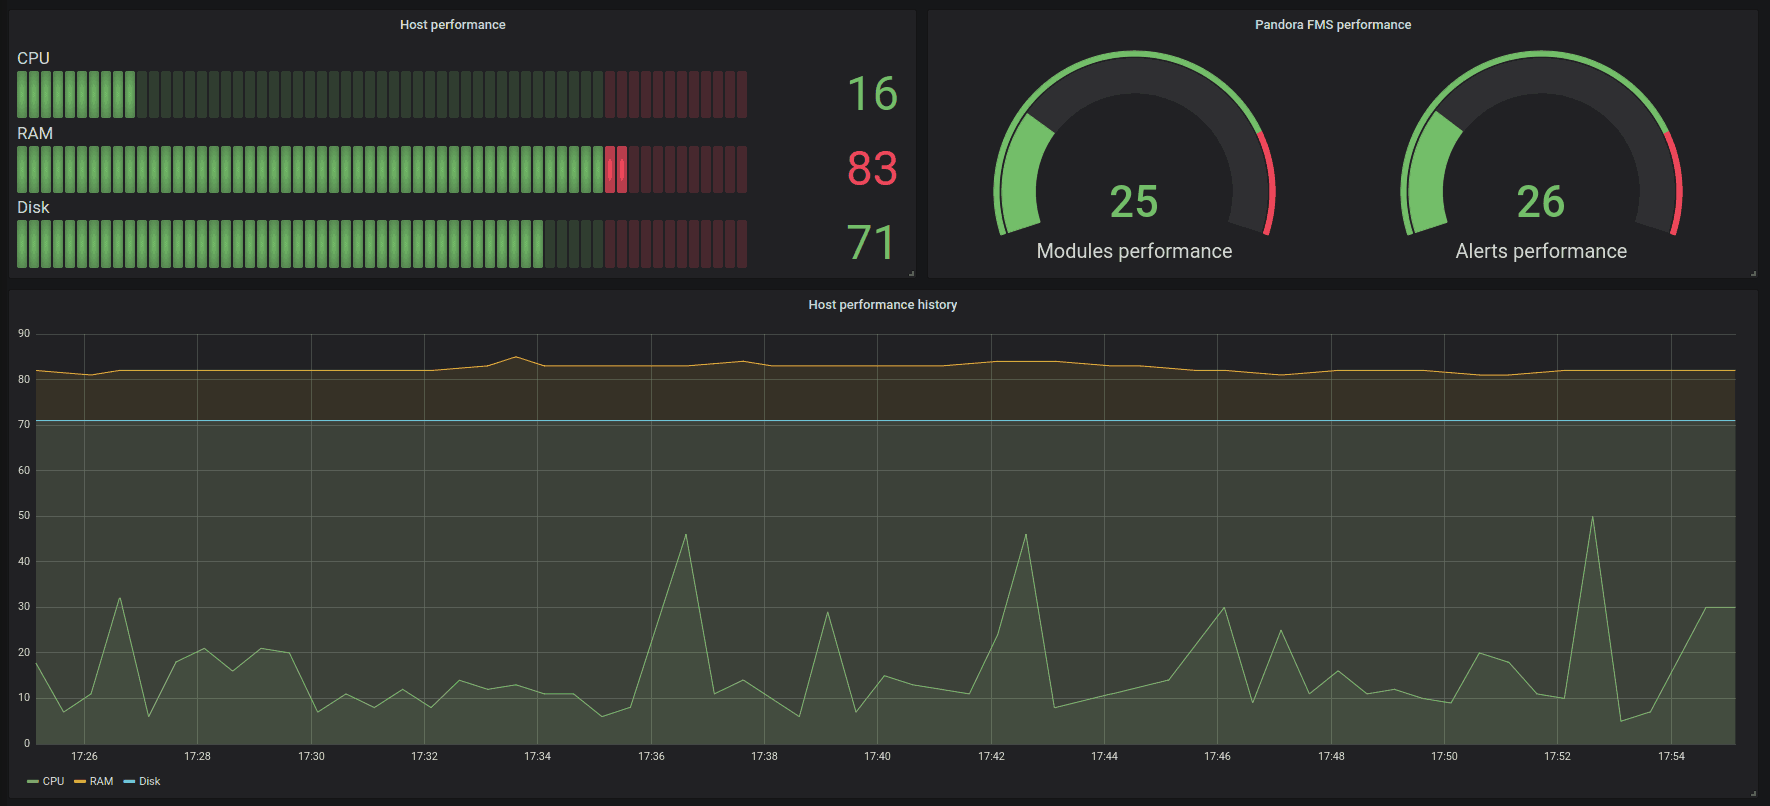
And you may also add more boards within the same Grafana dashboard, so that you have all the necessary information on the same screen:
We hope you found this guide useful, and do not hesitate to check other interesting articles on our blog. Besides, you can also see this great video about Grafana’s integration with Pandora FMS monitoring.
Before we say goodbye, remember that you can learn much more about Pandora FMS by entering here.
If you have more than 100 devices to monitor, you can contact us through the following form.
Also, remember that if your monitoring needs are more limited, you have the OpenSource version of Pandora FMS available. Learn more about it here.
Do not hesitate to send us your queries. The Pandora FMS team will be happy to assist you!

Traductora a francés e inglés. Me encantan las lenguas. Amante de la ropa oversize, la tarta de queso y el chocolate caliente en invierno. Me gusta leer, escuchar música, viajar y explorar cosas nuevas. Mi frase más temida por aquellos que me conocen es “he estado pensando…”
Translator into French and English. I love languages. Lover of oversized clothes, cheesecake and hot chocolate in winter. I like reading, listening to music, travelling and exploring new things. My most feared phrase by those who know me is “I’ve been thinking…”