Monitoring Web Server Apache with Pandora FMS
What is an Apache Web server?
In today’s article, you will learn how to monitor in depth an Apache web server with Pandora FMS. But first, let’s find out what Apache is.
It is the most widely used open source HTTP web server on the market, as it is multiplatform, free, high performance, and one of the most secure and powerful.
It was founded in 1999, in the United States, by a group of eight developers who initially formed the Apache Group, which would lead to the Apache Software Foundation.
Among its many advantages are its free and open source cost, its compatibility with Linux, MacOs and Windows, its SSL and TLS security support, its global and functional support team and its performance (one million visits per day).
Monitoring web server Apache is not as simple as monitoring the status of the process or making a web request to see if it returns anything. This would be a basic monitoring that anyone could do with Pandora FMS, since there are some examples in the documentation.
Performance Monitoring web server Apache
There is a plugin in the Pandora FMS library that allows us, along with the Apache server status module, to obtain detailed information about the server performance.
In addition, we can configure the server to obtain detailed information about each instance or web domain that we are serving on the server.
The first step is, obviously, to have Pandora FMS installed. Then, we will install a Pandora FMS agent in the Linux server where the Apache is located.
Once the agent is installed, we will install the Apache plugin from the marketplace.
We will download it and copy it to the plugins directory of the linux agent, which is in /etc/pandora/plugins
In order to use the plugin we need to configure the Apache server (Monitoring web server Apache) to use the server-status module, which gives detailed server information. In order to do this, edit the file /etc/httpd/conf/httpd.conf and add the following configuration:
ExtendedStatus on
SetHandler server-status
Order deny,allow
Deny from all
Allow from XX.XX.XX.XX
Where it says XX.XX.XX.XX.XX we will put the main IP of our WEB server. So that it will only accept requests from itself, for safety.
Once these changes are made, we will restart the web server and launch the plugin manually to verify that it returns any data:
/etc/pandora/plugins/apache_plugin http://46.105.97.91/server-status
It has to return an XML with data, since it is an agent plugin that returns several modules. This is an extract of the entire XML:
type generic_data/type
Once we have verified that it works, we will add the plugin to the Pandora FMS agent with the following line:
module_plugin apache_plugin http://XX.XX.XX.XX/server-status
Once again, we are trying to replace XX.XX.XX.XX with the Apache server IP, the same machine where the Pandora FMS agent is executed.
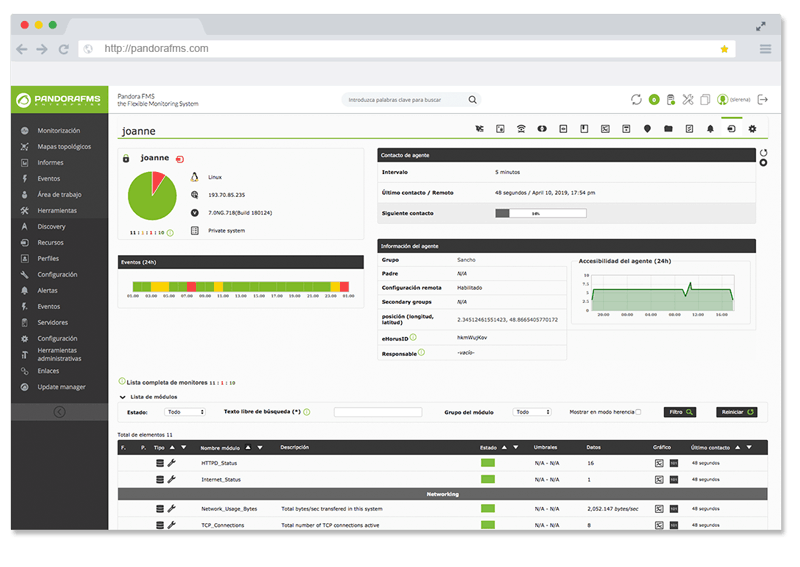
Once this is done and the agent is restarted to get the new configuration, it should have a view similar to this one:
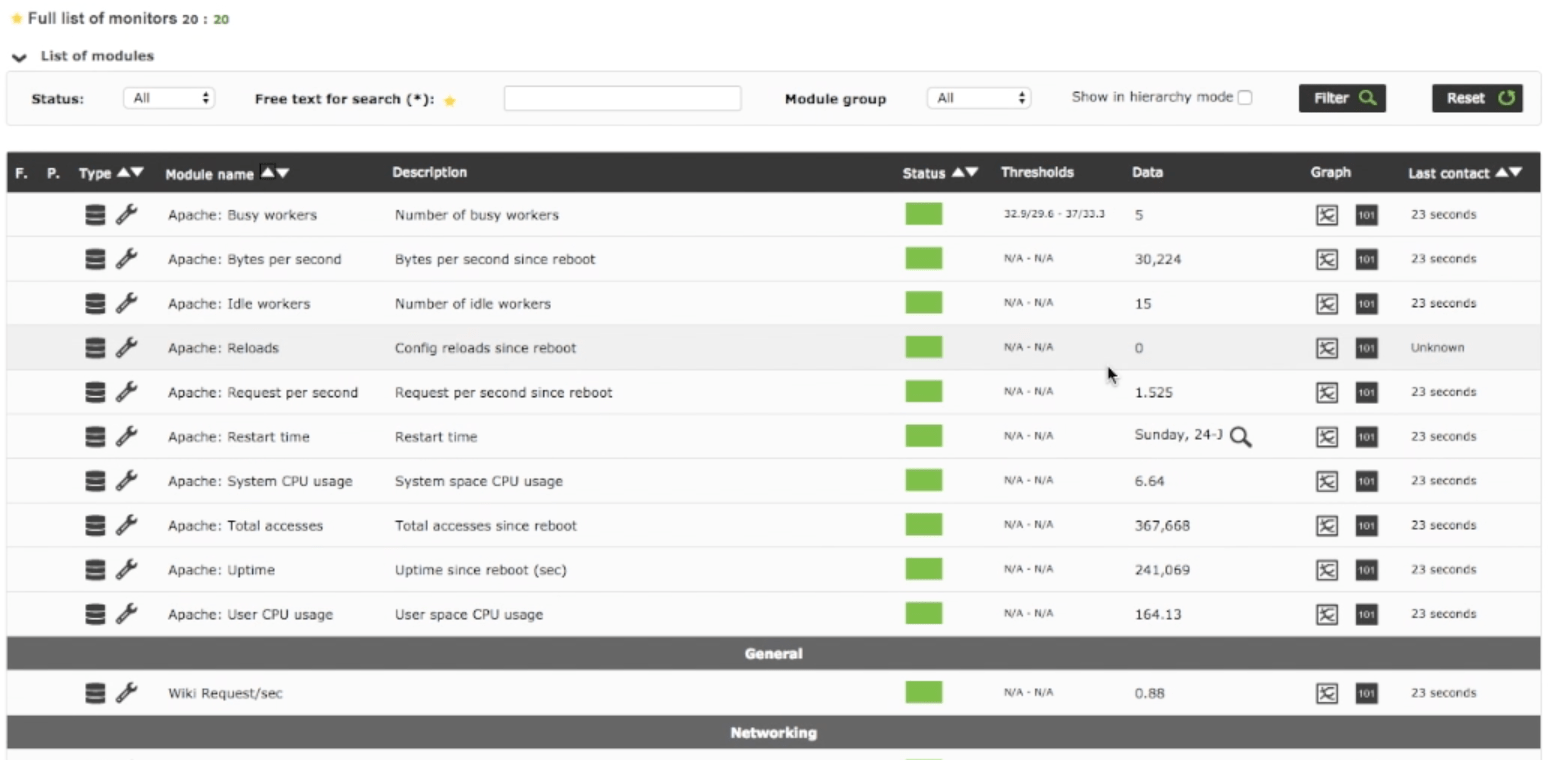
Server status monitoring
In addition to performance monitoring, we should do a basic monitoring web server Apache process; a module would be enough to verify that the daemon is working:
module_begin

module_name Apache Status

module_type generic_proc

module_exec ps aux | grep httpd | grep -v grep | wc -l

module_end
Being a Boolean module, it would only be set to CRITICAL when its value is 0, but it will also help us to know how many HTTPD threads are active on the server.
Load monitoring of a specific instance
In Apache we can configure an instance -which in its terminology is a virtual host- to use a specific log, only for itself, in this way:
ServerAdmin [email protected]
DocumentRoot /var/www/mydomain
ServerName mydomain.com
CustomLog logs/access_log_mydomain common
Now we only have to monitor the number of entries of this file to find out how many requests per second we have in our server, through an incremental module:
module_begin

module_name MyDomain Request/sec

module_type generic_data_inc

module_exec wc -l /var/log/httpd/access_log_mydomain | awk '{ print $1 }'

module_end
You can watch the tutorial on how to monitor an Apache web server here:
Do you want to know more about application monitoring?
Pandora FMS Enterprise is capable of monitoring the most popular applications and databases. Click here and find out…

Pandora FMS’s editorial team is made up of a group of writers and IT professionals with one thing in common: their passion for computer system monitoring. Pandora FMS’s editorial team is made up of a group of writers and IT professionals with one thing in common: their passion for computer system monitoring.