


Varnish is a web application accelerator. It is a reverse proxy that acts like a HTTP cache. Since it allows speeding up the service through content caching, it’s a very useful app for web apps or services with a high traffic volume. The typical app architecture used by HTTP cache is like the one below.

All the HTTP traffic goes through the Vanish server. Before requesting information to the backend server, it uses Varnish cache to obtain information.
As the cache server processes all the requests, Varnish cache becomes a crucial piece everywhere it runs. That is why it is essential to be sure that Varnish cache is working fully as expected. Otherwise, it could become a bottleneck that would slow down the entire app. The best way to watch closely the proper performance of Varnish is by monitoring the key performance variables of this server.


Varnish Cache Performance parameters
Once installed, Varnish Cache allows us to use several apps to evaluate the server by means of statistics. These apps are the ones mentioned below.
- varnishtop: grouped list with the most usual entries from different logs.
- varnishhist: a histogram that shows the time taken for the requests processing.
- varnishsizes: it performs the same task as “varnishhist” but showing the size of the objects.
- varnishstat: it shows many contents on cache hits, resource consumption, etc..
- varnishlog: it allows us to see all the requests made to the web backend server.
If you need further information on these commands or additional ones, check the Varnish cache documentation out! (https://www.varnish-cache.org/docs/3.0/index.html).
Vanishstat is the command that gives us the most useful information to check the performance. The rest of commands provide detailed information about requests and logs. These commands are very useful when you need to configure and debug the cache server operation (performance).
Once the “varnishstat -1″command has been executed in the same server as varnish cache, we will get a log list of metrics.
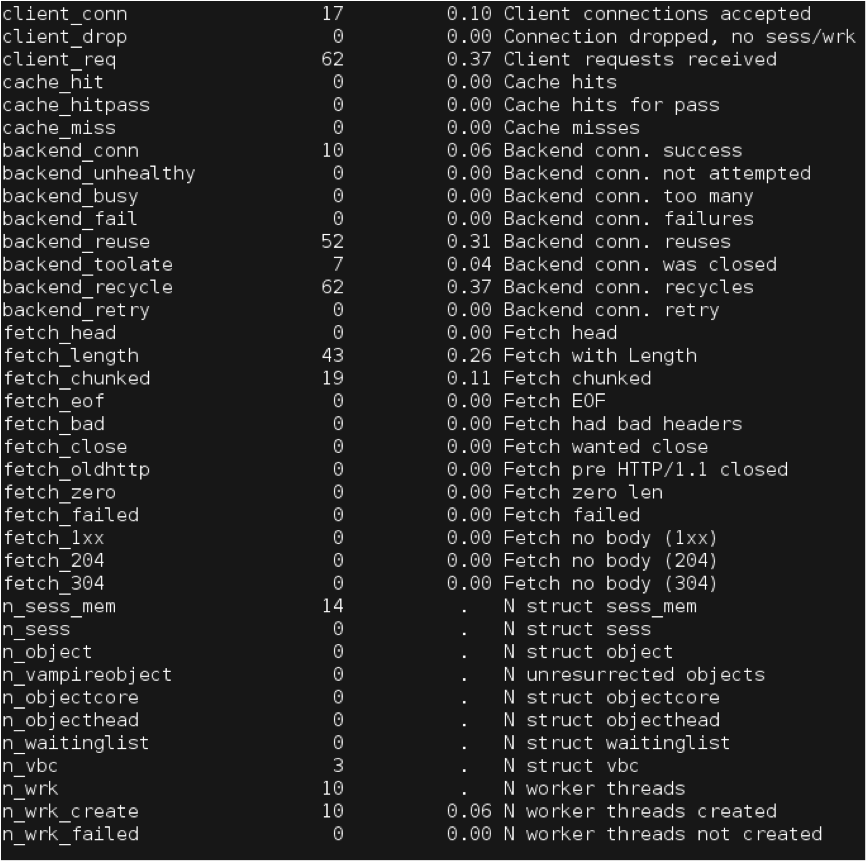 The basic metrics to check the performance level are the following ones.
- client_conn : accepted client connections
- client_req : received client requests
- backend_fail : backend connection failure
- cache_miss : cache misses
- n_object : number of instantiated objects
- n_wrk : number of worker threads
- n_wrk_create : number of created worker threads
- n_wrk_failed : number of failures when creating worker threads
- n_wrk_max : maximum number of worker threads
- n_wrk_drop : number of abandoned work requests
- n_lru_nuked : number LRU objects
- esi_errors : ESI parsing errors
- n_expired: number of expired objects
With this command, you can get a snapshot of the performance statistics. A single snapshot is not enough to check the trend. To accomplish this task, you need older data, for example, data from the previous week or the previous month in order to compare different configurations over time.
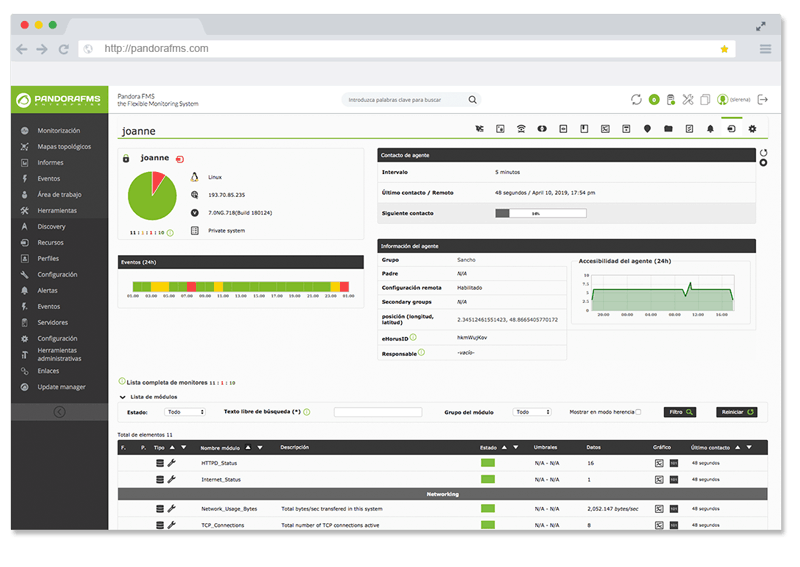
To get this information, the most important variables over a period of time must be monitored. With this information, you can easily see if the changes made in the varnish configuration improves the performance. We will use Pandora FMS and the varnish cache plugging that is available in the library to monitor Varnish cache. Pandora allows us to set alerts that will notify us on performance problems and will send us reports with the evolution of different metrics. With these features, we can be sure that we will be reported on any problem in our server.
Do you want to know more about application monitoring?
Pandora FMS Enterprise is capable of monitoring the most popular applications and databases. Click here and find out…
How to monitor Varnish with Pandora FMS
The first thing to do is downloading and installing Pandora FMS. You can find an OS image or a preconfigured virtual machine for VMware here: http://pandorafms.com/Community/download/en
Once Pandora FMS has been installed, it’s necessary to install a Pandora FMS agent in the machine where the Varnish cache server is running. Click on the following link to find agents for different: http://sourceforge.net/projects/pandora/files/Pandora%20FMS%204.0.3/
To learn how to install every component step by step, click on the following link and check the official Pandora FMS documentation out: http://www.openideas.info/wiki/index.php?title=Pandora:Documentation_en
Now, it’s Varnish pluging’s turn. Click on the link below to install the pluglin http://pandorafms.com/index.php? sec=Library&sec2=repository&lng=en&action=view_PUI&id_PUI=537

You just have to unzip the zip file to install the plugin and copy the files “varnish-plugin.pl” and “varnish-plugin.conf” into the agent installed plugins folder in the Varnish server. You can use the following commands:
# unzip varnish-plugin.zip
# cp varnish-plugin.* /etc/pandora/plugins
Once the plugin is in the right location, we can configure it. To accomplish this task, you have to edit the configuration file. The default file is called “varnish-plugin.conf” and has the following structure:
METRIC
hit_ratio
connect_accept_ratio
backend_success_ratio
work_thread_ratio
STATS
client_conn
client_req
backend_fail
cache_miss
n_object
n_wrk
n_wrk_create
n_wrk_failed
n_wrk_max
n_wrk_drop
n_lru_nuked
esi_errors
n_expired
This file allows you to configure two kinds of metrics: statistics and ratios. Statistics are defined by the token STATS. This category can pick any value that appears when you run the command “varnishstats -1”. Different parameters can be selected by the name that appears in the first column of the output returned by the command. Ratios are defined by the token ratios METRIC. The ratios help understanding of the Varnish performance values by providing normalized information as percentages. The available ratios are:
- hit_ratio: cache hit ratio.
- connect_accept_ratio: accepted connections / received requests ratio.
- backend_success_ratio: successful backend server connections ratio.
- work_thread_ratio: working thread / created threads ratio.
If you wish to add or remove some variables or metrics to monitor, you can make changes in the configuration file, so that the monitoring will suit your company better.
For the agent to run Pandora FMS plugin periodically, a new module must be added to the plugin configuration file. First at all, you need edit the agent configuration file (by default in “/ etc / pandora / pandora_agent.conf”) by adding the following line:
module_plugin /etc/pandora/plugins/varnish-plugin.pl /etc/pandora/plugins/varnish-plugin.conf
Once the agent sends data to the Pandora server, the modules and their values will appear.
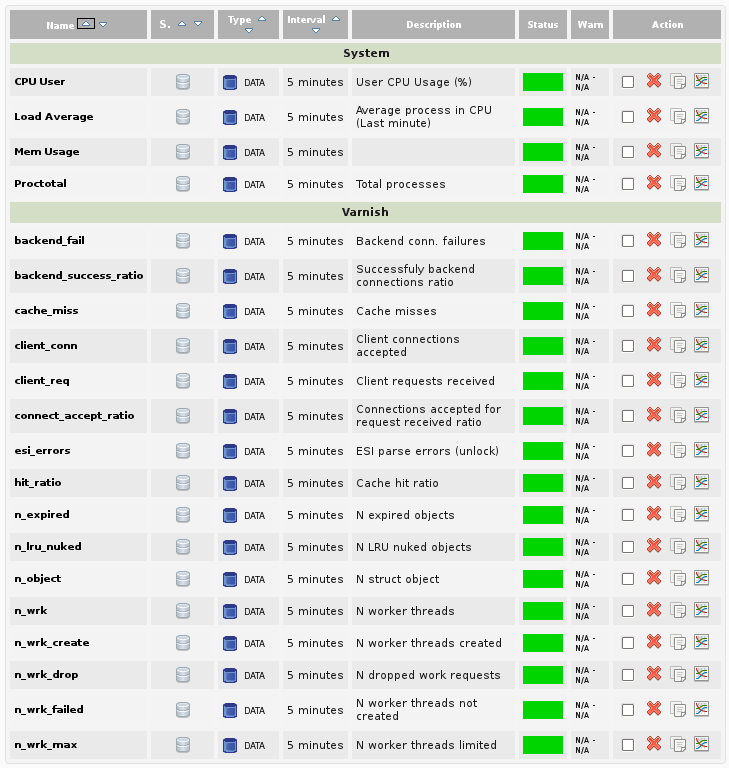
For this example, as well as monitoring the variables related to the cache Varnish proxy (backend_fail, backend_success_ratio, cache_miss, etc), we would like to add some other variables related to the machine performance (User CPU, load average, Mem Usage and Proctotal). With this configuration, we will get an overview of the performance and the resources consumed by the cache server.
After finishing this process, we can be sure that Pandora FMS is currently collecting data from which will generate reports to evaluate the ongoing performance.
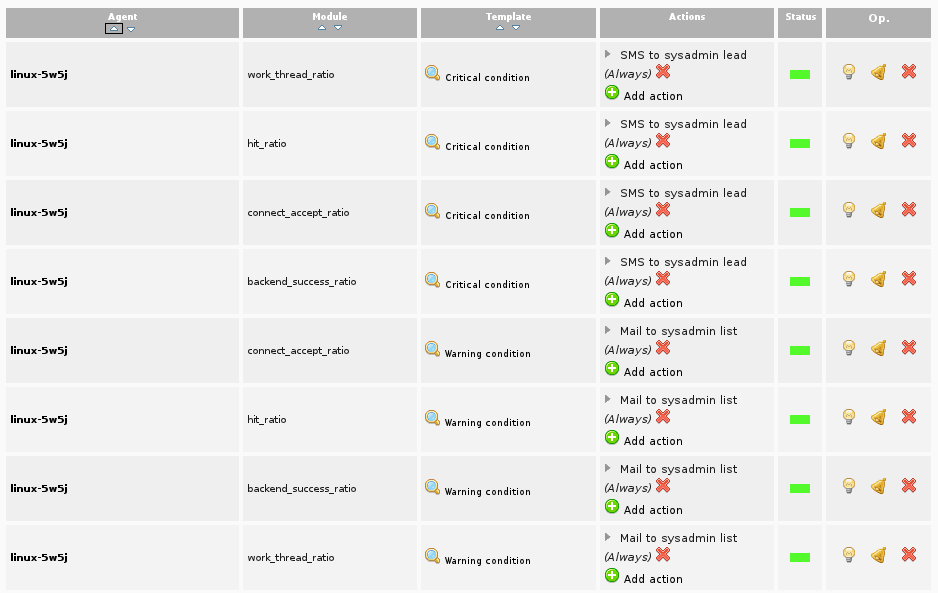
As we also wish to use the alert Pandora FMS features, we need to perform some additional configuration modules. The next step is to set all the values that define the state of the module. These values will use normalized values between 0 and 100 according to the modules that represent ratios. They will provide enough information to evaluate, in a first instance, the performance of Varnish. The threshold settings would be like this:
|
Modulo |
Min Warn |
Max Warn |
Min Crit |
Max Crit |
|
backend_success_ratio |
51 |
70 |
0 |
50 |
|
connect_accept_ratio |
0 |
5 |
20 |
100 |
|
hit_ratio |
51 |
70 |
0 |
50 |
|
work_thread_ratio |
51 |
70 |
0 |
50 |
|
Mem Usage |
80 |
90 |
91 |
100 |
|
CPU User |
85 |
90 |
91 |
100 |
 With this configuration, for example, the hit_ratio module will turn automatically into a critical status when the number of cache hits is between 0% and 50%. It will change into a Warning status when the number of cache hits is between 51% and 70%. Besides, we have also defined thresholds to set alerts on system modules, specifically on the use of CPU and memory. Now that the modules show clearly their status, we can create Pandora alerts to warn us when detecting any problems.
We have defined different reporting methods depending on how critical the status is. Thus, Pandora will send an email to the list of system administrators when the status is not that critical. However, when the status is very critical, a SMS will be sent to the leaders and managers of the IT architecture of the website.
At this point, we have already configured a reactive monitoring in our Varnish cache server. It means that we will be notified on problems so we can react fast to find a solution. However, although this process is accomplished, we should fix trends and act accordingly to have a proactive monitoring.
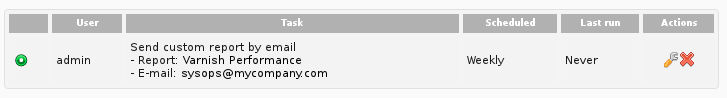
Pandora also allows you to create reports to see the grouped information about the trends easily. In this case, we have created a report on Varnish performance with the system performance parameters.

Besides, Pandora FMS allows you to configure the sending procedure. You can decide when to receive the emails with the reports: every week, every month, every fortnight, etc. So that we can have a complete study of trends Varnish automatically in our email, without having to go to the Pandora FMS.
Conclusion
With this configuration, you will be notified on any failures on the Varnish Cache server. Thanks to the alert features, you will be notified on any problems that may arise in your web application cache. Furthermore, by means of the reports, you can see trends and perform a preventative maintenance on the server to prevent future failures. Since Varnish is the only entry point for all web traffic, this way of monitoring will allow you to be protected from bottlenecks that slow down your systems.

Pandora FMS’s editorial team is made up of a group of writers and IT professionals with one thing in common: their passion for computer system monitoring. Pandora FMS’s editorial team is made up of a group of writers and IT professionals with one thing in common: their passion for computer system monitoring.


