In a world where technology is a means to an end, monitoring isn’t only checking availability, pinging, and performance; not everything is servers, databases and command lines…there’s another kind of monitoring. It’s subtle, but potent; service monitoring.


Definition
What is a service, in this context? In the IT world, a service is something you offer, whether a function or an outsourced task, to your clients or collaborators, who might be, for example, an online shop, a hotel search site, a delivery company, CRM, a support site, etc.
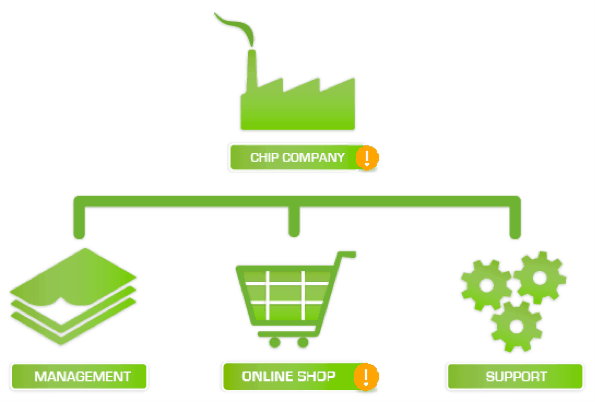
Here’s a company schematic including three typical services:
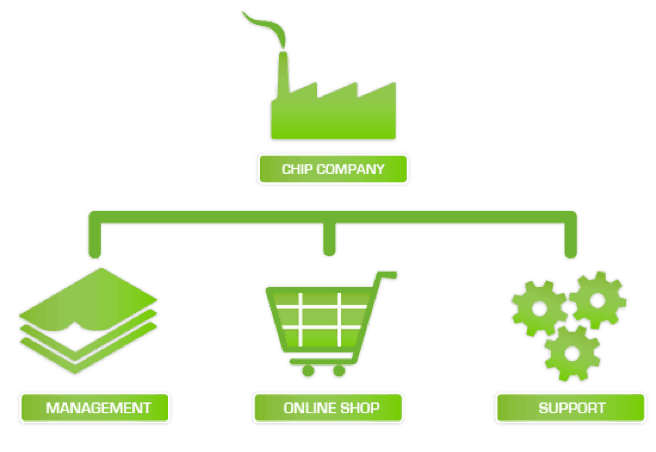
The three services that are offered to the clients are dependent on the technology underpinning them. All three services are critical for the company because if only one of them fails there will be serious repercussions for the company in terms of income and damage to their reputation.
We’ll be looking at both high level and low level monitoring of these services, the elements involved, dependent relations and the technological resources that maintain the service.
Analysis
Before defining the service tree at high level the infrastructure in question should already be monitored and copacetic, collecting data from your systems. With this as your baseline, you ought to be able to know which of the components can be classed as critical. That’s right, they’re the ones on which your services depend directly. Having identified your critical services the next step is to consider what the impact of an outage in any of those services would be; would it imply a total interruption of service or merely a deterioration?
Design
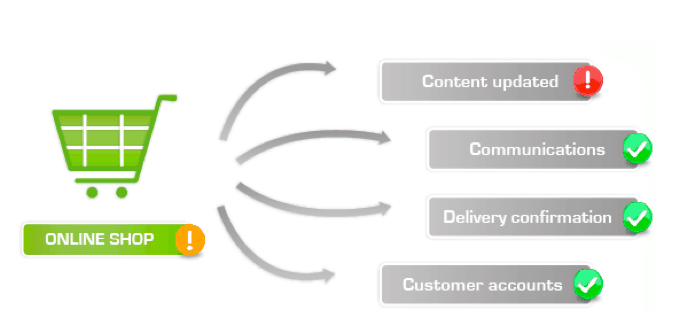
Going down to the next service level we find the elements that derive from the different services, for example the online shop:
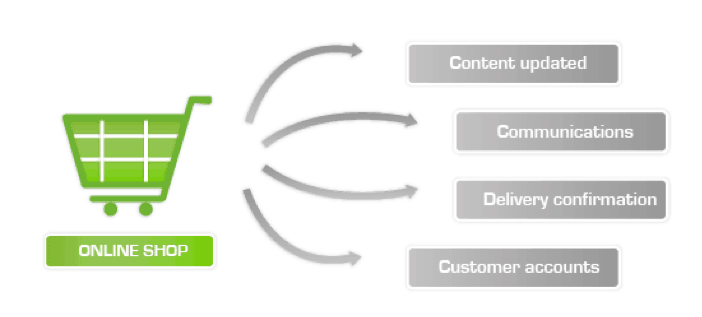
These four logical elements need to be checked and that leads us to the following level of service monitoring, at low level:
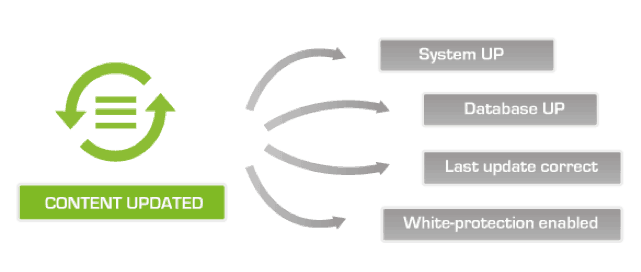
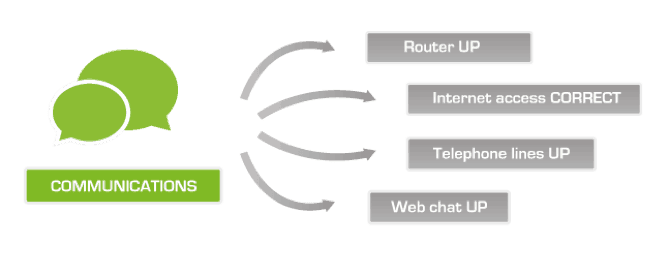
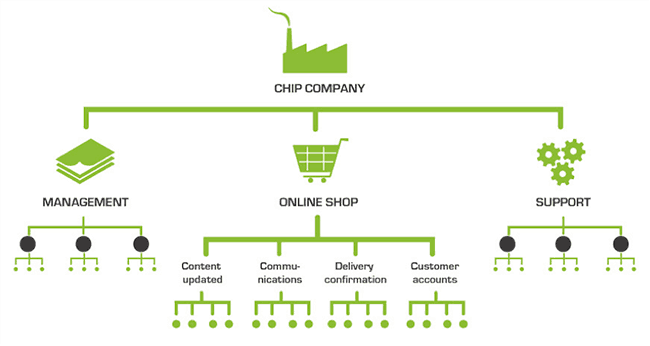
In the diagrams above, both Content Updated and Communications, constitute services. In order to define the service tree, each of the lower level elements has to be monitored (Systems UP, Router Up, Database UP…) up to high level to get a picture of the status of your services, creating the structures with basic elements and nested services.
So what happens if there’s a problem with any of the monitored components? How will that be reflected on the service tree?
Logic
During the analysis phase, the service tree structure is defined, and the key components identified, as well as their relative importance in the overall functioning of the service.
Basing the findings on the prior analysis, we can determine which of the constituent elements of the service tree carry the most weight.
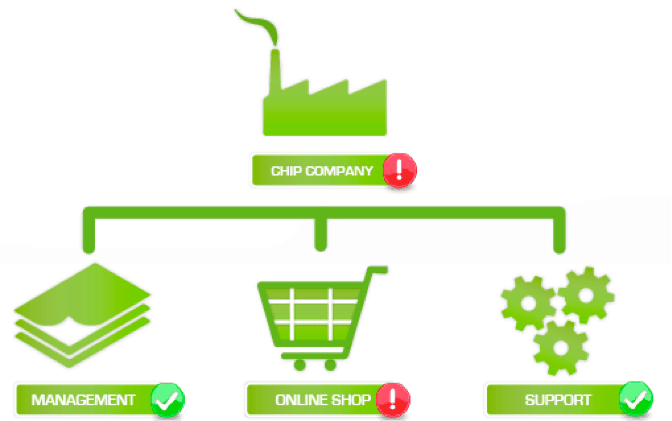
- Case #1: one of the servers that ensure that the content is kept up-to-date is down – a critical blow at “Content Updated” level. Nevertheless, the online shop is still up, customers can place orders and generally everything is functioning adequately. The deterioration in the service is not yet critical, and will be shown on the service tree as:
- Content updated: displaying red status, due to a critical component being down. Total interruption of service. Def Con 1.
- Online shop: displaying warning status, due to problems in a non-critical component. It means the service has suffered any deterioration.

- Chip company: displaying warning status due to non-critical problems in one of the components. Service deterioration.
- Case 2: communications have been interrupted because the principal router is down, which is a critical problem at “Communications” level. It’s not possible to access the online store, making “Online shop” level suffer a critical service collapse, reflected like so:
- Communications: critical status due to the router being down.
- Online shop: critical status due to the total interruption of service.
- Chip company: displaying critical status due to the total collapse of one of the three principal services.

Final structure
Bigger and more complex service trees can be built, and the status of the services overseen, at both high and low level, and visual representations of the systems permit easy analysis.
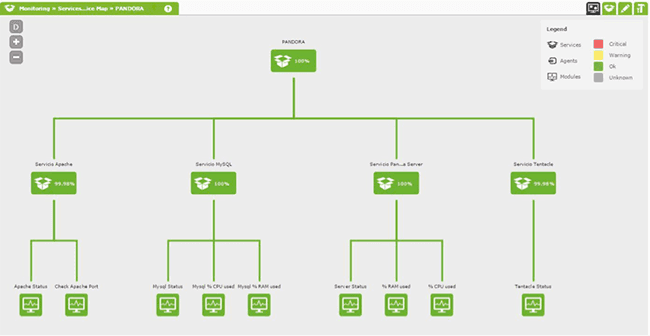
In the following screenshot a real example of a service tree can be seen. Using this setup we control our own monitoring system here at Ártica HQ:
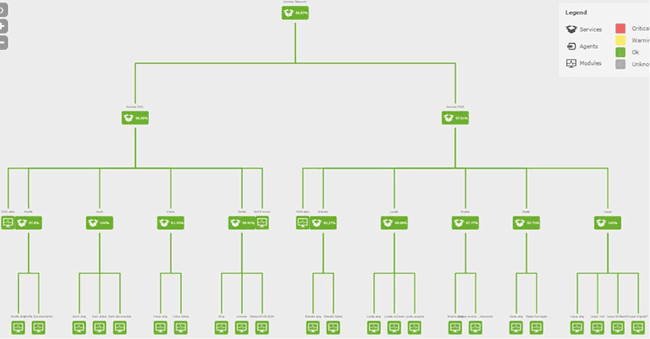
The screenshot below shows a cluster of services being monitored:
Service trees can be used on dashboards and visual consoles and are ideal for displaying on large screens in your crisis room, CPD or monitoring operator control suite.
Module applications
Apart from creating clear and legible structures to view on modules, you can also apply this system of service monitoring in an autonomous and proactive manner, because all the elements you can see in a structure have their equivalents in the form of modules. When you create a service one of the configuration options consists of selecting an agent to save the modules that have been automatically generated, while the service is configured.
For each service, three modules will appear:
- SLA Value Service: current percentage value of SLA compliance.
- SLA Service: whether the SLA is being currently fulfilled.
- Service: total service weight.
The service weight is a way of viewing the service’s state of health. More weight usually means more elements are showing Warning or Critical status. Weights are configurable but we’ll leave those details for another time (watch this space).
The following screenshot shows three “Web Services” modules, displaying the values in question. Firstly, the total weight (0), telling you everything is A-OK; in second place that the SLA is being met; and in third place, the SLA percentage. As you can see there’s a critical thresholdwhen the SLA value drops to 95%, in which case you’ll be notified immediately:

The advantage of these modules is that they allow thresholds to be defined (at the same time as you create the service, if necessary), and to assign alerts, meaning that when there are negative SLA values, or the status of the services is not good, your support department gets an SMS or email informing them about it.
Furthermore, it’s possible to display graphs, which is very useful to show the SLA’s percentage and see its developments, whether there’s been an incident that has affected SLA compliance, or any other factor or anomaly that could affect the SLA numbers.
You can get more information in the following video: https://www.youtube.com/watch?v=9b7tbl7Sxcg&t
About Pandora FMS
Pandora FMS is a flexible monitoring system, capable of monitoring devices, infrastructures, applications, services and business processes.
Of course, one of the things that Pandora FMS can control is the hard disks of your computers.
Would you like to know more about what Pandora FMS can offer you? Discover it by entering here: https://pandorafms.com
If you have more than 100 devices to monitor, you can contact us through the following form: https://pandorafms.com/en/contact/
Also, remember that if your monitoring needs are more limited you have at your disposal the OpenSource version of Pandora FMS. Find more information here: https://pandorafms.org
Do not hesitate to send us your queries. The Pandora FMS team will be happy to assist you!

Pandora FMS’s editorial team is made up of a group of writers and IT professionals with one thing in common: their passion for computer system monitoring. Pandora FMS’s editorial team is made up of a group of writers and IT professionals with one thing in common: their passion for computer system monitoring.