Nginx has become one of the most used web servers as of now. As a matter of fact, it’s stealing a big chunk of the market pie from the very famous Apache. According to certain sources, NGINX is used as a web server by more than 140 million websites, and it’s supposed to be used by 38% of the top 1000 sites on the web right now.
With this data, and with a strong bet on innovation, NGINX has been made an important element on any company installation. For this reason, here at Pandora FMS we’ve assigned part of our time to develop two plugins for NGINX. The first is meant to be used with the Open Source edition of Pandora FMS and monitors the main metrics from NGINX. The second is included with Pandora FMS Enterprise edition and apart from measuring the most important monitoring metrics, integrates perfectly with the NGINX Plus Status Module, which we’ll talk about below.
NGinx Plus Status (LIVE ACTIVITY MONITORING OF NGINX PLUS)
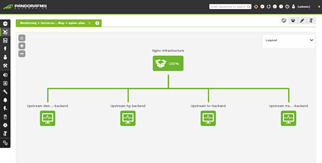
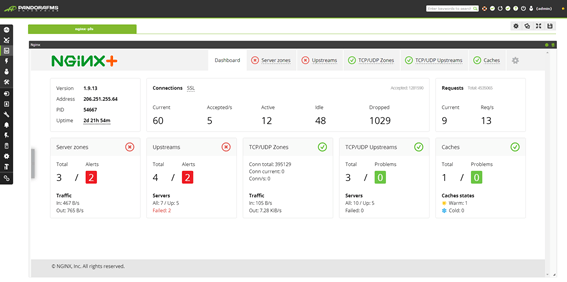
This module belongs to the paid version of NGINX and its main functionality is giving its users a visual dashboard that is updated constantly in real time, and returns the status on all NGINX servers under that person’s control. Apart from being able to see the information based on server zones or by individual sectors, it also allows users to access much more data than what could be done using the basic module on the status page.
Next, we’ll see which are the main monitoring metrics we should keep in mind for NGINX

Nginx Performance metrics
The key to monitoring NGINX is accessing the status page, which gives us the main Nginx performance metrics we have to keep in mind:
- Server up or down
- Number of active connections (accepted and pending)
- Total number of accepted connections
- Total number of client requests
- Total number of requests being read
- Total number of requests being written
- Number of pending connections
- Request response time (for this we have to access the NGINX log files and recover the response time from there)
With these metrics we should have more than enough to get an idea of our server’s status. To retrieve more information we need to use the NGINX Plus Status Module from the enterprise version of NGINX, from which we’ll be able to retrieve the following metrics.
- 4xx errors
- 5xx errors
- Incoming and outgoing bytes per each configured area.
- The possibility to know the traffic flux in real time amongst server areas or individual servers.
- NGINX cache data
NGINX Monitoring Tools
On this occasion we’ll be talking about the 3 main alternatives to Pandora FMS and which is the status on its NGINX monitoring. Next we will show you the current status of popular Nginx Monitoring tools:
Zabbix
As of now they offer the possibility to monitor NGINX, but we still have to see an integration with the NGINX Plus Status Module for Zabbix. Their integration is with the standard status module.
Nagios
Just like Zabbix, as of now there is no integration with the Plus edition of the Status Module for NGINX. They allow the possibility to integrate with the status module, allowing users to obtain basic statistics from each server on NGINX.
Pandora FMS
Pandora FMS has total integration with NGINX monitoring, both on the Open Source and Plus edition of the Status Module.
Best Nginx monitor: Pandora FMS
At this point we’ve already talked about the main parameters you’ll need to keep in mind when monitoring NGINX, and also where to find them. Apart from this, at the beginning of the article we told you where to obtain the Pandora FMS Community Edition plugin for NGINX servers.
You’re probably thinking that if you buy the NGINX Plus Status Module, you’ll have a complete monitoring over your web servers. Well, the advantages of counting on a tool like Pandora FMS are the following:
- You’ll be able to monitor all your NGINX servers and include them in your global monitoring along with other web servers such as Apache, IIS, or whatever it is you’re running.
- You’ll not only be able to see your server’s status, but also the status for the databases used or for application servers that run important processes for your organization.
- It’ll be important to be able to know the amount of bandwidth being used, not only by your NGINX servers, but also by any application that uses your infrastructure’s networks.
- Apart from this, a web server isn’t only response time, bandwidth and number of processed requests. We also need to bear in mind CPU and RAM use, disk space and other factores that can help in other situations thanks to wholesome monitoring processes such as Pandora FMS’, which can help in a number of situations.
This monitoring integration for different applications will not only allow you to know your network statuses in real time, but also you’ll be able to detect from which chokepoint the issue is coming from when applications cease to work. As a matter of fact, the cause for this isn’t always related to the web server, even if many people say otherwise.
Monitoring Nginx Performance with Pandora FMS
Below we show a video in which you can see how to install the NGINX module for Pandora FMS in order to fully monitor your web server environment and integrate NGINX on to a global monitoring dashboard.
We hope this article has been of interest, and don’t hesitate to ask any questions that you might have. A share is also very well received!

Pandora FMS’s editorial team is made up of a group of writers and IT professionals with one thing in common: their passion for computer system monitoring. Pandora FMS’s editorial team is made up of a group of writers and IT professionals with one thing in common: their passion for computer system monitoring.