MySQL Workbench: if you do not know it you are missing out on a great ally
Introduction
When we hear about MySQL we immediately think of the powerful relational database “RDBMS”, which now belongs to the giant Oracle®. We, as application programmers, prefer to use the command line for our purposes but “MySQL Workbench” is the right answer to enjoy a visual interface in the design and administration of our databases.
In this installment we will evaluate the “MySQL Workbench version 6.3.6 Community” which is the basis for the “Standard Edition” and their main difference is the extended documentation, additional modules / add-ons and direct user support, all commercially licensed.


Although it is true that we are talking about programming with databases as an opening, we also say that “MySQL Workbench” has a very useful section in the administration of data servers and we present it as a frame of reference for our goal to monitor the handling and storage of our information, join us!
Prerequisites
In order to use “MySQL Workbench” we must definitely have a MySQL server installed, and in this case we use both applications on the same GNU/Linux Ubuntu 16 LTS, 64 bits machine, therefore the indicated graphs may be different from what you see in your computers.
The examples of data named here are fictitious and they are only for didactic purposes, any resemblance to reality will be an absolute coincidence. Certain trademarks are accompanied by a symbol like ® or © and belong to their respective owners.
Software requirements
“MySQL Workbench” (MSQLW) is designed to work with:
- GNU / Linux (Ubuntu from version 9 and Fedora from version 11 are officially certified).
- Solaris.
- FreeBSD.
- Mac OS 10.6.1 or higher.
- Windows 7 or higher.
For Windows you need “Microsoft .NET 3.5” and then you need to download the installer with the “Microsoft Installer .msi” extension.
GNU/Linux needs at least Cairo 1.6.0, glib-2.10, libxml-2.6, libsigc ++ 2.0, pcre and libzip. For this environment, in the Debian distribution (and its “flavors”) it will only be necessary to select the administrator rights with the “apt-get install mysql-workbench” command to automatically download all necessary packages and even invite us to remove from our fixed disk the libraries that are not in use in order to save space.
Hardware Requirements
To be able to use MSQLW at least we must have:
- Dual 2 Ghz core processor (4 cores recommended)
- 4 gigabytes of RAM (6 gigabytes recommended).
- A screen with a minimum resolution of 1024×768 pixels (1280×1024 recommended).
This configuration is normal in modern computers (requirements for “MySQL Server” are different).
Running MSQLW
Once we have installed it in our computer, we proceed to execute it and we will see a welcome screen similar to this one:
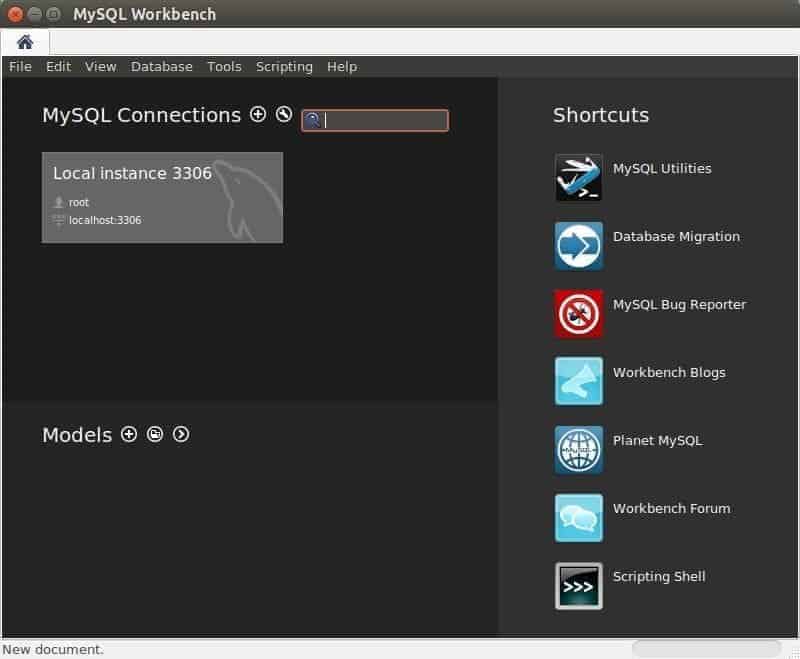
On the right side we will see the shortcuts to the options that will help us to use this tool (this is called “Central Workbench”):
- “MySQL Utilities” that run under a terminal window (command line).
- “MySQL Bug Reporter” the open source allows constant debugging by the entire community that wants to collaborate with it.
- Web links to online forums, this changes from time to time depending on the trend and the number of users who support them.
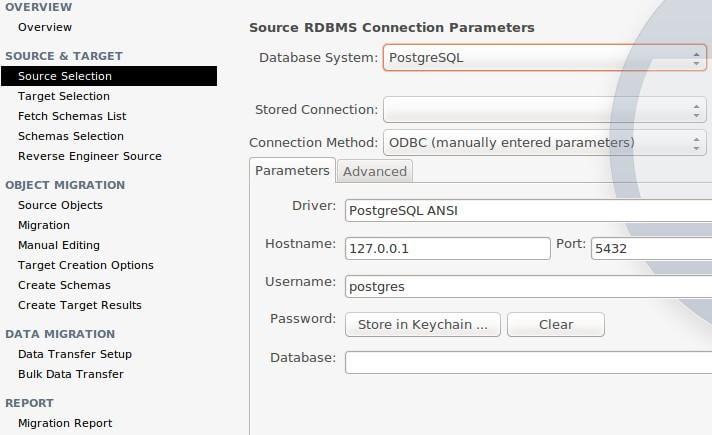
- “Database Migration” if we need to bring data to another MySQL database or even other types of databases we have this excellent assistant. We show how to start the import from a PostgreSQL database in the following figure.
We will stop by “MySQL Utilities”: by choosing this option a command terminal window will open (loved by some, marginalized by others) where it actually shows a list that does not belong to MSQLW itself, they are commands that one could run in a separate terminal window. For example, we can see mysqldiskusage, a command that will allow us to know how much space the different databases that our MySQL Server hosts (note: always execute, for security reasons, those commands through an SSH connection).
What we need to point out is that MSQLW works with its own elements and some others added, offering great flexibility to our monitoring work, let’s take a look.
Using MSQLW
MSQLW has three well-defined main areas (this is called “Workspace”):
- Structured Query Language Development (SQLD).
- Data modeling in a visual way, which also includes engineering in one direction or another between a schema (guided interaction) and a database as well as the creation, modification and visualization of objects (tables, columns, triggers, defined queries, etc.)
- Server administration which we will emphasize later.
We need to say that many options are not only limited to these areas: to name a few, MSQLW allows you to export and import data in a practical way and the option to access advanced features:
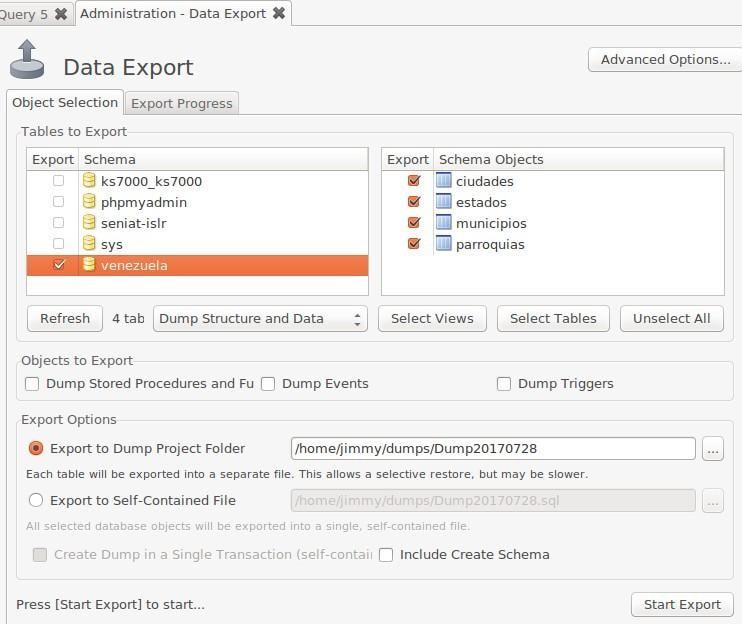
This figure already shows when we are connected to a database and we are ready to take (or back up) our stored resources but how do we connect to it?
Connecting to our database
Although we have data modeling, which we can find “off-line”, eventually this information should be stored in a database, (a very different thing is to monitor the server because in order to do this we must connect in a mandatory way). Automatically, on the left of the welcome screen, MSQLW detects our local MySQL server which we can click, enter the password and connect, however we show the connection interface by pressing CTRL + U (drop down menu “Database” → “Connect to database”):
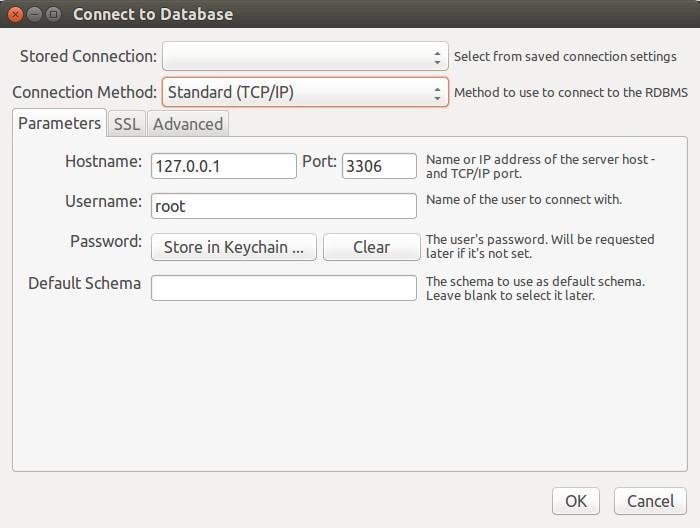
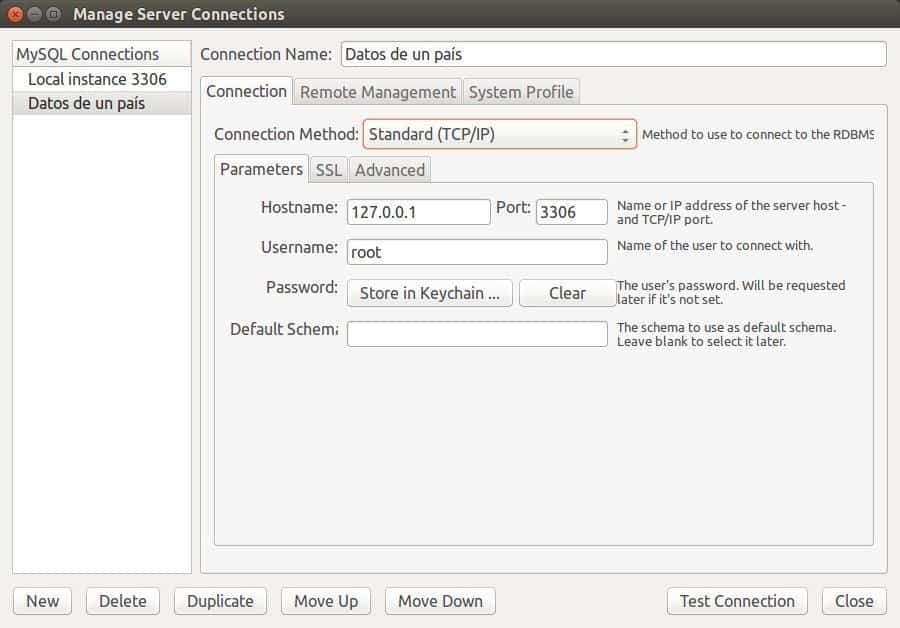
It is true that if we have several databases to manage we will save time if we make connection profiles and record them with MSQLW, these tabs can contain additional instructions like connecting via SSH (“Remote Management” tab) or elevate privileges to start or to stop the server (“System Profile” tab).
Fully connected
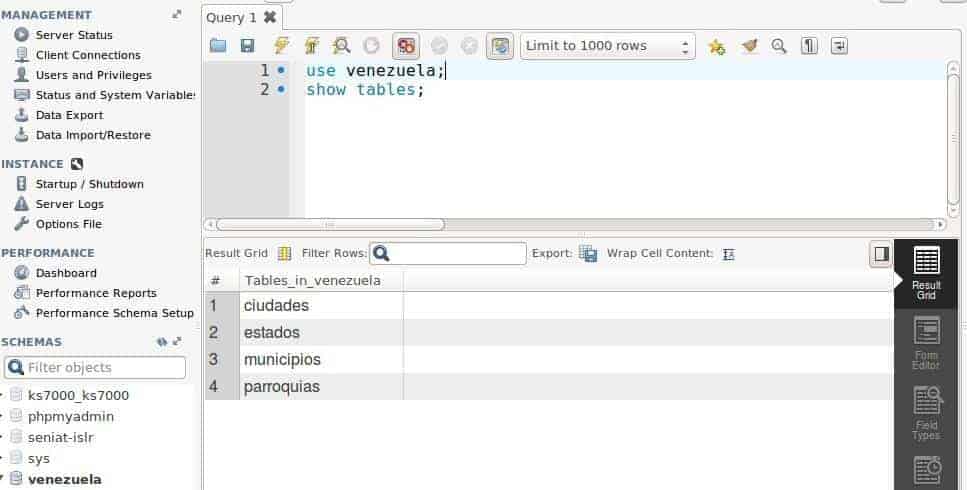
After entering our credentials we will be online and it is not surprising that the first thing that MSQLW offers us is to perform SQL commands (we must remember that this is one of the main functionalities of this software and what most people associate with).
Two quick commands will allow us to choose a database and display the tables it contains, this way MSQLW fulfils the same functions as phpMyAdmin, It is just that our environment is not a web browser, but an application of our operating system.
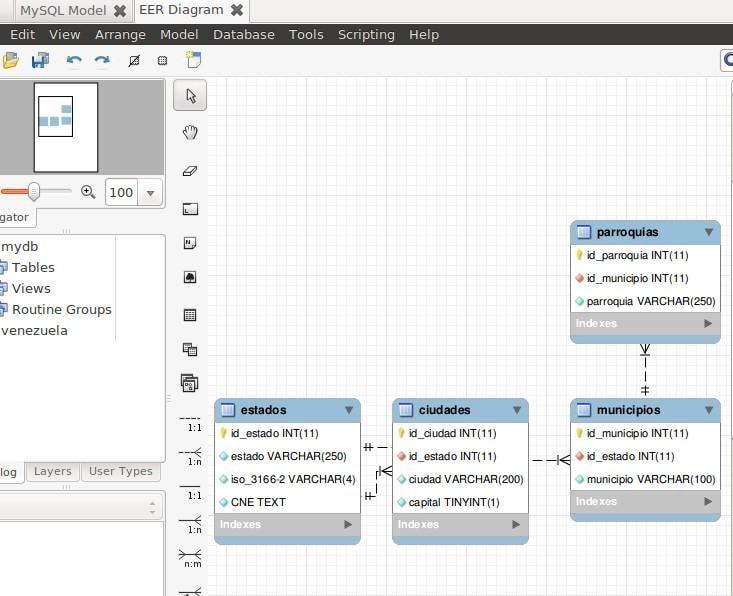
It is possible to do a data modeling and then translate it into a database. But in the event that we come to an enterprise and everything is raised beforehand, we can get an overall view. To improve the data structure of a reverse engineering process, we only need a graph to be aware of it, so it will be easier to monitor. We, as human beings, often need mental maps to do our work.
Monitoring our “MySQL Server”
Leaving aside the work of design, consultation and modification for developers, It has not taken us too long to reach our goal of monitoring: just below the option “MANAGEMENT” the first option we present is the status of “MySQL Server” in the “Server Status” section:
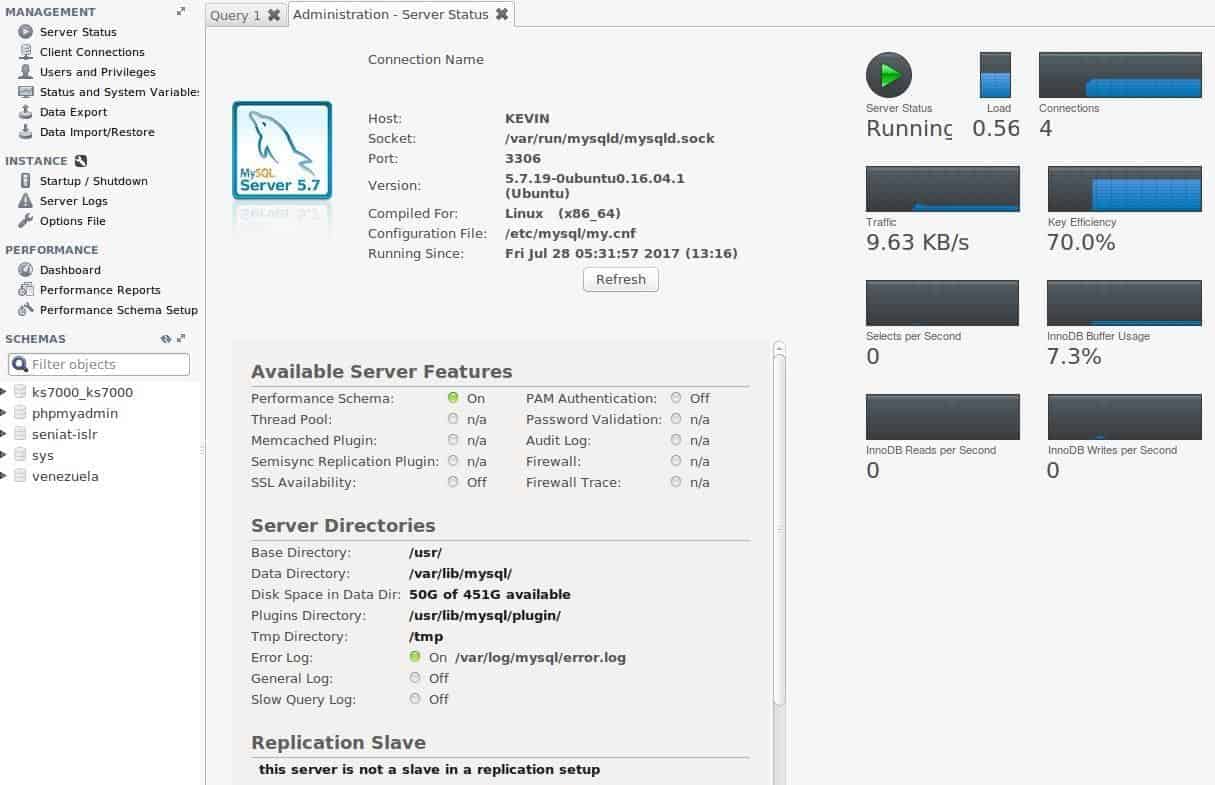
At a glance we have the information of the server’s name, we know if it is running, we know the listening port, the configuration directories, the version that was used and compiled, as well as whether it is a main server or a replica. Also, very briefly, the workload and network traffic, among other relevant values.
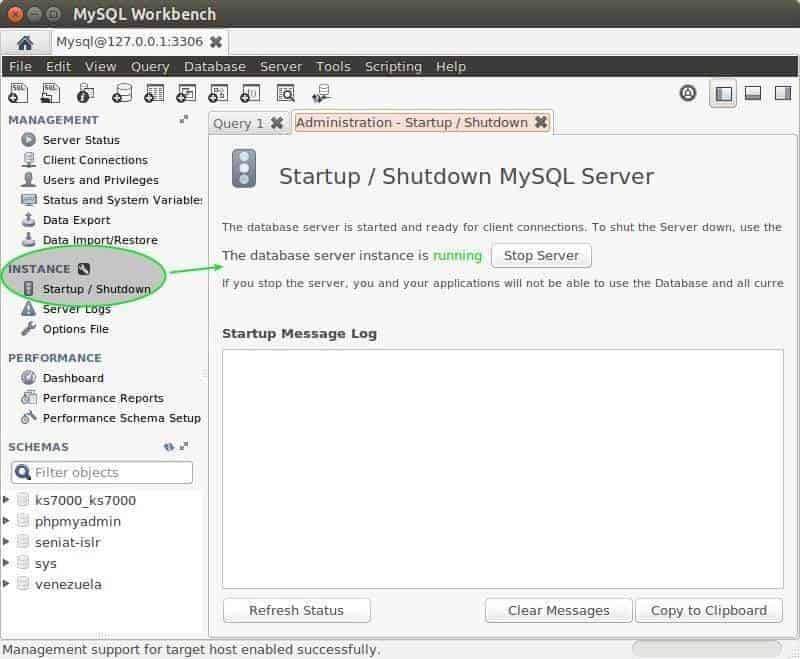
Another section that we can access is “Instance” → “Startup / Shutdown” where we can start or stop the job (here you must be careful if you are connected to a server in production): Be very aware if there are any connected users!:
Once we are here, normally we can get more details if we use the section “Performance” and then “Dashboard” where our dashboard is located.
When clicking there we will see some very important graphs such as:
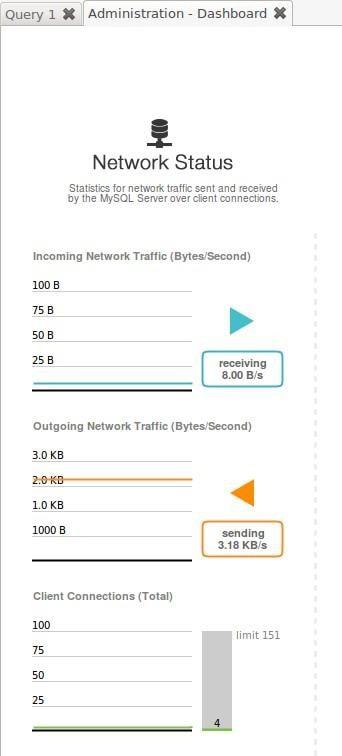
– Network traffic.
It shows the number of bytes per second both sent and received and the number of connected clients. This allows you to know the flow quickly, and also it allows us to see if we are reaching the maximum point allowed by the hardware. If we see that some of them are above 85% for a long time, this means that we should think about migrating to servers in replicas or cloud cluster on Internet in order to take on the new workload.
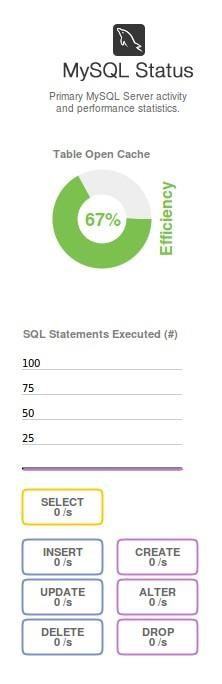
– Status of the MySQL server
We have placed this one in the second position but that does not mean that it is less important than Network Traffic. Here you can discover the efficiency of the data cache (the most requested information, which it is better to keep in RAM, to reduce hard disk wear) as well as the number of SQL executed per second and it even discriminates its different specific actions: queries (our usual thing) as well as inserted, modified and removed data – and even more frequent – the creation, modification and deletion of tables that should not happen (with very few exceptions) which is inside the field of computer security (only accounts can execute these actions).
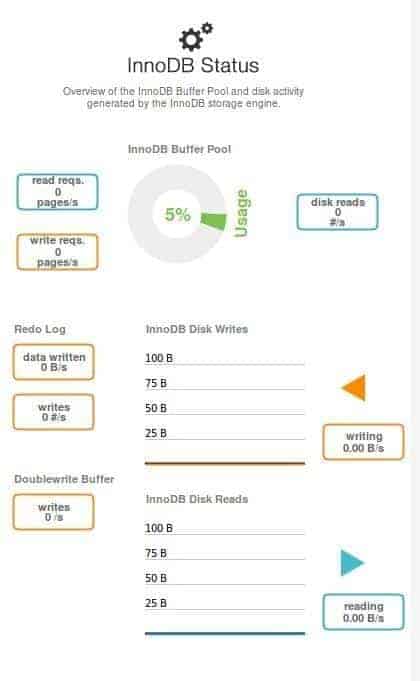
– State of InnoDB
InnoDB is an open source storage mechanism developed by the Finnish company Innobase (now also acquired by Oracle) which is very popular for its superior advantages. If our data is stored like this, MSQLW will show us the read and write requests to the hard disk ( and these requests are received by the data cache we discussed in the previous section).
InnoDB stands out for its ACID capability, which has a limit of 200 transactions per second and in order to surpass it we will need a very specialized hardware and / or the distribution of the work load between several servers, that is why this monitoring is very important.
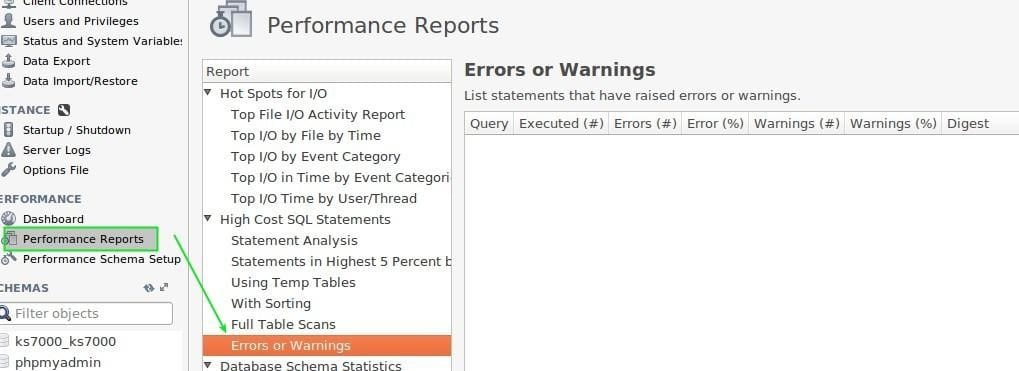
– Performance reports.
Although not in a graphical way, the performance reports are just as useful as the others, these are a series of SQL scripts stored by MSQLW programmers and executed either automatically or on demand, as we can witness in the following images.
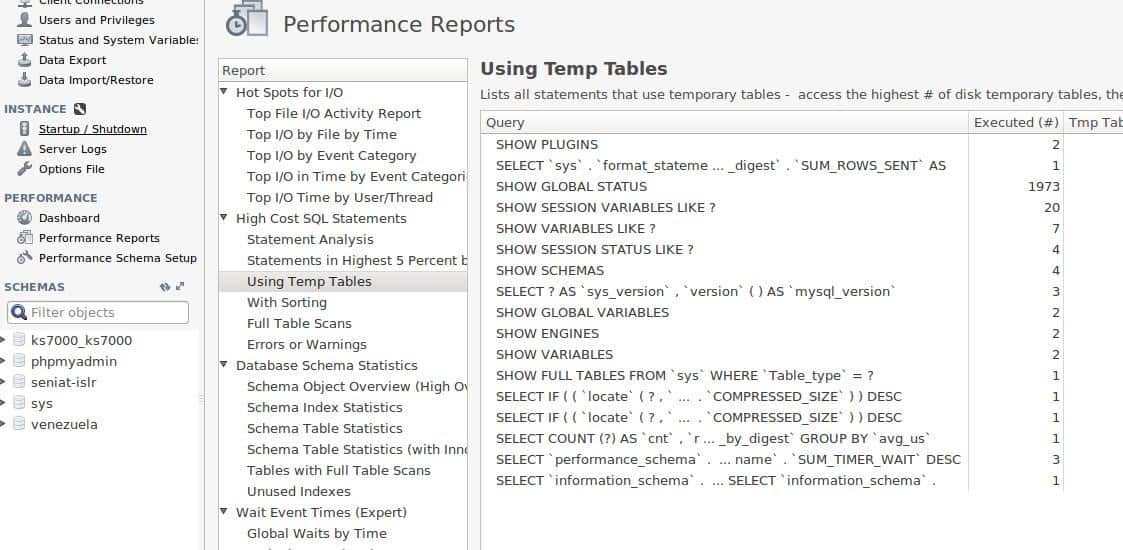
This last picture shows the temporary tables, their service time and the number of times they have been executed (placed in the columns on the right side when moving the horizontal scroll bar). But why are they priority for us? The answer is that for queries stored or created by users, “MySQL Server” saves those values in temporary tables and observing their behaviour can help us identify delays in information retribution. This and other values or sets of values will allow us to decide which performance scheme we will use in the next section.
Performance scheme.
MSQLW offers us a very simple configuration as to how to collect information so that it can be presented: so now we have reached the fifth point of server monitoring.
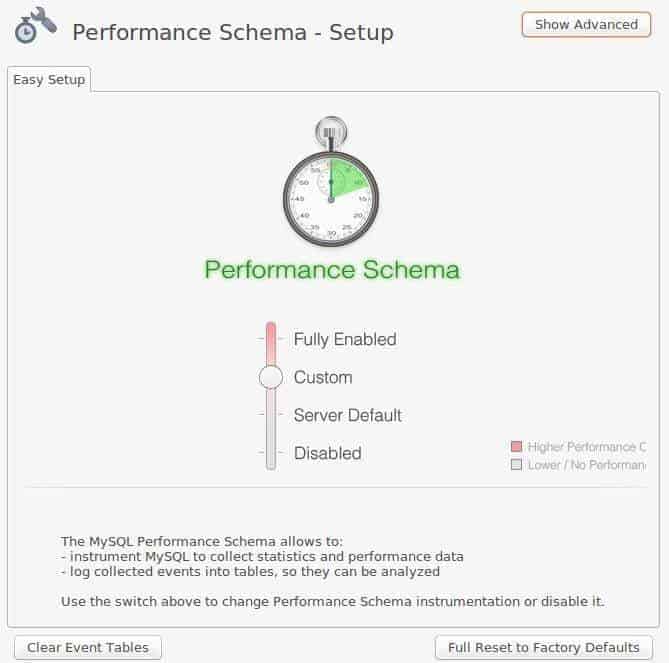
There is a delicate balance between data collection and data service: when increasing the level of demand of the first, the second decreases which is why MSQLW offers 4 basic levels.
- Fully Enabled.
- Custom (as shown above).
- By default, “Server Default”
- Disabled.
Which level is best for us? We indicate that it depends on the development phase of your software; option (a) is offered for development in test environment, option (c) is for already known, established and well cleaned software and option (d) well, it is not highly recommended.
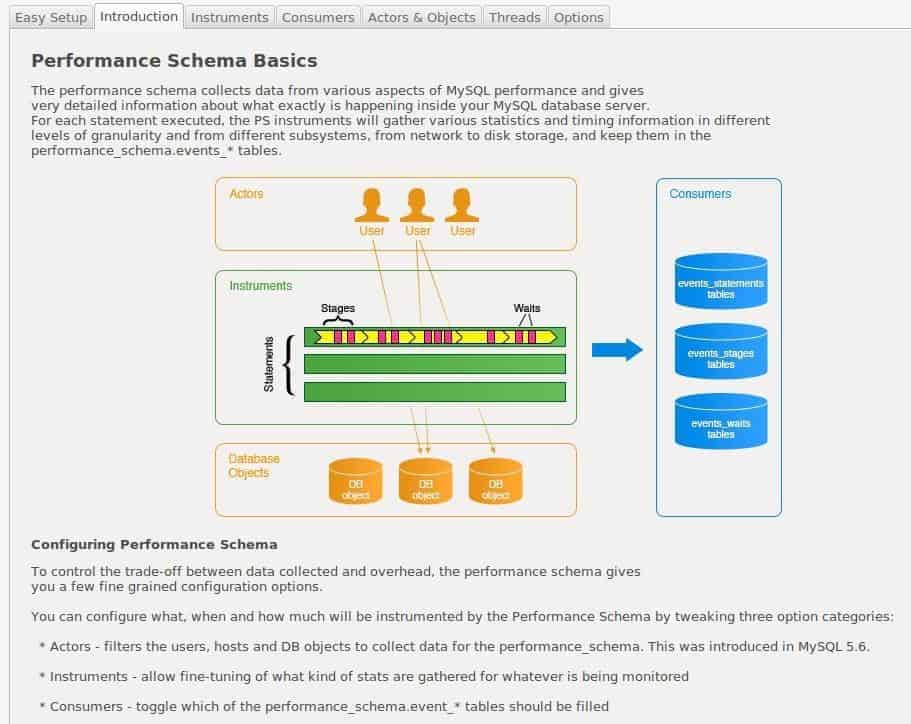
It is so advanced that we must first know the components conceptualized that we can later configure:
- Actors (users who request or process information).
- Instruments (memory, blackhole, InnoDB, MyIsam, etc.: programmed objects that process information).
- Consumers (tables where we will save the data collected).
These elements as a whole will be recorded in the following three events:- When a new request arrives and finishes (once each and every one of its components is finished, remember also that ACID transactions are “more expensive” in time and machine resources, we talked about it above).
- Each and every one of the steps covered by the application.
- The different asynchronous events that create waiting periods in each of the stages of the previous point, this allows us to detect bottlenecks and to design algorithms that deliver data in time to the following processes.
This concept is a bit difficult to understand since it involves threads of execution, which may well be independent from beginning to end or it may require information from another thread to continue. We show you a simplification that is exaggerated but illustrates in a few words the situation raised.
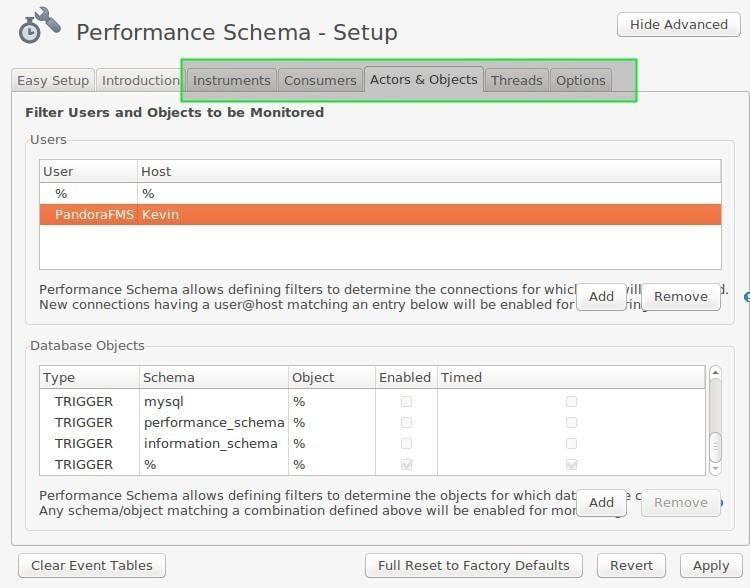
To configure all these options, we click on the different tabs of the last figure displayed, there we recommend to start by adding the users (actors) and objects (triggers that are triggered under events such as to register a user or to reach a certain number of records, etc.), then we mark the instruments that we want to monitor (InnoDB, for example) and the tables where we will save them (Consumers) taking into account the Threads of those instruments.
Expanding the possibilities of MSQLW.
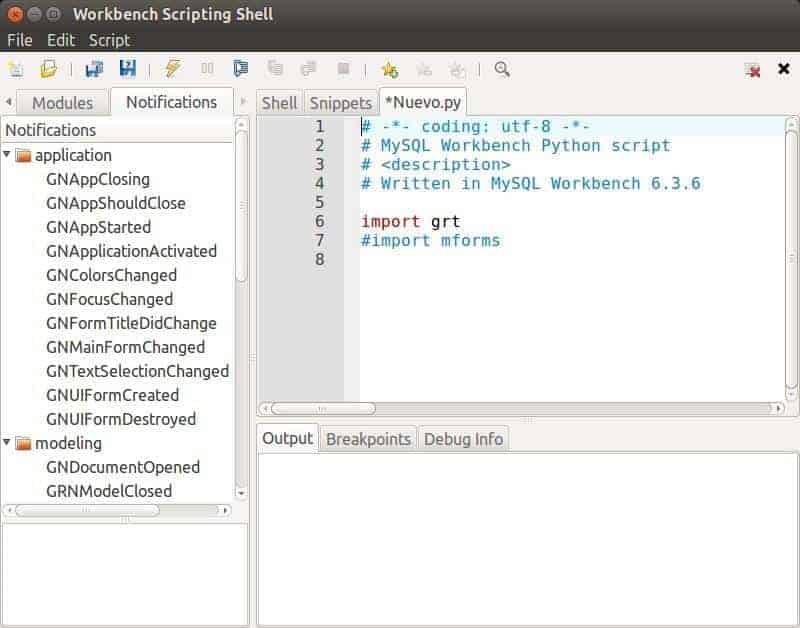
Developed under C ++ language this application accepts scripts written in Lua or Python language, the latter is currently more widespread and has many options.
With this we are able to:
- Automate common tasks, the desired award for administrators.
- Improve the user interface.
- Create add-ons.
- Handle data schemas.
- Create custom features for MSQLW.
To display a button, we can create a plugin written in Python language just by giving it a start name and MSQLW will preload the working environment with specially designed libraries such as the GUI and those that interact with the database.
Although we have not talked about everything in this article, we wanted to show you how Workbench MySQL is a great ally with virtually endless combinations.
About Pandora FMS
Pandora FMS is a flexible monitoring system, capable of monitoring devices, infrastructures, applications, services and business processes.
For example, with Pandora FMS you will be able to monitor MySQL. Take a look at this video:
Would you like to know more about what Pandora FMS can offer you? Discover it by entering here: https://pandorafms.com
If you have more than 100 devices to monitorand you want to get a FREE 30-day DEMO of Pandora FMS Enterprise, you can contact us through the following form: https://pandorafms.com/en/contact/

Pandora FMS’s editorial team is made up of a group of writers and IT professionals with one thing in common: their passion for computer system monitoring. Pandora FMS’s editorial team is made up of a group of writers and IT professionals with one thing in common: their passion for computer system monitoring.