


If you work with Google Cloud, this will interest you, because we will explain how to keep that cloud under control with an iron fist… in a velvet glove. Today we examine Google Cloud monitoring, its importance, and how that soft yet armored glove is called Pandora FMS.
We all know the saying: The cloud doesn’t exist — it’s just someone else’s computer. And for today’s operational demands, it’s nearly impossible for any organization to avoid using those “someone else’s computers” and operating in the cloud. That way, we leave behind the 1000-degree basement filled with on-premise servers, which are less efficient in power and cost.
And there’s no doubt that within today’s Holy Trinity of cloud providers — virtualization, storage, and more — one of the main players is Google Cloud Platform (GCP).
That’s why we analyze its monitoring today. Because keeping your head and operations in the cloud is fine, but your feet should remain on the ground and control in your hands, gathering key metrics on performance, availability, and security.
These metrics allow us to manage cloud services according to real needs, detect and anticipate issues, and know whether we are truly gaining in efficiency, costs, and above all, service level — both for users and customers and for internal productivity.
Key elements in Google Cloud service monitoring
Google is the company that said “don’t be evil” and then deleted it, so it doesn’t hurt to keep a close eye on it and compare it to other options that might be more beneficial.
We’ll see how Pandora FMS makes this task easier, but for now, the ideal is to focus your Google Cloud monitoring on:
- Virtual Machines (Compute Engine): They’re the backbone of many architectures, and it’s vital to monitor indicators like CPU usage, memory, disk, and network I/O to ensure that instances have the necessary resources and operate properly.
- Containers (Google Kubernetes Engine – GKE): Kubernetes container orchestration is everywhere. Monitoring here must go beyond nodes to include pod health, deployments, services, and per-container resource usage.
- Applications (App Engine): Application Performance Monitoring (APM) is crucial. You must track Service Level Indicators (SLIs) and Service Level Objectives (SLOs) to measure latency, traffic, and error rates, ensuring that performance targets are met.
- Storage and Databases: Services like Cloud Storage, Cloud SQL, and BigQuery must be monitored to track capacity, query performance, and associated costs.
These are the most common key areas, but Google Cloud has over 100 services. That’s why it’s impossible to cover everything about a company that’s also known for constantly launching and retiring products. So many, in fact, that there’s even a dedicated website for all the ones they’ve shut down.
At the time of writing this, the count is 298 and growing — which adds another layer of complexity to the cloud monitoring challenges we already face.
Common challenges in cloud environment monitoring
Although Google Cloud provides powerful monitoring tools, IT teams face major challenges when implementing a monitoring strategy.
The main ones are:
- Variability of workloads: Demand spikes and autoscaling make resource consumption unpredictable, complicating capacity planning.
- Geographical distribution: Globally distributed applications introduce latency and complexity in monitoring the user experience from different regions.
- Service dependencies: A failure in one microservice can trigger a cascade of errors in others. It’s essential to have visibility that allows tracing these dependencies.
- Global visibility: Getting a unified view of performance and security in a microservices-based, distributed ecosystem is a significant challenge.
To this, we must add that today’s cloud is often hybrid — whether because we coordinate several providers besides Google, or because we need to integrate on-premise resources.
That’s why the most important thing is a…
Unified monitoring in hybrid environments
One Ring, one Enterprise Central Computer, one Golden Throne of the Emperor is the Holy Grail of centralized monitoring — regardless of how heterogeneous our infrastructure may be.
And that’s exactly why we created Pandora FMS.
How Pandora FMS monitors our Google Cloud services
Pandora FMS has, as one of its strengths, the monitoring of Google Cloud.
To do this, you’ll need the Pandora ONE version, and monitoring is done via the Google Compute Engine plugin, accessible via Discovery > Cloud.
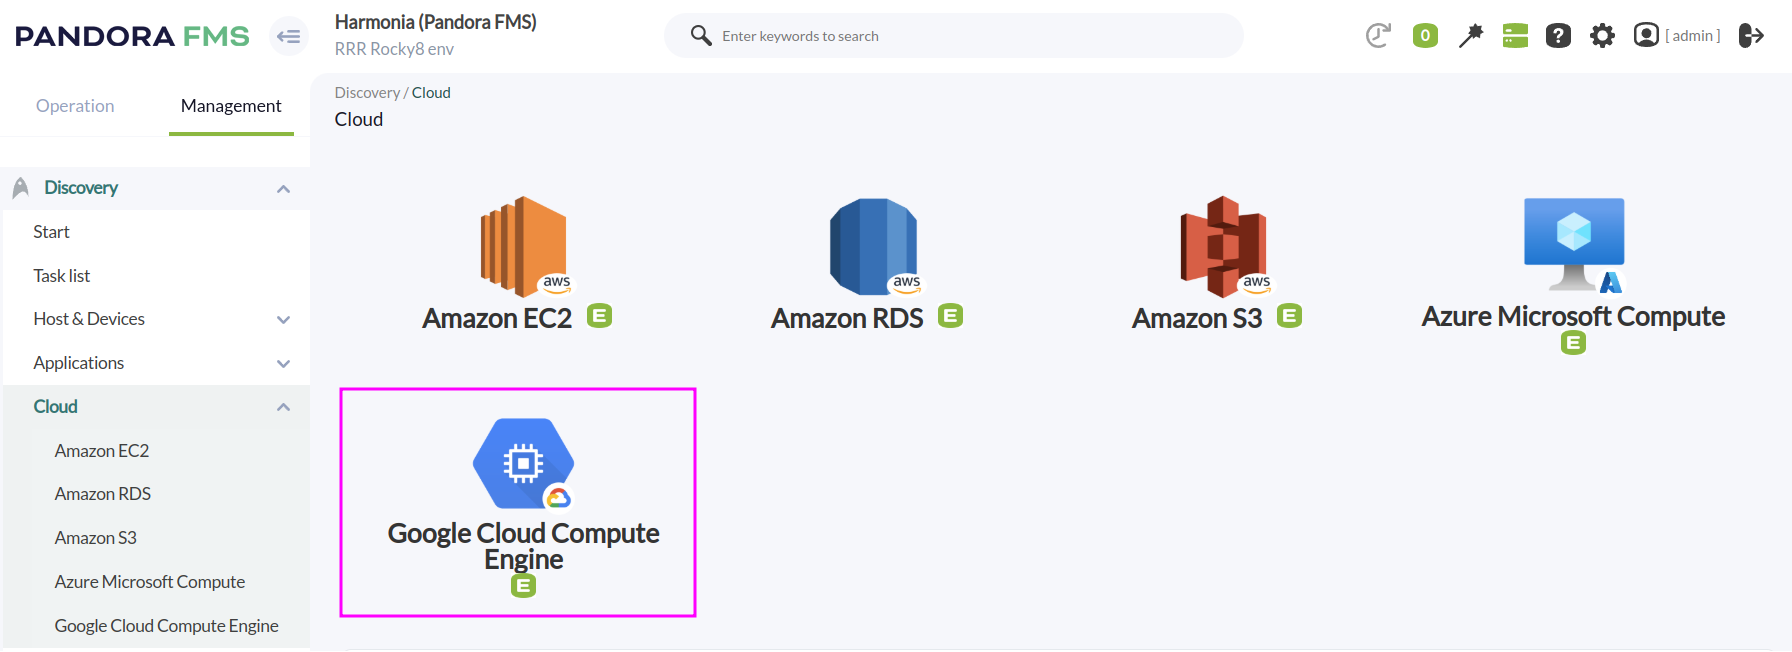
Depending on how it was initially configured, we may need to first install the .disco package linked above, via the Discovery > Manage disco packages option.
Of course, everything is perfectly documented, and once we’ve entered the initial configuration, our Google Cloud credentials, the elements to be monitored and the metrics to be collected, we’ll be able to monitor:
- Multiple Google Cloud environments.
- Predefined metrics and custom ones based on our needs.
- Generate reports and performance graphs.
- Receive custom alerts (via email, SMS, Telegram, and other chats…) in case of critical changes…
- Unified monitoring alongside other clouds like Amazon or Azure, if you also use them.
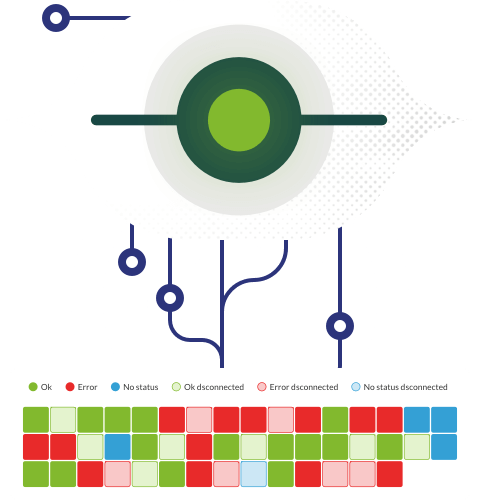
Because no matter how tech giants get along or how compatible they are, Pandora FMS brings them all to heel. It provides key information in a single place and in a consistent way, no matter where it comes from, so you always know what’s really happening.
You don’t have to take our word for it — and you’d be right not to (though my editor might delete this part), which is why we invite you to try it yourself by downloading the Pandora ONE TRIAL version for free, or requesting a demo with no commitment, whichever suits you best.
So, no matter how unpredictable Google is with its services and strategy, Pandora FMS ensures you can manage them proactively — making everything run like clockwork, in harmony with the rest of your infrastructure.

Siempre con un teclado entre manos, desde el primer ZX Spectrum que abrí de par en par para ver cómo funcionaba, la tecnología ha sido mi pasión y trabajo, de lo que hablo y lo que escribo.
Always with a keyboard in my hands, ever since I opened up my first ZX Spectrum wide to see how it worked, technology has been my passion and my work, what I speak about and what I write about.