


Blackbox and whitebox testing for a better monitoring
In the automated field of computing, some terms or trends are in from time to time. Today we will look at the concept of blackbox and whitebox testing, applying it to the science and art of monitoring.

Introduction
Today we will show a new approach to the matter of monitoring, from installing Pandora FMS (or any other software that we have selected, since we will talk for the most part about concepts) to then introduce the ideas of blackbox and whitebox testing. We will be brief in our explanation; however, we will include links so that whoever wants to delve into every aspect, is able to do so.
Collecting metrics
Every administrator of a local area network must be aware that monitoring is unavoidable and that with Pandora FMS the task becomes much easier. For this, Pandora FMS takes into account the most important metrics, but since as -for now- Pandora FMS can’t do magic, it uses dynamic monitoring: a feature that has been present since the release of our version 7.0 NG to make the installation easier.
The metrics we can collect are grouped into four categories:
- System performance indicators (hardware at the computer level).
- Database performance indicators (at operating system level).
- Application performance indicators (at operating system level).
- Network performance indicators (network level hardware,). This category alone leads to packet loss and bandwidth monitoring.
All these metrics are collected in very different ways and forms, depending on the network topology, which leads us to distributed monitoring, where we explain thoroughly the flexibility that characterizes Pandora FMS.
Alert management
After a certain amount of time (let’s say a week) collecting data, our lives will be filled with alerts (either by email or by messaging services such as Telegram or Twitter), which is completely normal and is not to be frightened or pushed back:
- If it is something really important, we will proceed to correct it and leave the alert as it is, starting to harvest the fruit of our work with Pandora FMS.
- If it doesn’t deserve more attention we can modify the alert (yes, we know that the dynamic monitoring of Pandora FMS was the one who included it, but in the end we are the ones who decide) adjusting the values to avoid excessive repetition. Each alert in Pandora FMS has a comment tab where we can justify and/or explain the reason why we modify the alert values. This way we can go on vacation and our substitutes will have a human guide present to advise them.
- It is necessary to know that an alert can be suspended so that it is not shown in the Pandora FMS desktop, either because we are going to do something punctual and urgent or we can even program it in certain schedules (for example, when it comes to backup database server data, logically the network will be congested and trigger an alert, since Pandora FMS is not aware of how our policy or way to backup data are).
- The next step would be to deactivate a certain alert, which is the most advisable thing to do instead of eliminating it, because in the monitoring field, today we have an environment and tomorrow we don’t know what will happen, so we could need it again and we’ll spare ourselves the work of creating it again. This also explains why monitoring tasks cannot be fully automated.
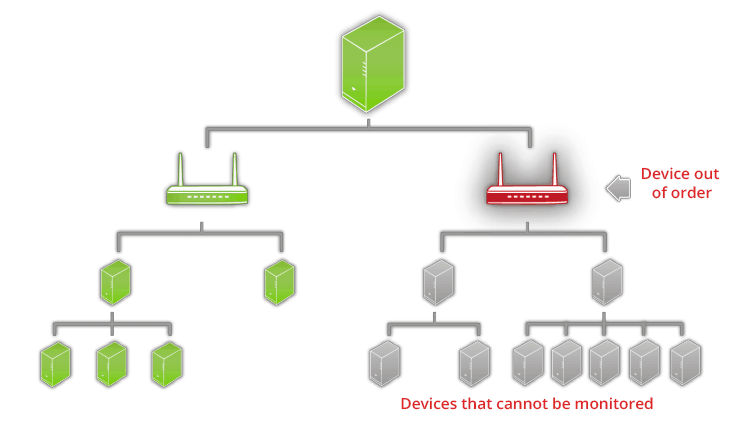
- When we modify an alert, one of the values that we can set is the maximum number of repetitions that Pandora FMS will notify us (this is like when our skin feels the first raindrops of rain, after a certain time, and being already wet, it stops informing us about it). However, there are other events that take place in cascade and trigger a large amount of mass alerts: if the modem with which they access the Internet in a certain branch office is, for example, damaged or not connected, all devices in that local area network will trigger the alarms (assuming that we do not have a satellite server). To do this, Pandora FMS has a Cascade Protection under a “parent-child” entity model: we activate the corresponding checkbox and then we go on to associate it with the parent agent. In the event that the parent officer has any critical status alerts, the child agents will not trigger their alarms.
- We cannot end this section without commenting that once all these alerts have been fine-tuned, we will be able to evolve and create generic alerts by groups of agents (in order to reuse them in new devices that we add to our networks) and even create alerts by correlation of events to identify and act in cases where no classic alert is triggered. Imagine that we have several web servers with balanced load and we have them configured to alert if any one exceeds 90% of CPU usage but it happens that each and every one of them reach 60% and up to 70% of their capacity: this is a good time to alert us to make the decision to first review what is causing the overload and if it is necessary to add more servers, if the case were the natural growth of the company and its web clients. In addition, it is even useful for detecting hardware and/or software modifications that lead to investigating and/or adding more monitoring agents (or at least their modification).
Whitebox
We can then define the whitebox model: we know our system, how it works, what the processes are, and with the help of Pandora FMS we can place agents (and even satellites) to collect the data. We are in the whitebox category because we have the complete map, we know in detail every process and the complete mechanism, there is nothing hidden or closed for us. Obviously, the collection of metrics under the whitebox scheme allows us to save time and effort, since we know in advance where and how key points work and we can monitor vertically. However, it may happen that some unknown or unexpected aspect, under certain conditions, escapes from our grip, so the whitebox test arises.
Whitebox testing
Whitebox testing is also known as a transparent box (among other names) and is actually out of our reach as it belongs to the development team and operations team (which we are attached to as a monitoring team) and takes advantage of our knowledge of the software and system to make it part of a test process. It happens that, under certain circumstances that we have detected by our alerts, based on metrics well collected by the whitebox model, we can indicate the exact conditions to reproduce a certain exception. The advantages are clear:
- We obtain a better overview of the situation.
- Helps optimizing the code.
- Introspection of programmers, awareness of their actions.
- Allows finding hidden errors.
- All this leads to efficiency in finding errors and problems.
Disadvantages of whitebox testing:
- We need to know the source code of the involved software(s).
- Requires a high level of understanding and experience of the affected program.
Monitoring software using the whitebox model
Apart from Pandora FMS itself, there are many other softwares that use this model, some time ago, we published an article about Zabbix (where we will be able to see its operation in detail even though it is a comparison); we also have PRTG Network Monitor (which we evaluated and is of the same weight and size as Pandora FMS but with proprietary software).
When users report that “the system is going slow,”
Although we already have our Swiss pocket knife (Pandora FMS) and we are more ready than a child explorer, at some point the dreaded qualitative report of one or more end users will arrive:”the system is slow“.
With reports, our patient must be that of a saint: from our users, whether it’s employees or clients (the latter will have no shame in complaining, with or without a reason), here is where we must sharpen our wit. For the users who are employed by us, we should indicate the most appropriate method to report any problems.
In the case of the company’s customers, we must rely on the customer service department. This doesn’t mean that the battle is lost, but that it’s time to use the artillery we have in Pandora FMS.
Applications that interact with users
Today, our world of information is divided into two types of applications: on one hand, the usual one, which is installed in an operating system through a suitable process and properly configured for that particular environment, which we have always known as vulgar desktop applications (compiled especially for a particular environment).
On the other hand, there is, ironically, also a desktop application but which during the last ten years has gained a tremendous prominence thanks to the add-ons developed for it: our web browsers. A web browser programmed with free software such as Mozilla Firefox offers developers the typical HTML (CSS included) and JavaScript languages, giving us a well known and secure environment, regardless of the operating system installed or hardware used. But even more, it allows us to incorporate plug-ins for a wide variety of tasks, from games to emulating operating systems or simply running virtual terminals. Programming is progressing more and more towards this sector, given the obvious advantages.
Monitoring desktop applications
Pandora FMS has for the Windows operating system the Pandora Desktop Robot (PDR) which will allow us to record actions on any installed software and obtain its results (right execution or not, processing time) that later can be sent to our monitoring server to evaluate the data.
It is recommended to install the PDR and the probe in virtual machines with auto-start and user auto-registration in order to record the actions, save them and we’re ready to go. We can have these virtual machines running continuously to run periodic tests or launch them when a user reports a problem to us. To do this, we will reproduce the situation once only because we will save it and program it to run autonomously many times, then analyze the results and confirm either the error or the error in the report.
A more daring option is to install it through Active Directory on the end users’ machines and from there, from the real environment, run our tests. This option must be carried out very tactfully, even on specific users who repeat the same report over and over again.
Monitoring web applications
There are two components that we can monitor: on the server side and on the client side. On the server side we will make use of the whitebox model because we know how it works, to which database it connects, the languages used, etc. But on the client’s side we will make use of the Pandora Web Robot (PWR) that allows the navigation through web sites simulating user actions and collecting the results as if it was just normal monitoring. You can watch this explanatory video on Youtube.
Among the possibilities of this monitoring, it’s included the ability to install virtual or real machines in different geographical situations, let’s take the case of different cities and even continents pointing to the same web server, this will give us a real panorama and most importantly, a quantitative report that can be confronted with what is reported by users (corrective mode) or by tasks programmed by ourselves (preventive mode).
Blackbox
The last thing we’ll see is the blackbox model because we can apply it even if we don’t have the data of a whitebox model at hand (in fact, it’s an independent model). The blackbox model can be used in any desktop application or web application and start collecting data for a while as if it were normal metrics and averaging values (again, let’s take a week per subject) to generate alerts from there.
It’s called blackbox model because we don’t know how applications work, where they go and where they come from, what we know is what the end user sees, who will tell us which processes are critical and that we will analyze and monitor in search of deterioration (or perhaps improvement) in software performance. We are at the final end, where we only know the result and have no idea what causes it.
We can see this blackbox model as an audit process: a company hires us to review its software in different environments but does not provide us with the source code or allow us to access their servers, only their API or WEB services as the case may be. Its operation is hidden but we can quietly send our reports quantitatively where the values are extended/exceeded or when they have changed significantly (a value of 10% is always a good variation reference, for better or for worse) and in different conditions (time, geographical location, connection method, different computers and/or operating systems, etc.).
In the development of proprietary software blackbox model is very handy: Pandora FMS is the tool to test and / or take to the extreme future applications that will reach users without compromising the source code or touching the servers or infrastructure. In other words, we monitor even before the production stage begins, like a kind of beta user but with very specialized tools.
Following the last example, our client may be interested in finding out where it happens or what causes the problem, but we will not be able to give that answer since we were hired to work under the blackbox model and said model only evaluates results, not the causes, unless we have Pandora FMS in our arsenal.
Blackbox testing
Blackbox testing (also known as functional testing) treats the software under test as a whole without knowing its internal components. The tests use software interfaces and try to ensure that they work as expected. As long as the functionality of the interfaces remains unchanged, testing should be successful even if internal functions are changed. The blackbox test is “conscious” of what the program should do, but has no knowledge of how it does it. Blackbox testing is the most commonly used type of testing in traditional organizations that have beta users as a separate department, especially when they are not coding experts and have difficulty understanding the code. Provides an external perspective, such as an audit, of the software under test.
Software that uses blackbox model
Nagios (although its agents are a bit cumbersome to set up) is a software in the end, itt actually gets its metrics this way.
Monitoring: whitebox and blackbox
Pandora FMS is designed to adapt to many of the challenges that arise, each company has its particularities but it does not mean that we are not prepared at all. The monitoring of services is something very different from the usual thing: the services will be that series of functions that we offer to our clients or collaborators. These services, in short, will be low level (whitebox model) or high level (blackbox model) so it is a mixed working model and we even dare to say that it is the most appropriate but also the one that involves more work because both results must be combined and delivered to the development and operations teams in order to find the solution to the errors or find possible performance improvement.
Conclusions
We have covered at least 80% of the monitoring material, in the most enjoyable way possible. If you wish, you can add our article to your favorite websites so that you can read -and discover- in several days the reason why we are so passionate about our work: it includes programming, network administration and assistance to end-users, users programmers and even robots – what a titanic task!


About Pandora FMS
Pandora FMS is a flexible monitoring system, capable of monitoring devices, infrastructures, applications, services and business processes.
Of course, one of the things that Pandora FMS can control is the hard disks of your computers.
Would you like to know more about what Pandora FMS can offer you? Discover it by entering here: https://pandorafms.com
If you have more than 100 devices to monitor, you can contact us through the following form: https://pandorafms.com/en/contact/
Also, remember that if your monitoring needs are more limited you have at your disposal the OpenSource version of Pandora FMS. Find more information here: https://pandorafms.org
Do not hesitate to send us your queries. The Pandora FMS team will be happy to assist you!

Programmer since 1993 at KS7000.net.ve (since 2014 free software solutions for commercial pharmacies in Venezuela). He writes regularly for Pandora FMS and offers advice on the forum . He is also an enthusiastic contributor to Wikipedia and Wikidata. He crushes iron in gyms and when he can, he also exercises cycling. Science fiction fan. Programmer since 1993 in KS7000.net.ve (since 2014 free software solutions for commercial pharmacies in Venezuela). He writes regularly for Pandora FMS and offers advice in the forum. Also an enthusiastic contributor to Wikipedia and Wikidata. He crusher of irons in gyms and when he can he exercises in cycling as well. Science fiction fan.


