Sections
- What is database monitoring?
- Why database monitoring is important
- Database Performance Monitoring vs Database Activity Monitoring
- Key metrics in database monitoring
- Monitoring by database type
- Common issues detected by monitoring
- Best practices for monitoring databases
- What a database monitoring tool should include
- Database monitoring, observability and CMDB
- How Pandora FMS helps monitor databases
- Frequently asked questions
- Conclusion
If the database goes down, the domino effect that ruins our week begins, because the next things to collapse are the applications, then customers, reports, automations and, finally, the morale and sanity of the on-call rotation.
That is why this guide covers what database monitoring is, which metrics to track, which issues it detects, which best practices to apply and how it fits into our global observability strategy.
With it, we will own a Palantir that will allow us to know everything and, more importantly, act in time before the inevitable sparks turn into a fire.
What is database monitoring?
Let us begin with the unavoidable theory.
Database monitoring consists of continuously supervising the availability, performance, queries, connections, storage, replication, errors and capacity of the engines that support our critical data. The goal is to detect issues before they affect the service.
Or, put another way, to be The Catcher in the Rye and not wait until the user kindly shouts at us that the website is crawling. Before reaching that point, monitoring should allow us to detect and correct.
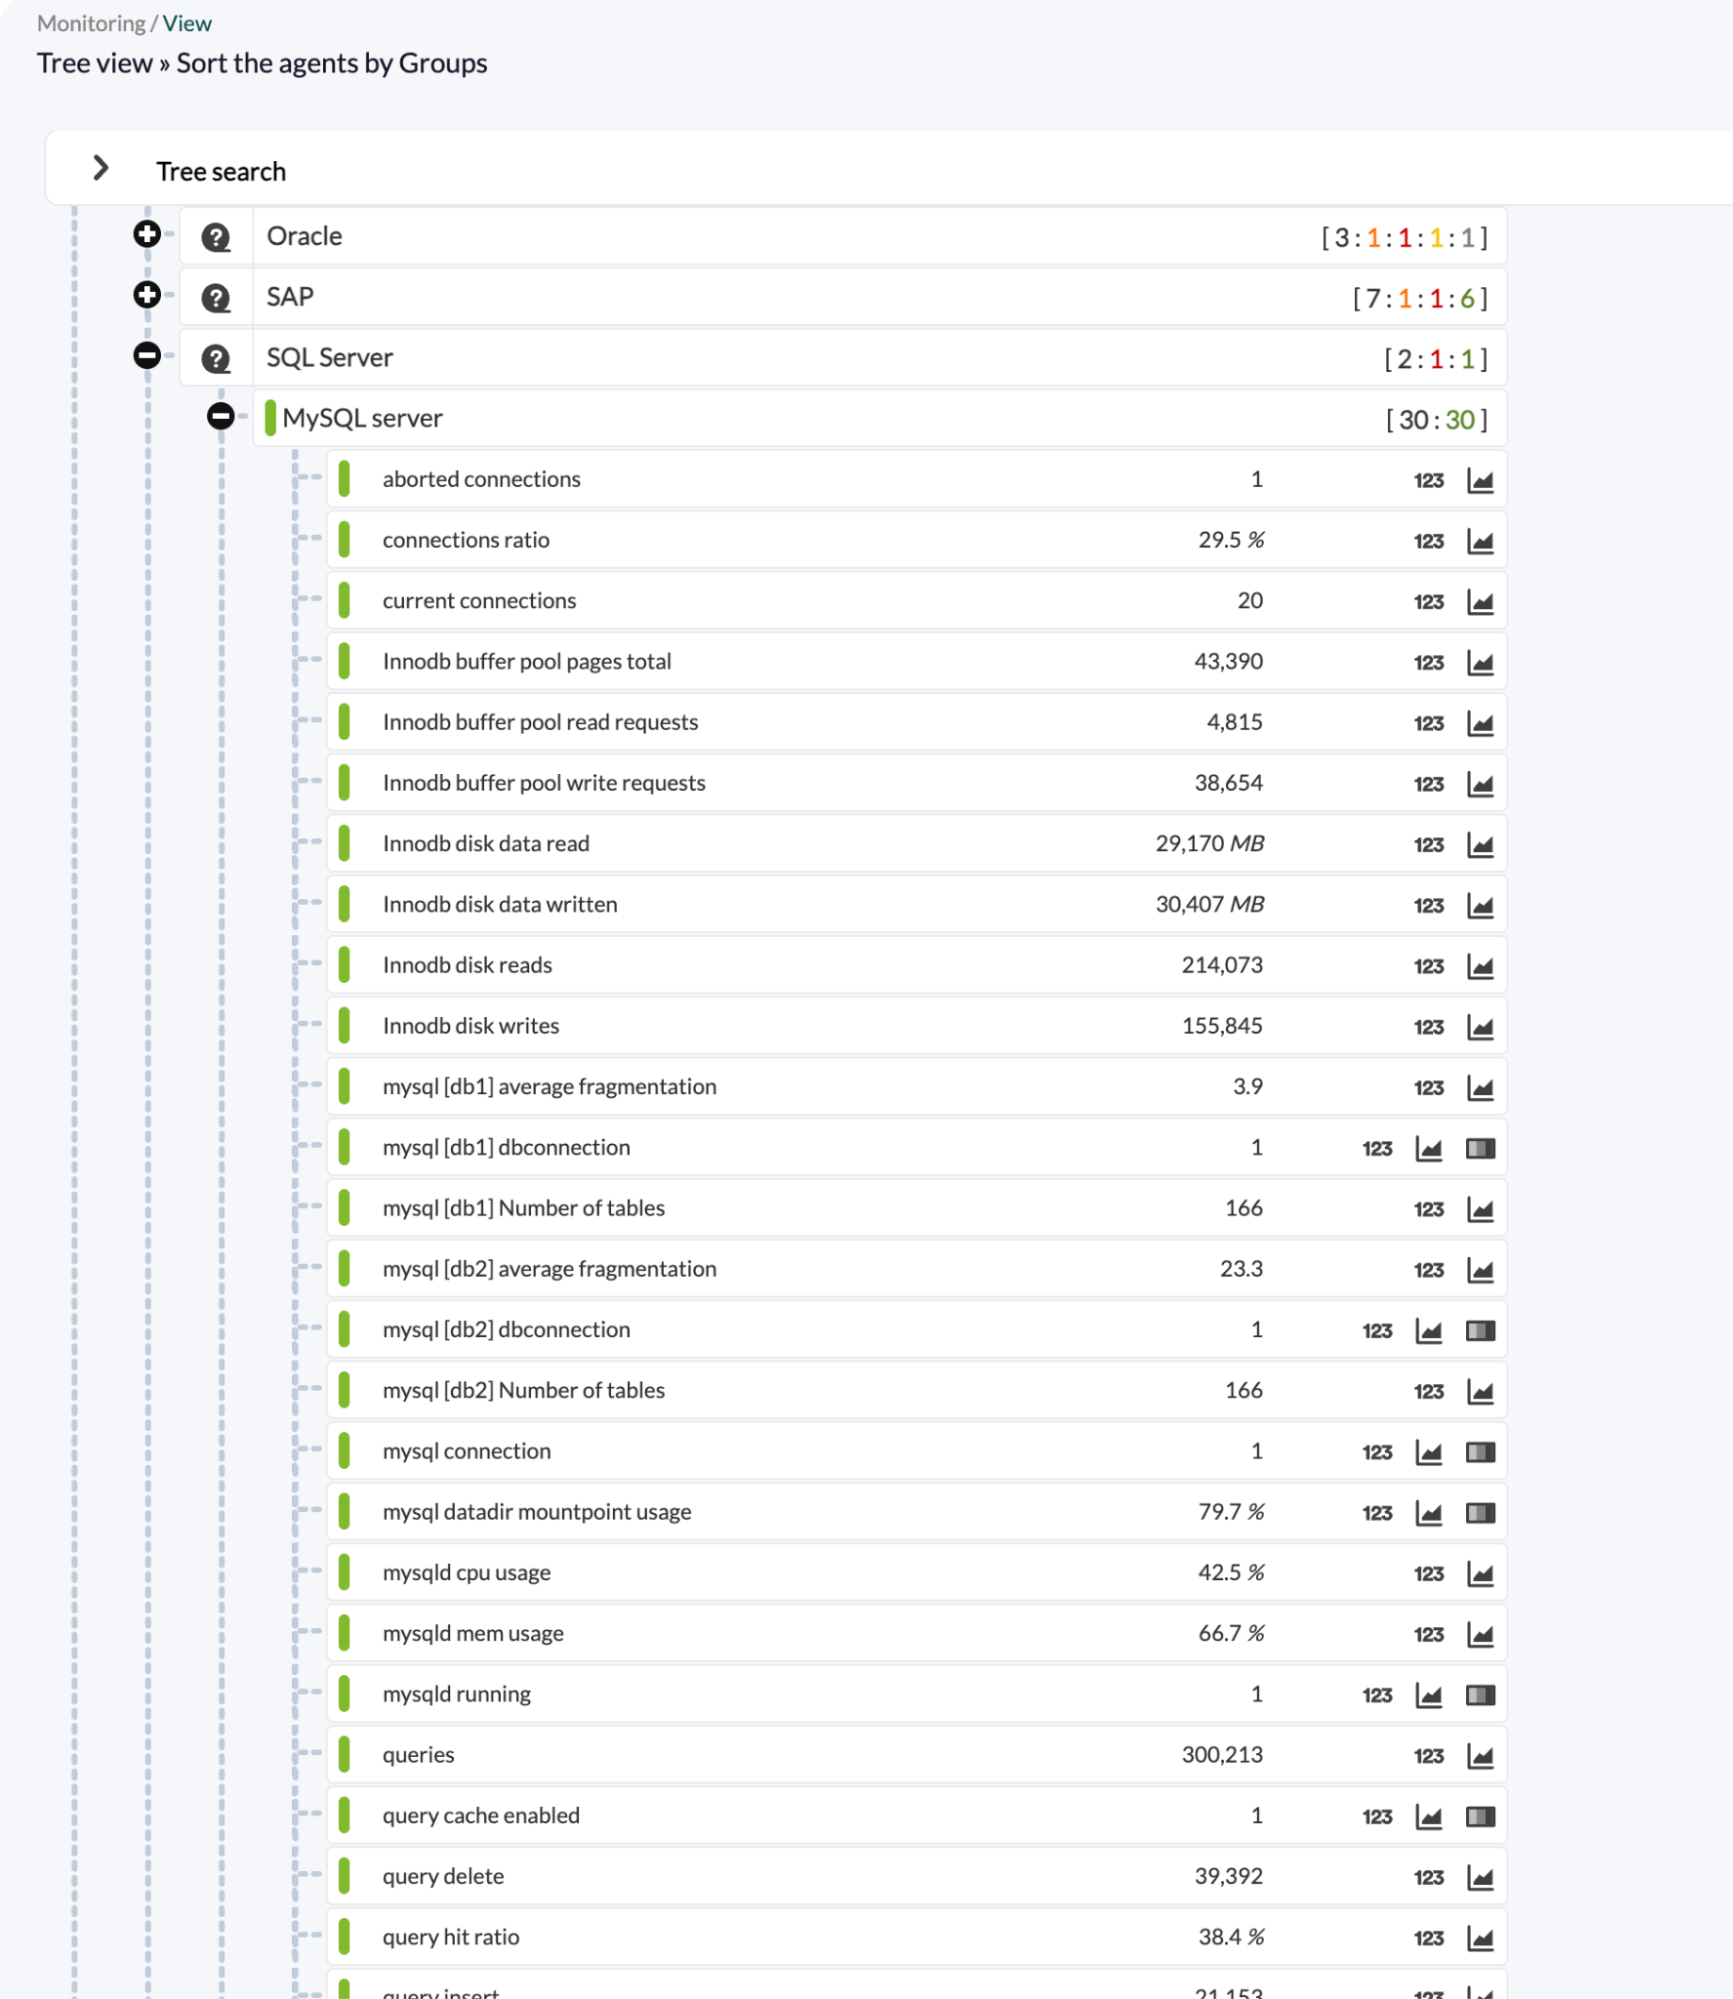
General and consolidated view of MySQL in Pandora FMS, enabling fast visual control of database status
Why database monitoring is important
The reasons are as obvious as they are often ignored:
- Reduce service outages: by detecting connection saturation before it collapses the service.
- Detect any degradation before it reaches the user: for example, a query that goes from 50 ms to 800 ms is a warning to act on before it becomes an issue.
- Avoid storage saturation: because disk space usually fills up slowly when nobody is watching, rather than striking all at once.
- Optimize queries and resources: by identifying the queries that are choking the database engine.
- Anticipate capacity issues: knowing how much time we have left before arguing with finance to get more hardware or a scale-out.
- Reduce MTTR: mainly by helping the team stop fighting fires blindfolded.
- Understand dependencies between database, application, server and network.
The concept of the “Black Box” is currently fashionable in IT and, without monitoring, the database becomes one that only shows signs of life when it stops showing them. At that point, all that is left is to run in with a defibrillator like in those medical series where everyone ends up involved with everyone else.
Database Performance Monitoring vs Database Activity Monitoring
When database monitoring enters the conversation, these two approaches usually come with it, and it is worth understanding them without mixing them up:
- Database Performance Monitoring (DPM): monitoring focused on performance and operations. It tracks latencies, slow queries, throughput, connections, locks, CPU, memory, disk and network usage, replication, storage and availability. In other words, this is what is usually understood as “database monitoring”.
- Database Activity Monitoring (DAM): in this case, monitoring is focused on activity, security and auditing. It observes data access, users and sessions, sensitive queries, unauthorized changes, anomalous behavior and regulatory compliance.
Knowing this, this guide focuses on the first approach, DPM, covering performance, availability and operations, although it is worth noting that activity monitoring is also part of a complete strategy when regulatory or audit requirements are involved.
Key metrics in database monitoring
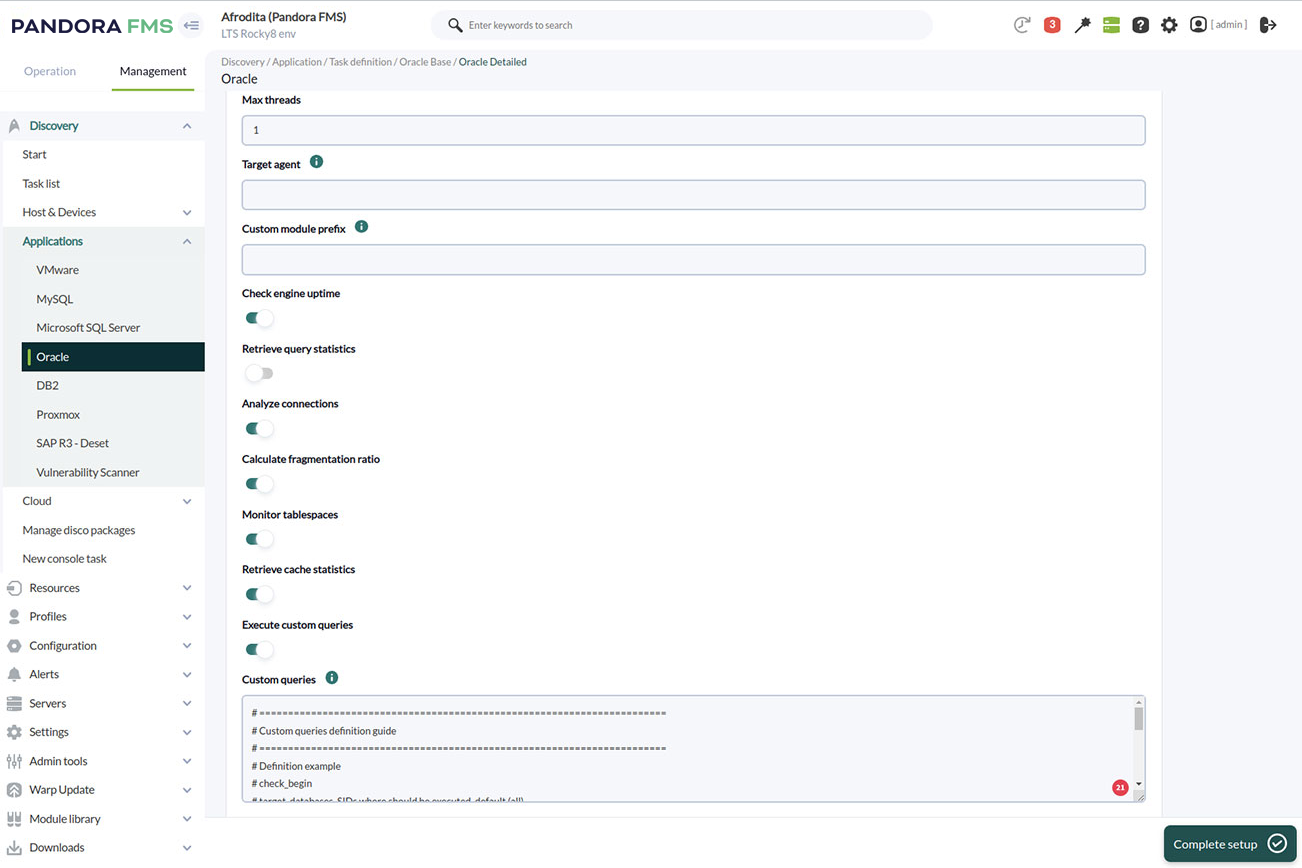
Selection of metrics in Pandora FMS for monitoring an Oracle database
In practice, monitoring provides metrics, but of course, life has always had its hierarchies, and not all of them should carry the same weight in our decisions.
That, and the fact that a dashboard full of charts nobody looks at is just expensive noise.
That is why this is the wheat we need to separate from the chaff and always keep under control.
Availability and service status
The first thing to monitor is whether the databases are running, obviously. This involves key indicators such as:
- Uptime or engine availability.
- Response to health checks.
- Connection errors.
- Status of nodes or instances in a cluster.
Performance
Beyond simply running, we are paid to make them run efficiently and not drag their feet when processing queries. This involves monitoring metrics such as:
- Latency of those queries.
- Average response time and 95th/99th percentile.
- Slow queries.
- Throughput in queries per second.
- Locks, deadlocks and waits.
Resource usage
Effectiveness and efficiency are not the same thing, and we want both, so running fast should not mean processors without running processors hotter than the sun or burning through RAM that’s currently worth more than my kidneys..
For that, we monitor:
- CPU consumed by the engine.
- Memory used and free (buffer pool and cache).
- Disk (free space, IOPS, latency, etc.).
- Network (traffic and errors).
Connections and sessions
Here, what matters is the who, how and how much of usage, which means knowing:
- Active connections and configured maximums.
- Connection pool saturation.
- Blocked or waiting sessions.
Storage and growth
Databases tend to do the same as me, mysteriously pack on the pounds, especially when nobody is watching what I do.
To prevent our databases from taking over everything like the tribbles from Star Trek, we need to monitor:
- Size of databases and tables.
- Growth per unit of time.
- Free space in tablespaces or volumes.
- Index status (usage, fragmentation).
- Log volume (transactional and application logs).
Replication, clustering and high availability
These indicators are essential in modern database management monitoring:
- Replication lag to prevent users from accessing outdated data.
- Replica status and whether they are online, delayed or down.
- Failover and switchovers for failures, emergencies or maintenance.
- Node synchronization to verify data consistency between nodes and ensure that quorum is active to maintain system integrity.
Backups and recovery
No matter how good and fast we are, disaster will eventually catch up with us, so we also need to be humble and work with a safety net, not just a network, although that too.
To do this, we must monitor:
- The status of the latest backup.
- Age of the last successful backup, which is what truly feeds our Recovery Point Objective (RPO).
- Errors in backup processes.
- Duration of the latest test restore. This is the honest way to validate the RTO (Recovery Time Objective), because a backup that cannot be restored is a false illusion of security.
Monitoring by database type
Pandora FMS monitoring a timeless corporate classic, an IBM DB2 database
Just as metrics are not all the same, neither are databases. Each data model therefore requires its own monitoring approach.
Although I cannot go into full detail on each one here (well, I could, but this would turn into The NeverEnding Story), you have a complete guide to the types of databases. There, we cover the taxonomy, while here we focus on what to monitor in each case.
As we will see, some things are common to all databases, such as availability or latency, for example, while others are more specific to the type of database, such as traversal or traversal time when dealing with graph databases.
Relational databases
Here we include MySQL, PostgreSQL, Oracle, SQL Server or MariaDB, and it is rare for our IT infrastructure not to have one of these (or, rather, several).
Here, the focus should be on:
- Slow queries.
- Locks.
- Connections.
- Indexes.
- Replication.
- Storage.
- Transactions.
Of course, the first step to get started is their official documentation: PostgreSQL, MySQL, SQL Server and Oracle.
Document-oriented NoSQL databases
In this case, names such as MongoDB, Couchbase or RavenDB come to mind. Here, it is essential to monitor:
- Operations per second.
- Memory usage.
- Replication.
- Indexes.
- Query times.
- Errors.
- Collection growth.
For this, MongoDB has specific documentation, and in this guide on how to monitor RavenDB, we go into detail to give you a hand.
On the other hand, if you want a broader view of the non-relational side of databases, this guide to NoSQL databases provides a useful overview of the landscape.
Key-value and cache databases
Redis or Riak enter the field in this case, and we need to keep a close eye on:
- Memory consumed.
- Key expiration by TTL (expired keys).
- Evictions due to memory pressure, which, be careful, are not the same as expirations.
- Cache hits and misses.
- Persistence.
- Connections.
- Latency.
If we use it, Redis documentation on benchmarks and optimization is a must-read reference.
Column-oriented databases
Cassandra or HBase are common names in this territory, and we need to be very clear about:
- Cluster status.
- The compaction process—the internal “cleaning and optimization” these databases perform due to the way they operate.
- Read and write latency.
- Partition distribution and size.
- Replication.
Here, at least, Cassandra documents its metrics in detail.
Graph databases
Here we find candidates such as Neo4j, where we need to properly monitor:
- Traversal times, the path through the graph, to check whether it is efficient.
- Memory used in complex queries.
- Graph size in number of stored nodes and relationships.
- Query latency.
- Availability.
Time-series databases
InfluxDB, TimescaleDB, Prometheus or OpenTSDB are the names we will hear in this case, and what we need to monitor here includes:
- Ingestion per second, data points received per unit of time, to identify bottlenecks.
- Series cardinality, or the number of unique tag combinations, the metric that causes the most headaches when it spikes because it can exhaust RAM and/or block the database.
- Effective retention. Essential for cost control and to prevent occupied space from escalating.
- Disk usage and compression ratio. If it is low, storage is not efficient.
- Query latency.
Common issues detected by monitoring
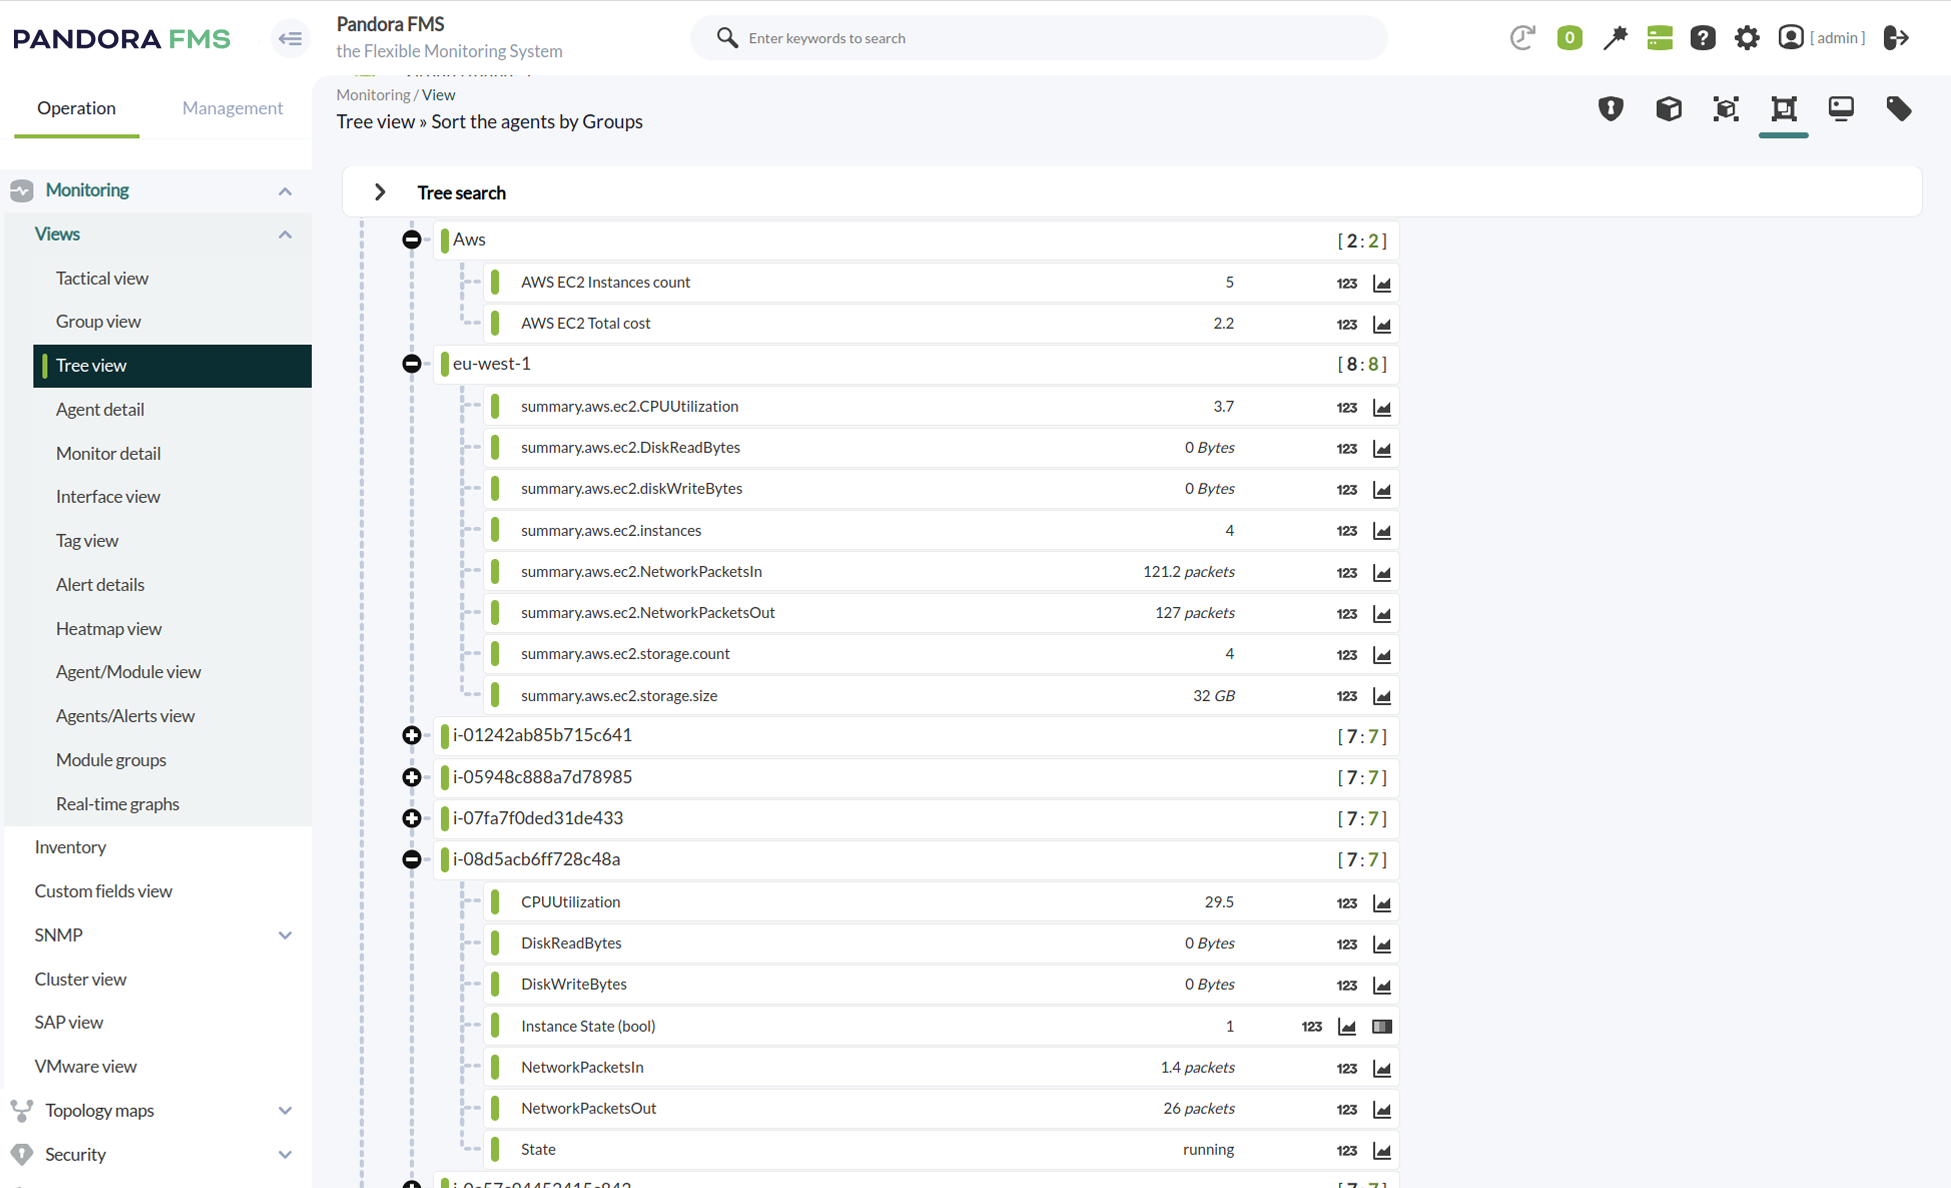
Pandora FMS providing an overview of a database status according to the defined metrics.
In the medical series I mentioned earlier, they strive to find increasingly rare diseases, because drama, novelty and challenge make for good television. However, the reality of database monitoring is usually much more prosaic and, after many years of experience, the same clinical pictures almost always appear.
These usual suspects are:
- Sloooooow queries piling up.
- Connection saturation, with everything trying to enter through the door at once like in a Marx Brothers film.
- Anomalous storage growth.
- Lack of disk space due to the above.
- Performance degradation caused by poorly maintained indexes.
- Replication errors or growing lag in that key process that ensures we all work with the same data.
- Failed backups that nobody notices until the heart-attack moment when you need them.
- Intermittent outages and the flapping effect, like those unstable and irritating light bulbs that never stop flickering.
- Anomalous CPU or memory consumption.
- Desynchronized nodes in the cluster.
- Degradation caused by the network or underlying infrastructure.
Good monitoring turns several-hour outages caused by any of these issues into a preventive adjustment of just a few minutes.
Best practices for monitoring databases
In Game of Thrones, Joffrey Baratheon, that miserable little creature, wields the sword Widow’s Wail, a majestic work of Valyrian steel… Completely useless in the hands of an inept coward. The same happens with monitoring. It is a tool, and that makes it only as good as the decisions and skills of the person behind it.
That is why, even if we deploy cutting-edge monitoring applications such as Pandora FMS, the reality is that best practices are the foundation of the house we are building.
And the best among them are:
- Define thresholds according to criticality and real behavior, not by copying default values or the ones we saw in the latest “viral content” on LinkedIn.
- Separate informational, warning and critical alerts, so so we don’t overwhelm the delicate sensibilities of anime-loving technicians with trivial notifications.
- Avoid alert fatigue: because alerts are very tempting and, in IT, we tend to be control freaks, but if everything is urgent, nothing is.
- Correlate database metrics with server, application and network metrics, because nothing is an island, especially not in IT.
- Monitor trends, not just point-in-time states, because slow growth, for example, is a warning sign.
- Review capacity and growth periodically, not only when it hurts. In this, we are usually like with the dentist, and the pain from neglecting checkups and cleaning is often similar.
- Document dependencies between databases, services and applications. We must know every corner like a spider knows its web, including those relationships.
- Validate backups and recovery, instead of assuming they work simply because the job ended in green on the console.
- Review permissions and activity if there are audit requirements.
- Adjust alerts by environment. Because, in many cases, what may be noise in development can be critical in production.
What a database monitoring tool should include

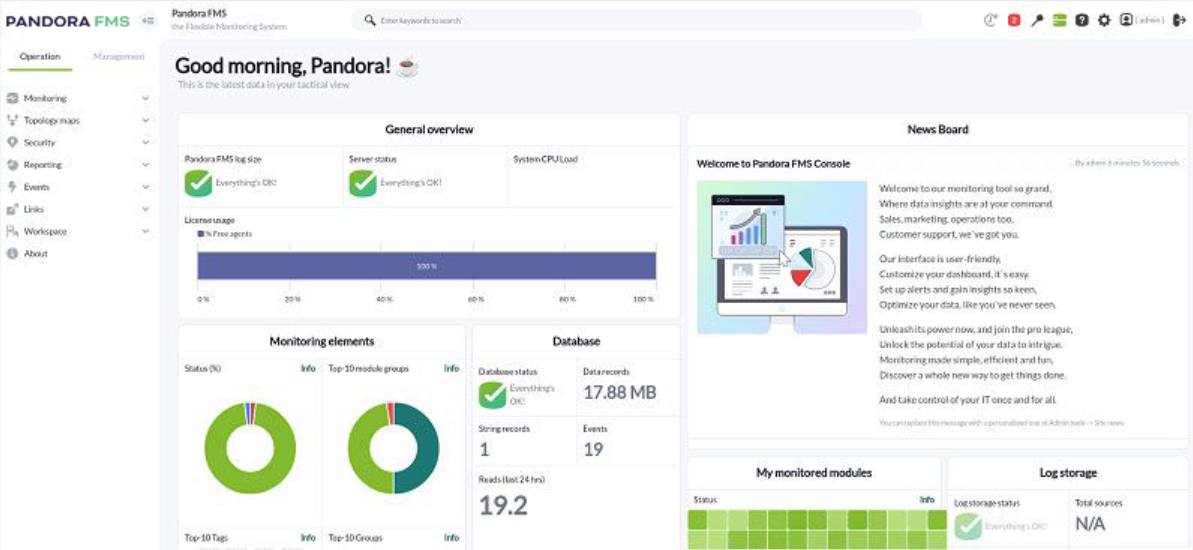
Pandora FMS, a next-generation monitoring tool
One might imagine what comes next: a kind of marketing brochure singing the praises of our tool, Pandora FMS. However, at Pandora we believe in letting you verify it yourself if you wish, not in asking anyone to take it on faith.
Besides, when choosing a tool, we should not be swayed by brands, reputation or sales talk, but by capabilities that truly fit our needs.
So, what we should look at, weighing their importance according to our specific operations, would be:
- Support for multiple engines, such as relational, NoSQL, time-series, and more.
- Achieving SQL and NoSQL monitoring coverage without having to jump between tools and further fragment our attention and response time.
- Having accessible and configurable performance metrics.
- Alerts with customizable thresholds and multiple channels.
- Dashboards adaptable to each audience, whether technical or executive.
- Historical metrics with useful retention, not just last-hour data.
- Correlation with our specific infrastructure (servers, network, cloud, etc.) so we are not trying to fit a square peg into a round hole.
- Reports for clients, audits and SLAs.
- Integration with cloud environments such as AWS, GCP or Azure, something essential today.
- The ability to detect trends and deviations.
- Operational ease for IT teams and MSPs.
Database monitoring, observability and CMDB
Databases are what keep our organization’s services running, their brain and memory. That is why monitoring becomes more valuable when we understand which services depend on each database.
That mapping is the job of the CMDB for mapping assets and dependencies, and it allows us to know, when seeing an alert, which business processes are at risk.
It is the difference between: “DB-23 has degraded”, which does not sound particularly heart-attack-inducing, and: “The French billing engine is going down in fifteen minutes unless we act”.
That certainly wakes up the manager dozing through their afternoon nap.
On top of that, observability closes the loop by connecting metrics with logs, events and user experience, so we do not just look, but understand.
In essence, monitoring answers: “Is it healthy?”, while observability answers: “Why is it behaving like this?”.
The two questions are different and incomplete without each other.
How Pandora FMS helps monitor databases
Pandora FMS monitoring every corner and reporting everything like Odin’s ravens
Now, yes, it is time to “talk about our book” because, modesty aside, Pandora FMS offers advanced database monitoring with the unified approach required to avoid losing our minds.
This enables a global view of the infrastructure and how all its pieces fit together, because databases do not live alone; they are the brain of fundamental processes, and when the beep of a flat encephalogram suddenly sounds, the consequences are felt in every corner of our technological world.
Pandora FMS provides cutting-edge database monitoring thanks to:
- Modules and plugins for the most widely used engines (MySQL, PostgreSQL, Oracle, SQL Server, MongoDB…).
- Configurable alerts by threshold, time window and criticality, with escalation and multiple channels.
- Dashboards adapted to each audience: technical teams, area managers and executives.
- Historical metrics with enough retention for trend analysis and capacity planning.
- Native correlation with servers, applications, network, cloud and other infrastructure components, not as isolated silos.
- Centralized view from the same console used to monitor the rest of IT (our metaconsole), which reduces cognitive load and tool switching for teams.
- Proven usefulness for IT, NOC, DevOps and MSP teams, especially when data must be separated by client or environment.
Pandora FMS monitors, but does not stop there: it also alerts, correlates and helps diagnose, becoming the all-seeing eye of Big Brother.
Frequently asked questions
To hammer home the important points, let us distill the most common questions together with their answers.
What is database monitoring?
The continuous supervision of availability, performance, queries, connections, storage, replication, errors and capacity of database engines.
The goal? To detect issues before they affect the service.
What metrics should a database monitor?
This is a task that each organization must carry out according to its operations and priorities, but at a minimum: availability, query latency, throughput, active vs maximum connections, CPU/memory/disk usage, locks and deadlocks, free space, replication lag, backup status and errors.
Almost nothing, especially considering that each type of engine then adds its own, as we have seen above.
What is the difference between database monitoring and database activity monitoring?
The first one (DPM) focuses on performance, availability and operations. The second one (DAM) focuses on access, users, sensitive queries, unauthorized changes and compliance.
They are complementary, not mutually exclusive.
What is database performance monitoring?
It is the discipline focused on measuring and improving database performance.
That involves observing latency, query speed, locks, resource usage, replication, storage and availability.
What tools are used to monitor databases?
On the one hand, we can choose general-purpose platforms such as Pandora FMS, which will provide full integration and a broad perspective of global monitoring.
On the other hand, we can choose engine-specific tools (pg_stat_statements, Performance Schema, Oracle Enterprise Manager…), APM solutions and observability stacks.
In the end, what matters is not the brand, but the coverage and correlation with the rest of our infrastructure.
How can slow queries be detected?
By enabling the slow query log in the engine, instrumenting traces or using performance views (pg_stat_statements, Performance Schema, DMVs).
A good monitoring tool extracts them, aggregates them and displays them in comparable charts over time.
Why is it important to monitor replication?
Because a delayed or down replica weakens high availability. Likewise, promoting a primary with unsynchronized data due to replication issues can lead to information loss.
How does monitoring help reduce MTTR?
By detecting issues earlier and providing context that speeds up diagnosis. This way, reducing MTTR stops being wishful thinking and becomes the natural consequence of operating with visibility.
Conclusion
As in other aspects of the discipline, database monitoring is much more than checking whether the service responds.
It must also measure performance, capacity, replication, errors, backups, relevant activity and dependencies with applications and infrastructure.
In critical environments, a proper monitoring strategy makes it possible to anticipate incidents, reduce resolution times and operate with real control.
As on the bridge of the Enterprise, it is not about looking at a screen, but about having knowledge of every key aspect, someone who understands it and the operational discipline to act before the ship starts experiencing jolts.
Habla con el equipo de ventas, pide presupuesto,
o resuelve tus dudas sobre nuestras licencias