GPU monitoring for AI, HPC and hybrid infrastructures
Monitor NVIDIA GPUs with Pandora FMS and integrate utilization, memory, temperature, power consumption and status data into the same platform where you already monitor servers, networks, storage, services and logs.
Customers who trust us

GPU MONITORING SOFTWARE
Your GPUs cannot be a blind spot in your IT infrastructure
AI, HPC, inference and training infrastructures rely on GPUs that concentrate cost, performance and operational risk. A saturated, overheated, underused GPU or one with undetected errors can degrade services, slow down critical processes or cause production failures.
Pandora FMS integrates GPU metrics into your existing IT operations, alongside servers, networks, storage, services and logs. No separate platforms.
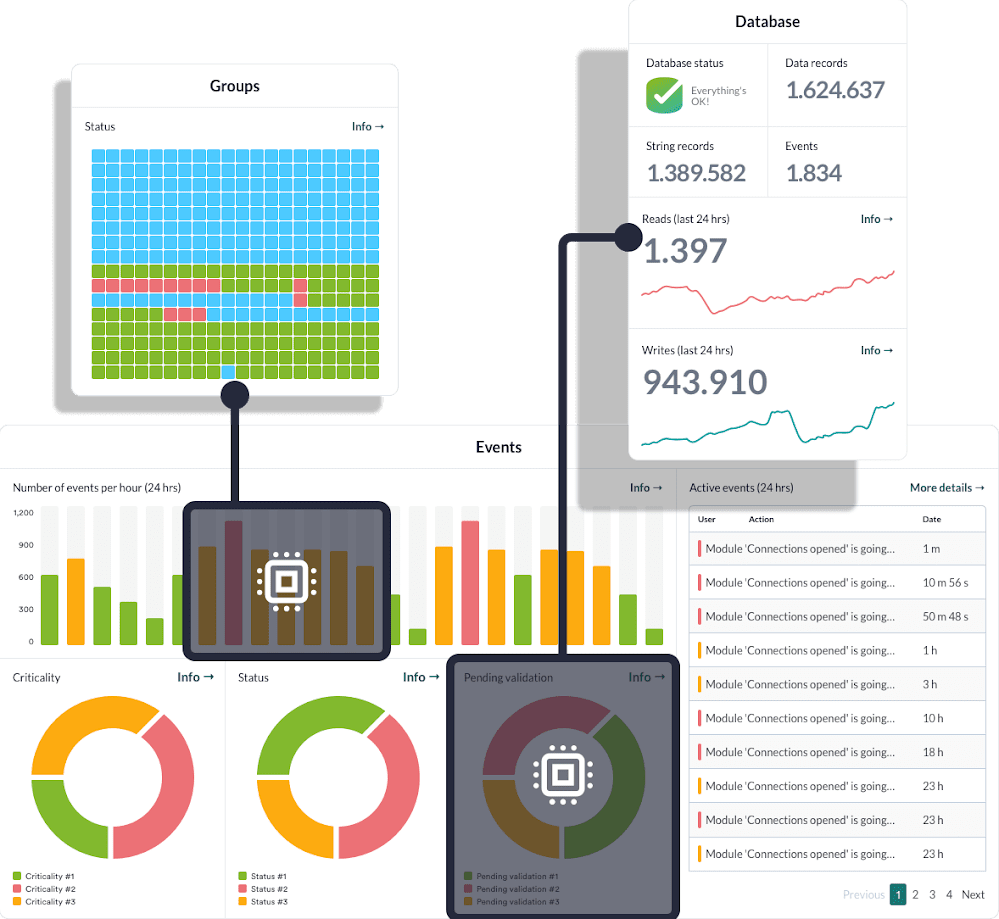
Pandora FMS Console · GPU status
HOW IT WORKS
How GPU monitoring works in Pandora FMS
The plugin runs as a local agent on the host with the NVIDIA GPU, uses nvidia-smi as its data source and generates modules that Pandora FMS incorporates into its operations.
Host with NVIDIA GPU
On-premise, hybrid or cloud
nvidia-smi
Local data source
Pandora FMS local plugin
Agent that generates XML modules
Dashboards, alerts and reports
Integrated with the rest of your infrastructure
USE CASES
From metric to incident: GPU monitoring in real operations
Knowing that a GPU is at 95% is not enough. Operational context is what matters.
Sustained saturation
A GPU running at 95% for hours, with high memory usage and errors in the inference service, is not a normal spike. It is an incident that requires intervention. Historical data makes it possible to distinguish one from the other.
Thermal risk
Sustained high temperature combined with fan anomalies can anticipate physical degradation. Detecting it before failure enables preventive intervention instead of reacting to an outage.
Underutilization
An expensive GPU with low usage for weeks may indicate poor workload allocation. Historical data provides objective evidence to justify or postpone hardware decisions.
Capacity planning
Historical utilization and memory data helps identify demand growth, anticipate saturation and plan expansions based on data instead of estimates.
MONITORED METRICS
What you can monitor with Pandora FMS
Pandora FMS collects key NVIDIA GPU metrics to detect saturation, memory pressure, thermal risk, errors and capacity issues.
- GPU utilization (%)
- GPU operational status
- Used, free and total memory (MiB)
- Memory usage percentage
- Temperature (°C)
- Instant power consumption and power limit (W)
- Fan speed where applicable
- ECC errors where applicable
- GPU model and driver version
- Supported CUDA version
nvidia-smi. The technical documentation for the plugin will be available in Marketplace.ALERTS
Alerts to detect saturation, temperature and critical errors
Pandora FMS lets you generate alerts on GPU metrics to detect memory pressure, high temperatures, ECC errors or loss of availability. Thresholds can be adjusted from the console according to the GPU model and the operational policy.
Predefined thresholds serve as a reference and can be modified from the Pandora FMS console.
COMPATIBILITY
Compatibility and requirements
The plugin is designed for on-premise, hybrid and cloud environments with NVIDIA GPUs exposed to the operating system.
- NVIDIA GPUs
- Linux (amd64 / arm64) — validated
- Windows (amd64) — in final validation
- On-premise and hybrid environments
- AWS, Azure and Google Cloud if the GPU is exposed to the OS
- Requires the NVIDIA driver to be installed and
nvidia-smiavailable on the host.
Current limitations
- Does not support AMD or Intel GPUs
- Does not monitor AI models, prompts or MLOps metrics
- Does not include drift detection or full AI observability
- For clusters with many GPUs per node, it may be necessary to complement it with DCGM or other aggregation solutions
Want to validate whether your NVIDIA GPUs are compatible with Pandora FMS?
Contact us →Why choose Pandora FMS for GPU monitoring?
Pandora FMS is not an isolated GPU tool. It is the platform where those metrics gain real operational value.
One console for infrastructure and GPUs
GPU metrics are integrated into the same console where you monitor servers, networks, storage, services and logs. No separate platforms.
On-premise, hybrid and cloud
Monitor GPUs in your own datacenters, hybrid environments and cloud instances with NVIDIA GPUs exposed to the OS, without depending on a specific provider.
No isolated dashboards
GPU metrics become part of existing operations: history, events, alerts, reports and dashboards within the same platform.
Alerts, history and reports
Every GPU metric can generate alerts, be stored historically and appear in reports. The same operating model used for servers and networks can also be applied to GPUs.
RELATED RESOURCES
Expand your knowledge about GPU monitoring

GPU monitoring: GPU monitoring for AI and hybrid environments
What metrics to monitor, the difference between nvidia-smi and monitoring platforms, and how to integrate GPU monitoring into an AI infrastructure monitoring strategy.
Read the article →
Server and infrastructure monitoring
Pandora FMS lets you monitor physical, virtual and cloud servers from a single platform. GPUs are integrated into this global context.
View solution →
AI applied to IT management and smart monitoring
Anomaly detection, prediction and automation across your IT infrastructure. GPU monitoring is part of a broader AI infrastructure monitoring strategy.
View solution →Frequently asked questions about GPU monitoring
Concept
What is GPU monitoring?
GPU monitoring is the continuous supervision of GPU status, utilization, memory, temperature, power consumption and errors in professional environments. It applies to AI, HPC, inference and model training infrastructures. It should not be confused with gaming, overclocking or graphics tuning tools.
Which GPUs does the Pandora FMS plugin support?
The plugin supports NVIDIA GPUs. It uses nvidia-smi as its data source and requires the NVIDIA driver to be installed on the host. It does not support AMD or Intel in the current version.
Compatibility
Does it work in on-premise and cloud environments?
Yes. The plugin runs as a local agent on the host with the GPU. Linux is validated (amd64 / arm64). Windows is in final validation. It can be used on on-premise servers, hybrid environments and cloud instances with GPUs exposed to the operating system. It requires no remote access or additional network configuration.
What metrics does it monitor?
The plugin covers GPU utilization and status, used and free memory, temperature, power consumption and power limit, ECC errors where applicable, and technical data such as GPU model, driver version and CUDA version. The technical documentation for the plugin will be available in Marketplace.
Differences
What is the difference between nvidia-smi and Pandora FMS for GPU monitoring?
nvidia-smi is a command-line utility useful for one-off queries. Pandora FMS uses nvidia-smi as a data source and integrates those metrics into a platform with history, alerts, dashboards, reports and correlation with the rest of the infrastructure.
Does the plugin monitor AI models or MLOps metrics?
No. The plugin monitors GPU infrastructure: hardware, performance, memory, temperature and power consumption. It does not monitor AI models, prompts, drift detection or MLOps metrics.
Start monitoring your NVIDIA GPUs with Pandora FMS
Integrate NVIDIA GPU monitoring into your IT operations and turn isolated metrics into alerts, historical data, dashboards and operational reports.