Oracle GoldenGate Monitoring: Learn how to monitor this
What is Oracle GoldenGate?
Oracle GoldenGate allows the exchange and manipulation of data in a company, allowing decisions to be made in real time. It works with multiple platforms, while moving transactions that are committed to the integrity of the transaction, allowing a minimum overload in its infrastructure. It has a modular architecture, providing flexibility, while being able to extract and replicate selected data records, changes to DDL which stands for “Data Definition Language” and transactional changes.
Regarding DDL support, we know that certain capture or delivery configurations and topologies vary according to the type of database. From Pandora FMS, we recommend our readers to consult the documentation related to the installation and configuration of Oracle GoldenGate, for their respective databases, in order to obtain detailed information regarding the supported configurations and, also, about those features. It is important to know all this, before analysing all about GoldenGate monitoring.


GoldenGate supports several requirements, such as:
- Initial load and database migration
- High availability and business continuity
- Data storage and decision support
- Data integration
For those who want to obtain complete information about the processing methodology, feature, configuration requirements and compatible topologies, they should also check the Oracle GoldenGate documentation for their respective databases.
Along with this architecture and before getting into Golden Gate monitoring, let’s say that it can be configured for several purposes:
○ For extraction and replication of transactional operations of DML which stands for data manipulation language and changes in the data definition language or DDL (for compatible databases), in order to maintain an adequate data coherence of origin and destination.
- For a static extraction of data records from a database and the loading of those records into a different database.
- For the extraction of a database and the replication to a file outside of that database.
Do you want to know more about application monitoring?
Pandora FMS Enterprise is capable of monitoring the most popular applications and databases. Click here and find out…
Oracle GoldenGate components
The components of GoldenGate are the following ones: Data pump, Extract, Control points, Extract files or Trails, Replicat, Collector and Manager.
The extraction process stands out due to the Oracle GoldenGate capture mechanism. In addition to this, the extract is executed in a source system or in a descending database or, if preferred, in both of them.
We can configure “Extract” in different ways:
- By changing the synchronization: It turns out that Extract captures the DML and DDL operations , once the initial synchronization has been carried out.
- With initial checks: for initial data loads, Extract captures a current and static set of data, straight from its source objects.
Method 1.
-
- To extract captures from a data source, we can make Source Tables (when the execution is an initial load) and from the recovery records of the database or the transaction records (just like with the records of “Redo” of Oracle Data Base or, also of the audit records of SQL / MX). However, the actual method of capturing the records varies according to the type of database concerned in each case.
-
- For example, Oracle GoldenGate for Oracle offers an integrated capture mode, in which Extract enters to interact, directly, with a database base registration server that, in turn, proceeds to extract the flow of Oracle transactions. From Pandora FMS, we recommend readers who wish to obtain more detailed information about the integrated capture, to click
- .
Method 2. Another method is found in a third-party capture module, which provides us with a communication layer that passes data and metadata from an external API to the Extraction API. It turns out that the provider of the database, provides us with the components that, in turn, extract the data operations and proceeds to pass them to “Extract”.
Data Pumps
What is a Data Pump? It is an extraction group that is within the Oracle GoldenGate source configuration. When a Data Pump is not used, Extract should proceed to send the data operations that have been captured to a remote path in the target. However, in a typical configuration of a Data Pump, the so-called Primary Extraction Group proceeds to write in a record located in the source system. The Data Pump proceeds to read this path and sends data operations, via the network to a remote path on the target, while the Pump adds storage flexibility and of course, it also serves to isolate the (primary) extraction process from the TCP / IP activity.
In general terms, a Data Pump is capable of carrying out data filtering, conversion and mapping, but it can also be configured in “step mode”, this way the data is transferred without any manipulation. This way of passing, also known as “Pass-through mode” increases the performance of the Pump, since that entire feature that looks for object definitions is omitted.
For those readers who want to expand the information we have provided about Oracle GoldenGate, from Pandora FMS we recommend clicking on this link .
But how do we carry out Oracle GoldenGate Monitoring?
By using the information commands in GGSCI:
To see and analyse the processing information, use GGSCI. The following are the commands to see the process information:
- The command
INFO {EXTRACT│REPLICAT} group [DETAIL]shows us: execute status, control points, approximate delay and environmental information. INFO MANAGERshows us: execute status and port numberINFO ALshows usINFOoutput for all Oracle GoldenGate processes in the systemSTATS {EXTRACT │ REPLICAT} groupshows us the statistics on the processing volume and the number of operations carried outSTATUS {EXTRACT │ REPLICAT} groupshows us the execution status, which is, start, execution, stop and abendedSTATUS MANAGERshows us Execute statusLAG {EXTRACT │ REPLICAT} groupshows us the latency between the last record processed and the time stamp in the data sourceINFO {EXTTRAIL │ RMTTRAIL} trailshows us the name of the associated process, the position of the last processed data and the maximum file size
Important note: there are many other commands for Oracle GoldenGate monitoring. We recommend readers to check this link.
Oracle GoldenGate monitoring through the analysis of an extract recovery:
Limited Recovery is exclusive for Oracle. If Extract closes in an unusual way, when a long-term transaction is open, it may seem like it takes a long time to recover, when starting again.
To recover its processing status, Extract must perform a search through the online (and archived) logs, in order to find the first log for that long-running transaction. The further back in time for the start of the TRANSACTIONS, the more recovery time will be needed, and Extract may seem frozen. To avoid this and confirm that Extract is being recovered properly, we must use the SEND EXTRACT command with the STATUS option.
Thus, one of the following status annotations will appear, while we will be able to continue with the process as Extract changes its log reading position, during the recovery itself:
In recovery [1] :it indicates that the extract is being retrieved at its checkpoint, in the transaction log.In recovery [1] :it indicates that the extract is recovering from its control point, until the end of the road.Recovery complete :it means that the recovery has finished, while normal processing will be resumed.
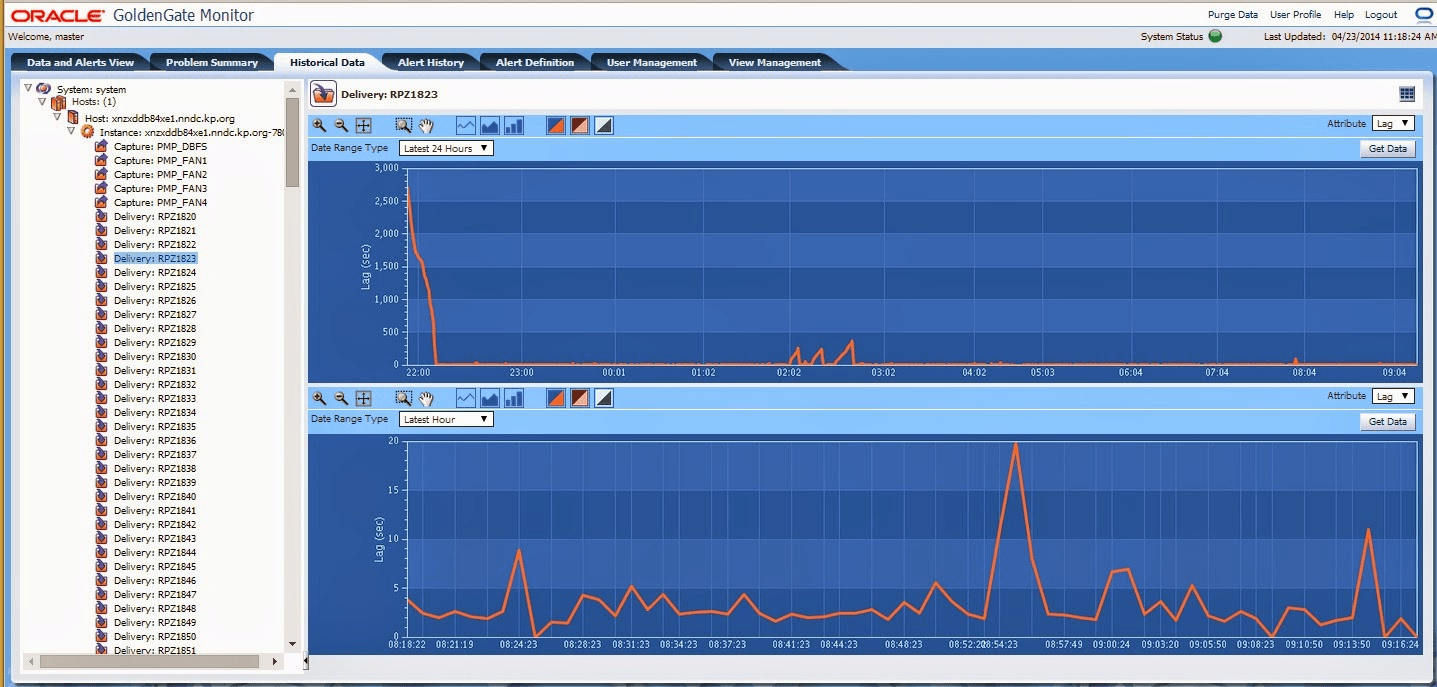
Monitoring:
The statistics of Lag show us the Oracle GoldenGate processes, follow the rhythms of the amount of data generated by commercial applications. Through this information, we can diagnose suspicious inconveniences and adjust the performance of those processes. In order to minimize the latency between the source and destination databases.
Regarding Lag for Extract, the delay is the difference (in seconds) between the time at which a log was processed by Extract (according to the system clock) and the time stamp of that log in the data source . For Replicat, the delay is the difference (also in seconds) between the time when Replicat processed the last log (according to the system clock) and the time stamp of the log on the way. Now, to observe the delay statistics, we must use the LAG or SEND command in GGSCI.
It is very important to keep in mind that the INFO command returns delay statistics. However, in this case, the statistics are taken from the last log that was controlled and not from the current log, which we are processing. Also, this command is less accurate than LAG and INFO.
For Oracle GoldenGate monitoring, you need to control how Lag is being reported:
In order to specify the interval in which the Administrator is verifying the delay of Extract and Replicat, we must use the parameter LAGREPORTMINUTES or LAGREPORTHOURS. On the other hand, in order to establish a critical lag threshold and to force a warning message in the error log, when the threshold is reached, we must use the parameter LAGCRITICALSECONDS; LAGCRITICALMINUTES or, if preferred, LAGCRITICALHOURS . Let’s clarify, that these parameters affect the Extract and Replicat processes.
Now, to determine a threshold of delay, We must use the parameters LAGINFOSECONDS , LAFINFOMINUTES or, , LAGINFOHPURS . But, in case the delay exceeds the value that we have specified, Oracle GoldenGate reports the delay information in the error log. In case the delay exceeds the value specified with the parameter LAGCRITICAL, the Administrator will inform us that the delay is critical. If the delay is not critical, we are informed by a message. A value of zero (0) causes a message to be forced to the specified frequency, with the parameters LAGREPORTMINUTES or LAGREPORTHOURS .
We have talked about the most important tools for Golden Gate monitoring, but if you want to check some other methods such as Volume Supervision Processing, the use of the Error Registry, the use of the Process Report, the use of the File Disposal, Maintenance of Discard Files, Use of System logs, Reconciliation of Time Differences, then click here to go to the Official Oracle page . In addition to this, in Pandora FMS you will be able to find valuable information on server monitoring.
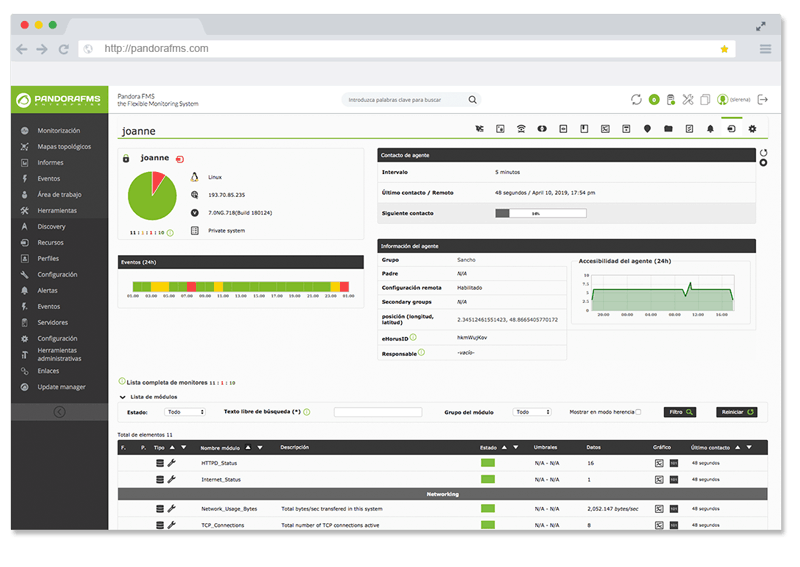
About Pandora FMS
Pandora FMS is a flexible monitoring system, capable of monitoring devices, infrastructures, applications, services and business processes.
Of course, one of the things that Pandora FMS can control is the hard disks of your computers.
Would you like to know more about what Pandora FMS can offer you? Discover it by entering here: https://pandorafms.com
Or if you have to monitor more than 100 devices you can also enjoy a 30 days FREE DEMO of Pandora FMS Enterprise. Get it here.
Also, remember that if your monitoring needs are more limited you have at your disposal the OpenSource version of Pandora FMS. Find more information here: https://pandorafms.org
Do not hesitate to send us your queries. The Pandora FMS team will be happy to assist you!
Rodrigo Giraldo, freelance technical writer. Lawyer and astrobiology student, he is passionate about computers, reading and scientific research.