When it comes to choosing the ideal monitoring tool for any installation, one may ponder upon many doubts. Nagios was for years a benchmark among network, system and application monitoring systems for many companies; Zabbix has been taking away market share for some time and Pandora FMS, with its own open source software, has made a name for itself.
Therefore, extending the information that we provide in the article about best network monitoring tools, we will face these three monitoring giants regarding all the important aspects that a software with these features must comply with.
The 3 tools to compare
Before delving into how good each of the monitoring software is, let’s take a brief look at what they are and how they achieved their leading positions.
What is Nagios?
Nagios is considered by some people (mainly by those who have been in the IT world for some time) as the “de facto standard” in open source monitoring. Mainly because they are the first ones who did it right. Before Nagios there were some options, but they were unprofessional or excellent tools that only applied to a specific task.
The first Nagios version is from the last century: 1999. 17 years have gone by and technology has evolved, with it, Nagios has grown through an ecosystem of “add-ons” or third-party plugins that try to complement missing features.
What is Zabbix?
Zabbix emerged a little later, in 2001. It is a complete development, not a Nagios fork, and its main feature is that it has a more holistic monitoring overview that covers performance, not just states (one of Nagios’ great shortcomings). In addition, it has a WEB management system that allows it to be managed centrally, without cumbersome configuration files, as it happens with Nagios.
What is Pandora FMS?
Pandora FMS was born in 2004 and, like Zabbix, it is a development that starts from scratch. Its main feature is that, more than an IT monitoring system, it is a monitoring framework that allows infrastructure monitoring (networks and servers), performance and Application Monitoring (APM) or Business Affair Monitoring (BAM).
Like other modern systems, it has a centralized management system and has its core in a relational SQL database. Like Nagios, it has an “Enterprise” version, but its Open Source version is more than enough to implement any monitoring needs. In this comparison we talk exclusively about its Open Source version features, so that the three software programs compete on equal terms.
Neither Nagios nor Pandora FMS are “limited” versions, like those of other vendors, but the free version only lacks some features aimed at large environments.
Do you want to use Pandora FMS’s Open version for free in any environment?
It doesn’t matter if you want to monitor 1 or 100,000 devices, Pandora FMS free version suits everything.
Use it in:
Visual result of the comparison
For the most enquiring ones we created a graph with the summary of this comparison. Three softwares compared regarding their 12 main aspects. If you want more details, read on.
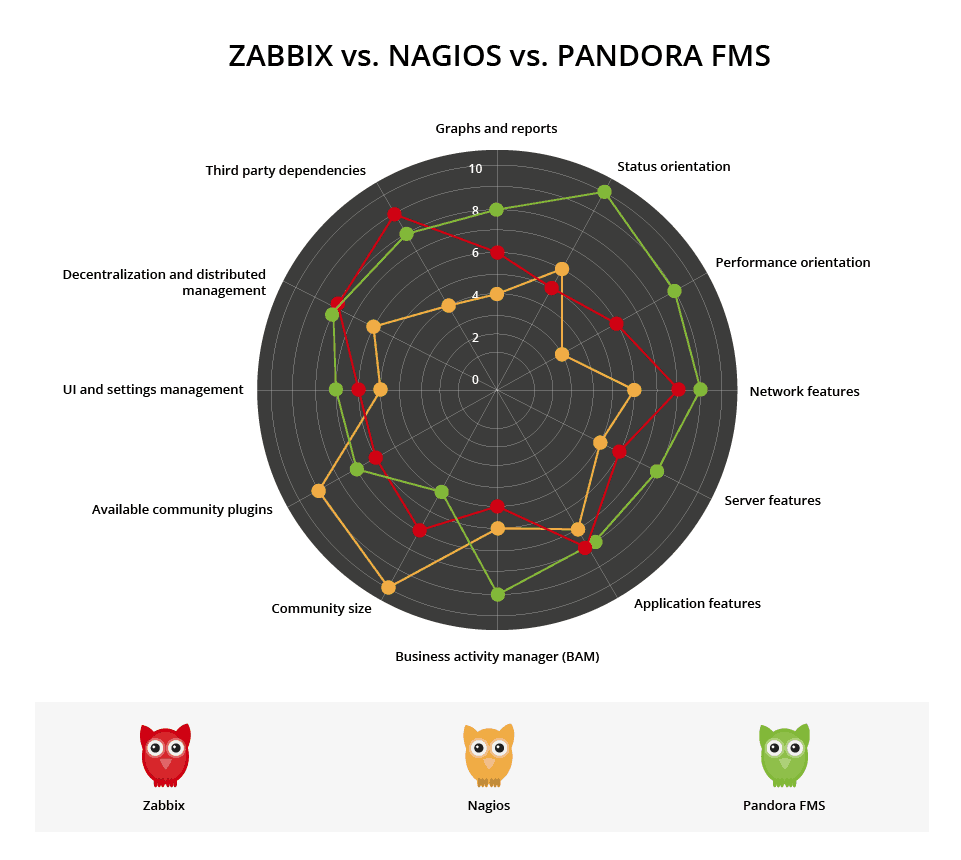
Monitoring system comparison: Zabbix, Nagios and Pandora FMS. Discover the best and worst of each one of them.
Comparison Zabbix, Nagios and Pandora FMS
In this analysis, compare the three tools by analyzing their approach to the following points:
- User management and configuration
- Plugins and out of the box monitoring
- User community
- Report and visual dashboard generation
- Visual charts and reports
- Agents
- Scalability
- Network environments
1. User management and configuration
This is where the most significant differences between these systems are found. No one doubts that Zabbix has a management web interface and that this is centralized through the database, just like Pandora FMS does. However, Nagios stays attached to the 90s and it is still managed through a thousand places through a complex plethora of interlaced text files, scripts and manual processes. A system that, in addition, makes it necessary to use third-party tools for its deployment, such as Chef or Puppet.
This had the advantage that Nagios, by not using a database to store information, needs fewer resources. Nowadays the bottleneck is not about hardware, it is the ability to efficiently manage configuration, and with Nagios it is the opposite. The management difficulty means that more than having Nagios installed, you have a team of people who manage Nagios, where the software, without the equipment, cannot be exploited.
Nagios (and some forks, like Naemon) still use CGI’s written in C. This technology was invented in the 1980s. It’s not that technology is bad (it’s actually fast and very solid), but it makes it hard to extend or improve it. It implies that to make a simple change you have to patch the monolithic architecture code and compile manually, and remember that the Nagios ecosystem is based on hundreds of patches for different versions of each Fork. It’s literally a bazaar. Remember that the Nagios configuration is based on text files: every time you have to make a change, you have to restart.
If Nagios was the paradigm of the bazaar, Zabbix and Pandora FMS are the opposite: the cathedral. They are solid projects, with a complex, modular architecture that has grown over time with a design led by the same team of architects.
Neither Zabbix nor Pandora FMS have any forks.
Both Nagios and Pandora FMS have “Enterprise” versions. Not Zabbix. The Zabbix model appears to be based on support and implementation services and training.
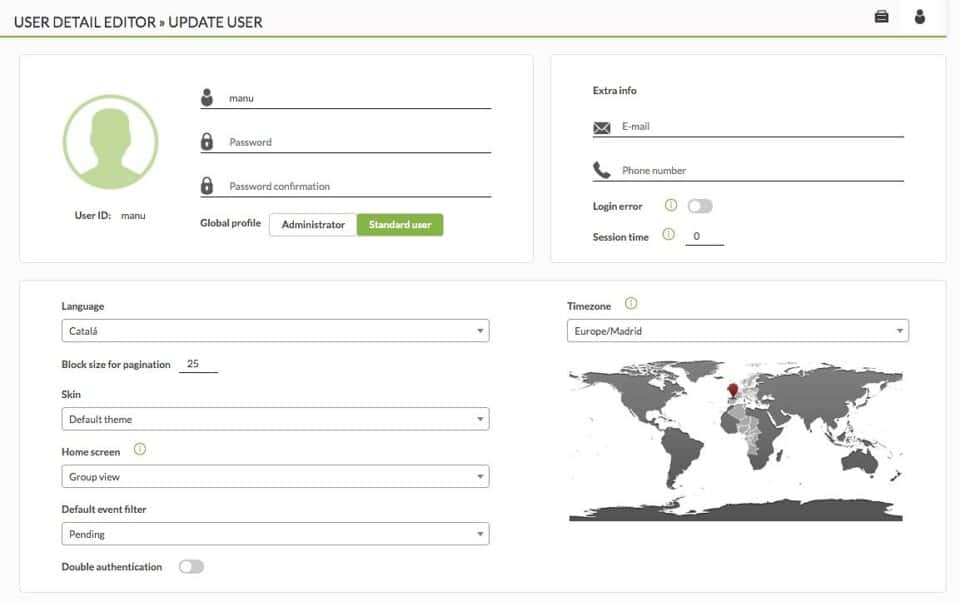
While Pandora FMS allows integration with LDAP and has a multi-language interface, with differentiated time zones and an internal audit and permissions system, Zabbix and Nagios do not have the same functions.
2. Plugins and out-of-the-box monitoring
Zabbix and Nagios need the installation of many plugins to be efficient and offer a full set of features.
Zabbix, in addition to needing them, does not have an “official” plugin library for the community, although it does have a list of OIDS for SNMP queries. In addition, it does not offer the possibility of working with Enterprise tools such as Oracle, Exchange, Active Directory, and others in the core.
Nagios has a gigantic library very poorly maintained as everything is 100% open and there is no company behind it that maintains or takes care of it.
Pandora FMS has a smaller library than that of Nagios (less than 500 plugins), but it is maintained by a company and, although some are Enterprise (paid), it is very focused on “real” everyday products and not exclusively on free technology. Pandora FMS, also in its open version, comes with a collection of ready-to-use plugins and modules that are suitable for simple things, both with agents and remote checks. It also incorporates an SNMP browser and several SNMP and WMI wizards to remotely monitor network equipment and servers.
If you are interested in learning more about remote monitoring you may take a look at this Workshop where we talked about basic remote monitoring:
Zabbix has a powerful template and trigger definition system based on regular expressions. It is very powerful, but also complex to use, only suitable for people capable of understanding regular expressions. In Nagios there is nothing like it – in its Open version – and in Pandora FMS it has been replaced by screens and wizards in its WEB interface, more user-friendly.
To monitor with Nagios you have to get used to dealing with hundreds of custom scripts, which when done by someone else become almost like black magic. It is very complicated to manage among different people; in the end Nagios ends up being a mix between software and custom development. In fact, in order to use it well you need not only Nagios, but about four and five community “addons” (check_mk, HighCharts, OMD, NRPE, NSCA, ndoutils, thruk, nagvis), plus other complete complex projects (such as puppets) to manage configurations and of course thousands of its own script lines.
As for Zabbix and Pandora FMS they have an autonomous approach.
Today, both Zabbix, Nagios, and Pandora FMS have a plugin and extension library. The most complete is that of Nagios, while Zabbix and Pandora FMS follow it increasingly close.
3. User community
The largest community is that of Nagios, for the simple reason that it was the first to arrive. In fact, Nagios has an almost infinite number of forks: OpsView, Op5, Centreon, Icinga, Naemon, Shinken. This implies that the Nagios ecosystem is chaotic when it comes to implementing plugins or tools implemented from one to the other. Each branch has a different philosophy and over time makes it totally incompatible with the other branches and with the parent project.
Zabbix has a growing community of users, as it has a lot of certified training, while Pandora FMS community is strong especially in Spanish-speaking countries.
4. Report and visual dashboard generation
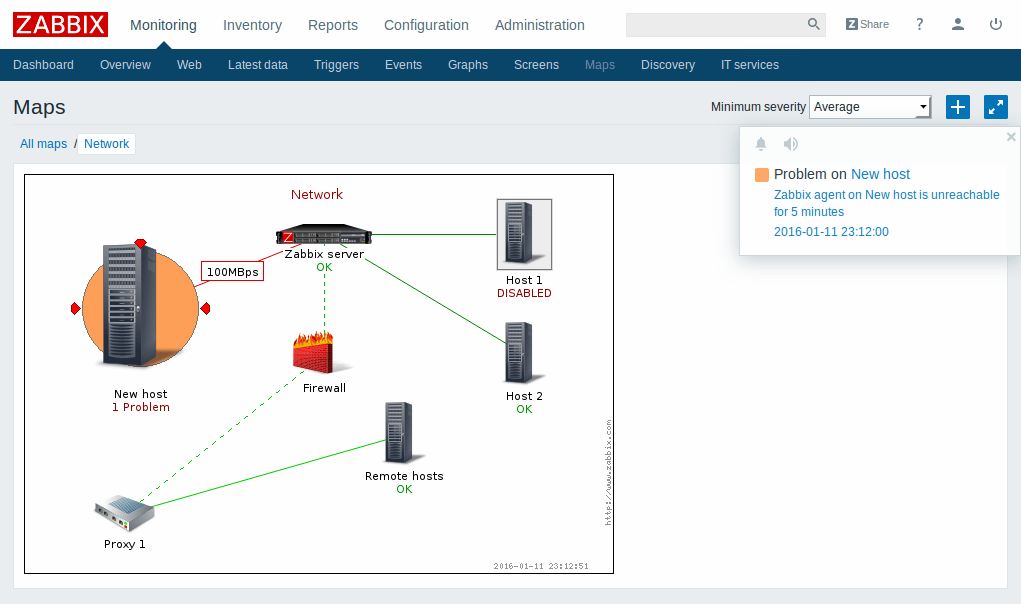
All three tools have the concept of Customizable User Screen (a visual console). In addition, Zabbix and Pandora FMS have operation dashboards.
In Nagios, as we already explained, it is not easy and you have to use a plugin that has its own “entity” (nagvis), but in Zabbix and in Pandora FMS it comes as standard.
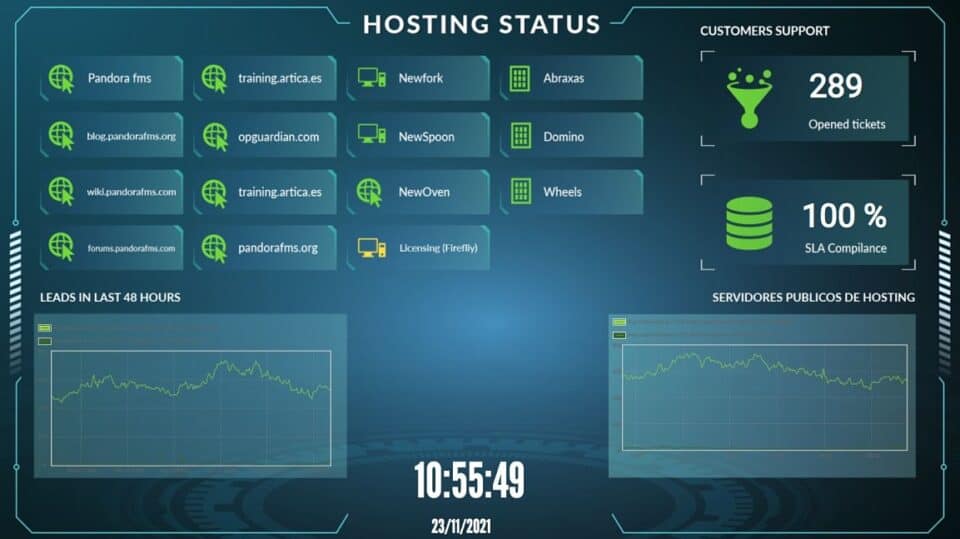
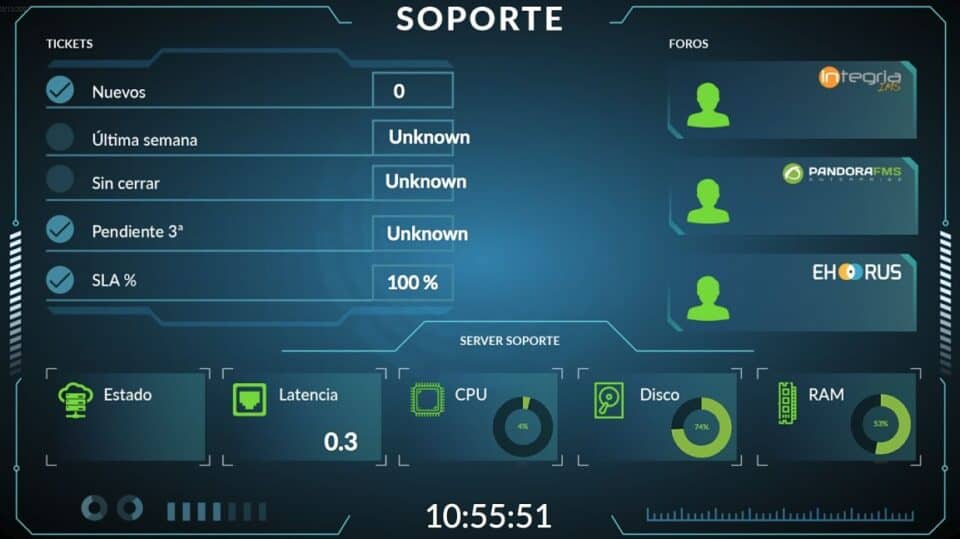
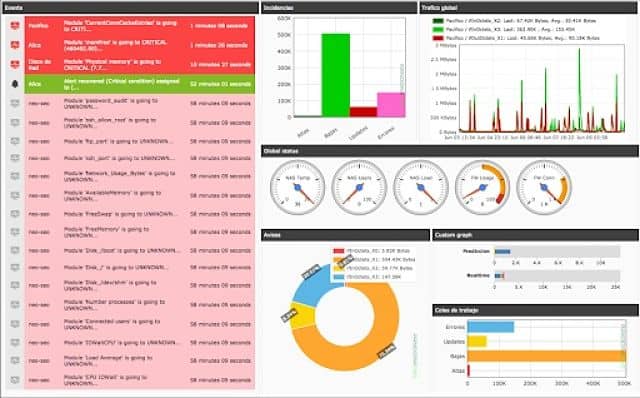
However, visually with Pandora FMS you can achieve the best results, as you can see in the following screenshots:
Pandora FMS visual dashboards
Zabbix visual dashboards
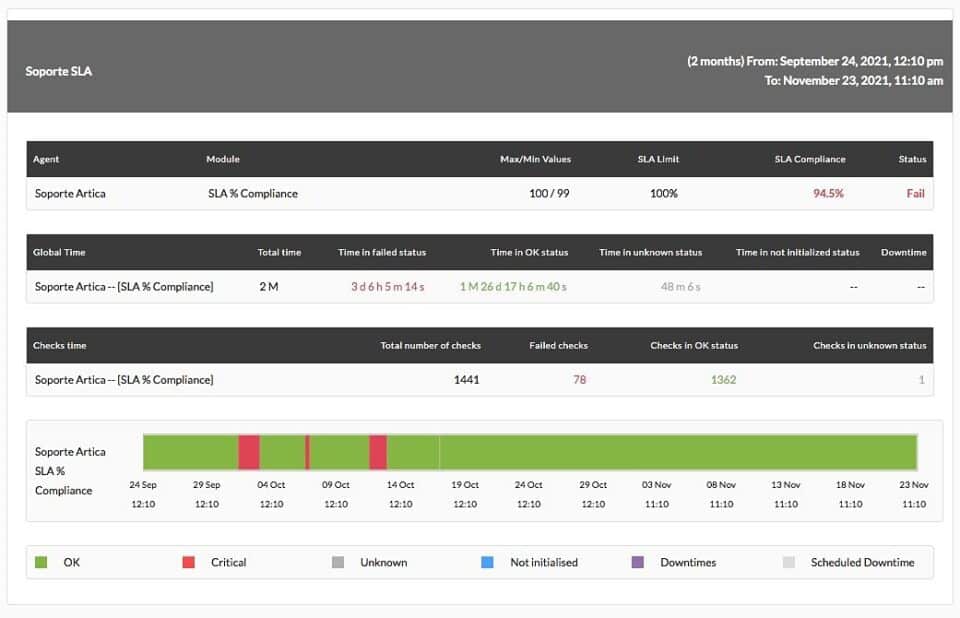
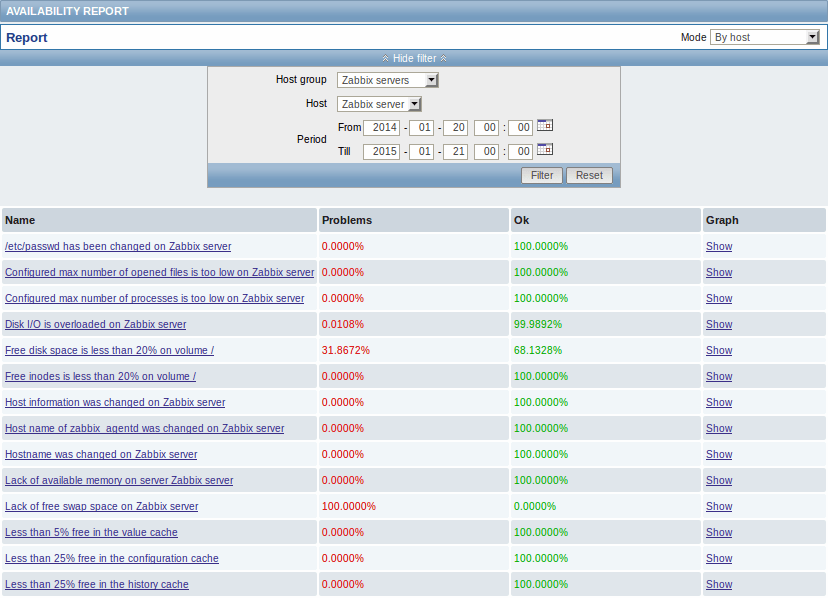
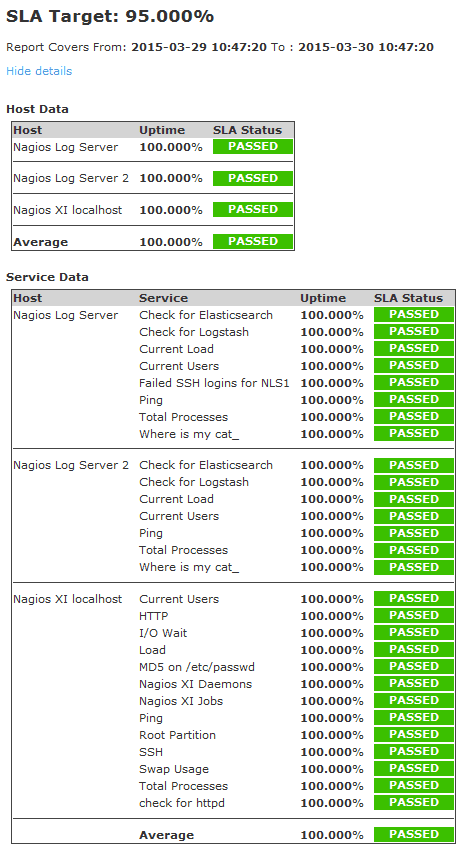
The reports that Nagios can generate are very poor. Zabbix improves them a little, but the concept of reporting understood as “something to deliver to a customer or a boss” is something that only Pandora FMS has. In fact, even in its “free” version, Pandora FMS has a very powerful report generator that allows you to customize them much more than those of Nagios or Zabbix, with weekly, monthly and daily SLA calculations, custom graphs, summaries, lists, averages, availability times, groupings, list of events, and a long etc.
Reports in Pandora FMS
Reports in Zabbix
Reports in Nagios
5. Visual charts and reports
Nagios has historically needed third-party plugins to perform this task. In recent forks, they included it as standard, but they are still communications-oriented graphics, with few customization possibilities. Nagios and graphs have always had a “complicated” relationship, since their origin was to manage events, not data.
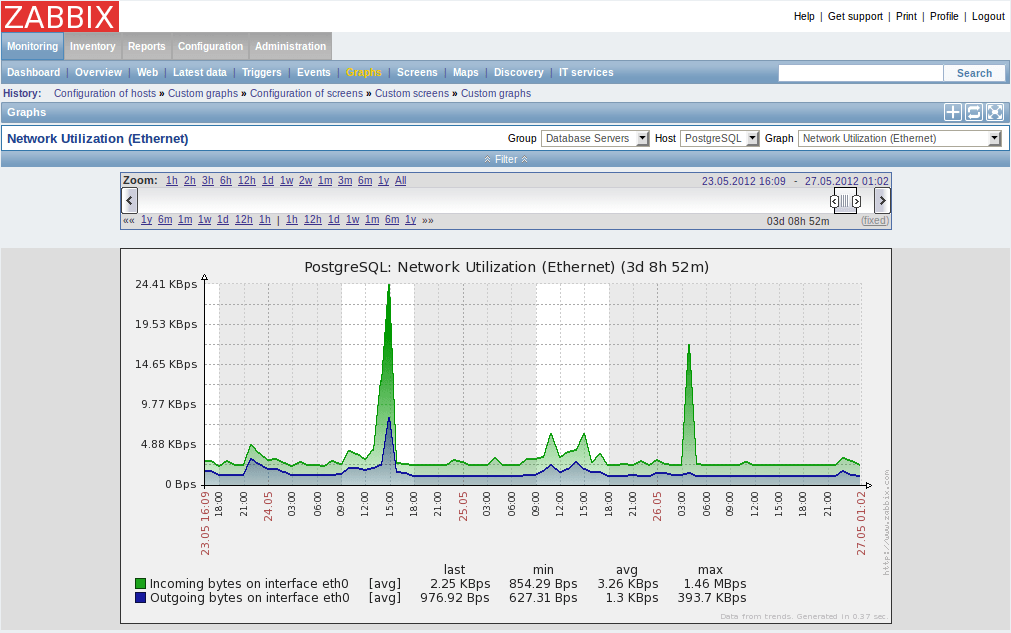
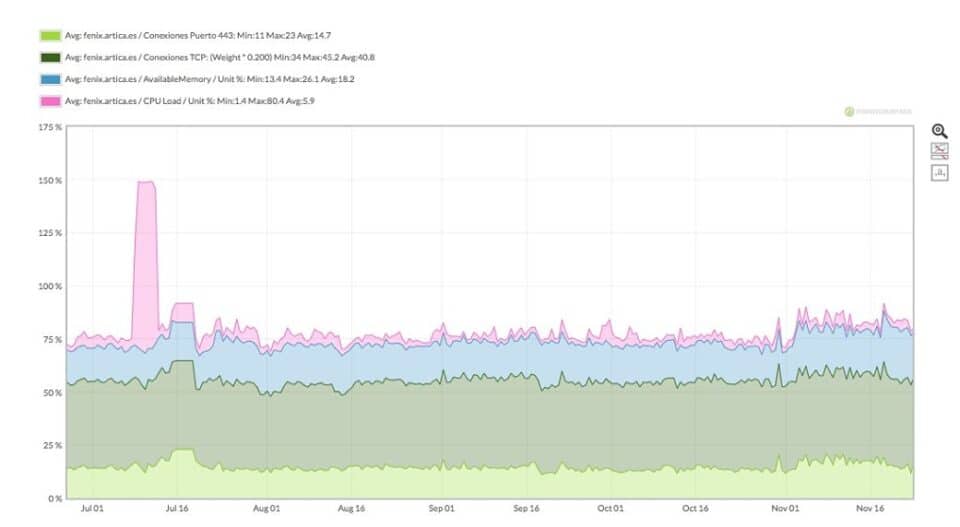
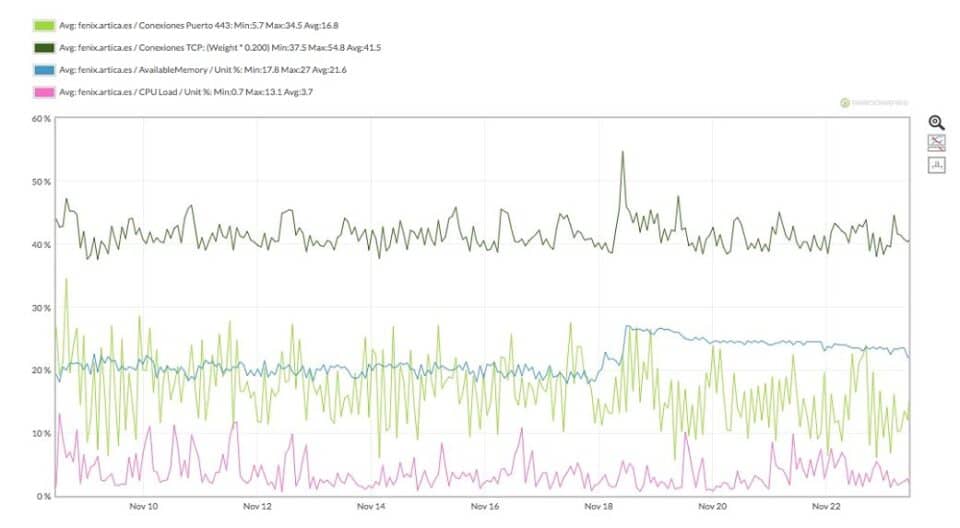
Zabbix has its own graphs, but Pandora FMS graphs are generated in real time from the database, which allows you to use data to generate combined graphs, change scales and customize colors, sizes and legends, so that they are an active part of the information, not only a technical graph but part of a report.

Would you like to learn more about Pandora FMS Enterprise?
Visit our Home and discover the most flexible monitoring software on the market, capable of monitoring devices, servers, applications, services and business processes
Graphs in Nagios XI (Enterprise)
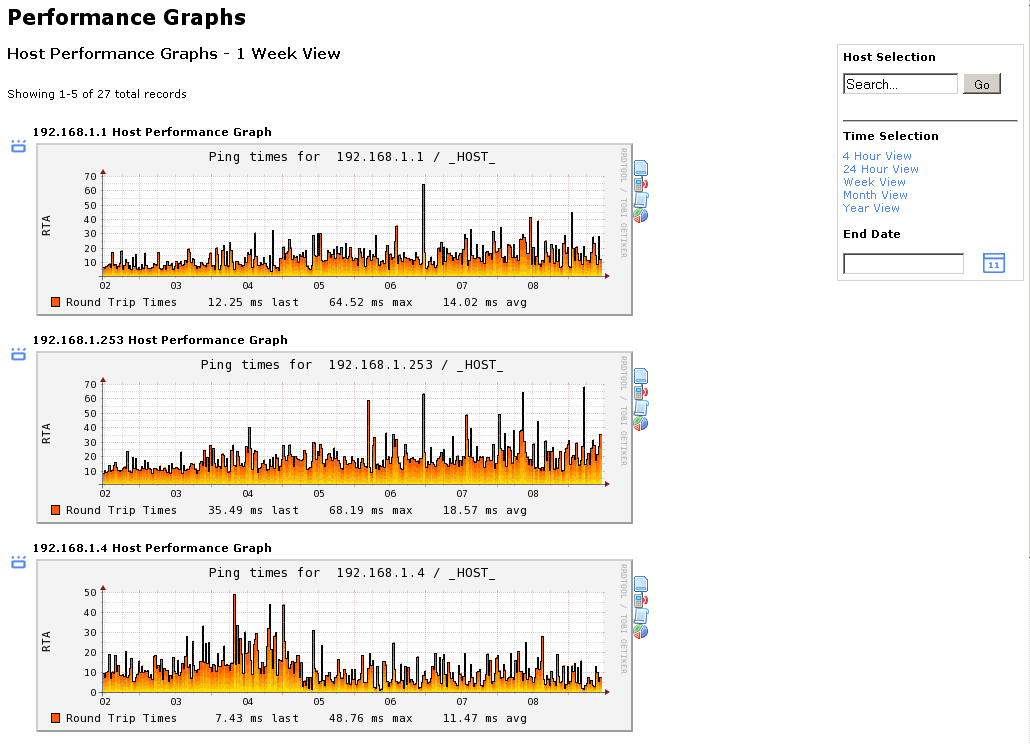
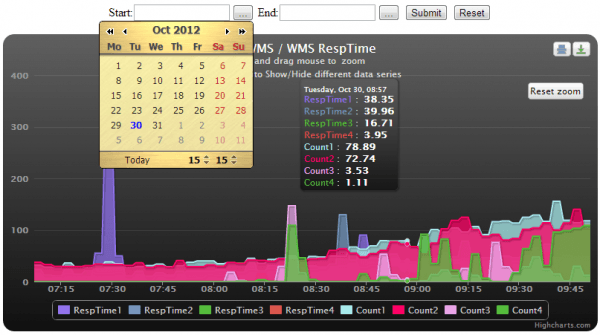
Following the recommendation of Willem D’Haese we added some Nagios screens using its integration with Highcharts.
Graphs in Zabbix
Graphs in Pandora FMS OpenSource version
6. Agents
Although some people consider agent-based monitoring technology “outdated,” the truth is that powerful vendors (CA, HP, IBM) sometimes mask their remote technologies by making them look 100% agentless, when what they do is copy an agent, run it, and then delete it.
What is clear is that many monitoring tasks still require an agent on the machine.
Nagios has several (NRPE, NCPA, NRDP and others) that, like everything else in Nagios, is quite “do it yourself” and many times they are not well maintained and have become outdated. The fact that there are different agents for the same platform is consistent with Nagios philosophy.
Zabbix also has agents, as does Pandora FMS.If we compare technically in detail the quantity and quality of Zabbix and Pandora FMS agent features, Pandora FMS has many more complex features “integrated” into the agent itself, such as native event collection (we use an API that comes from Windows NT4 and ensures compatibility and speed, nothing to do with WMI methods), inventory collection, services and processes watchdog, real-time collection of process and service failure, WMI native interface for the user, performance counter parameter collection, network checks integrated into the agent and many other features that cannot be implemented with “scripts” or commands, since they imply that the agent works at a low level, not at user level.
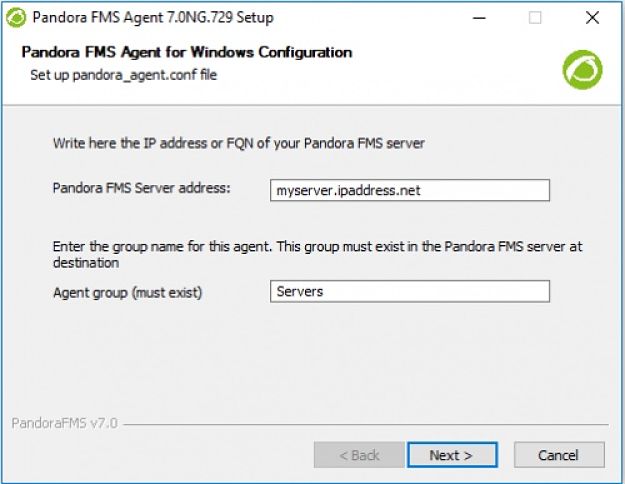
Pandora FMS has graphical agent installers for Windows and Mac, and packages for installation in BSD, Solaris, HPUX, AIX, Linux (RPM, DEB and Tarball).
If you want to find out more about monitoring with agent plugins you may watch the following video:
7. Scalability
If you refer to public success stories, extracted from the respective official websites, the most complex project undertaken in a client who exposed their case with figures and metrics, is that of Rakuten (Japan) with Pandora FMS, in which almost 10,000 nodes are monitored. Pandora FMS has identified installations that use the Open Source version with more than 30,000 nodes, and theoretically with the distributed architecture of version 6.0 -in the Enterprise version- it could be possible to reach one million nodes. Official Pandora FMS documentation offers recommended figures of 3,000 agents per server.
Nagios has a plethora of ways, each more artisanal, to offer distributed monitoring. Zabbix and Pandora FMS adopt a similar model, although Pandora FMS has a specific product (Metaconsole) for large, complex and distributed environments.
However, you do not need to use the Enterprise version to make Pandora FMS Community monitor several hundred thousand devices, we have users who do so.
8. Network environments
Undoubtedly, in network environments, Pandora FMS Enterprise is well above Zabbix or Nagios. We are talking about advanced features such as Remote Network Configuration Management (NCM), which allow you to deploy configurations in bulk mode, update firmware, detect changes, back up, etc.
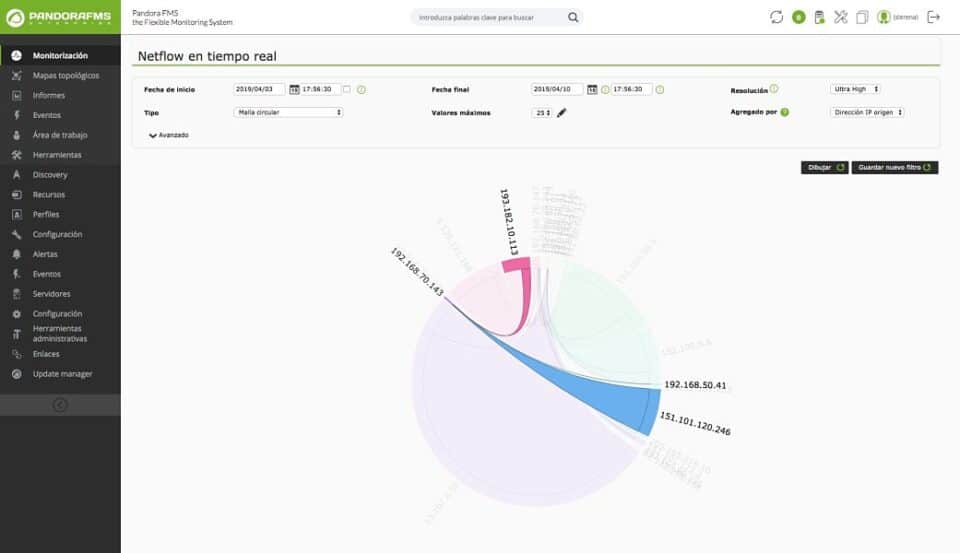
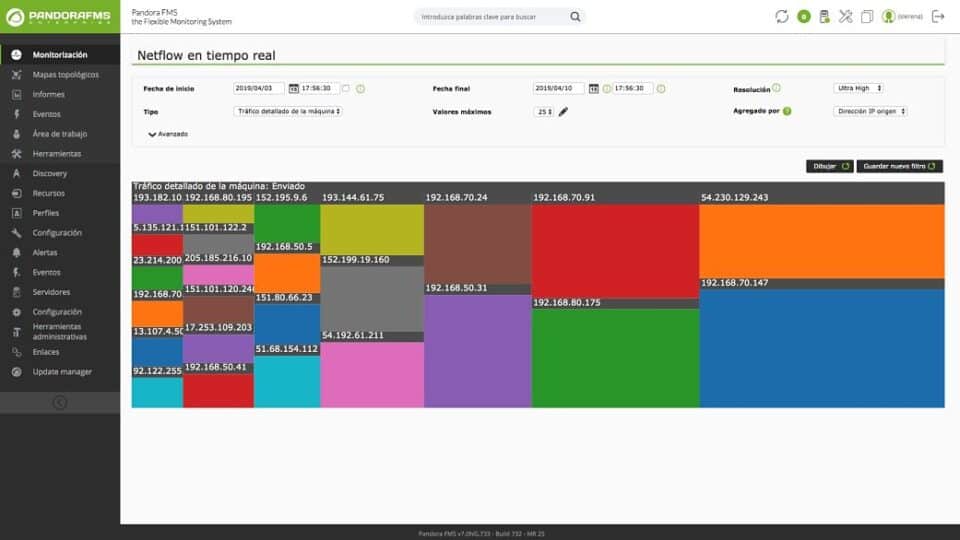
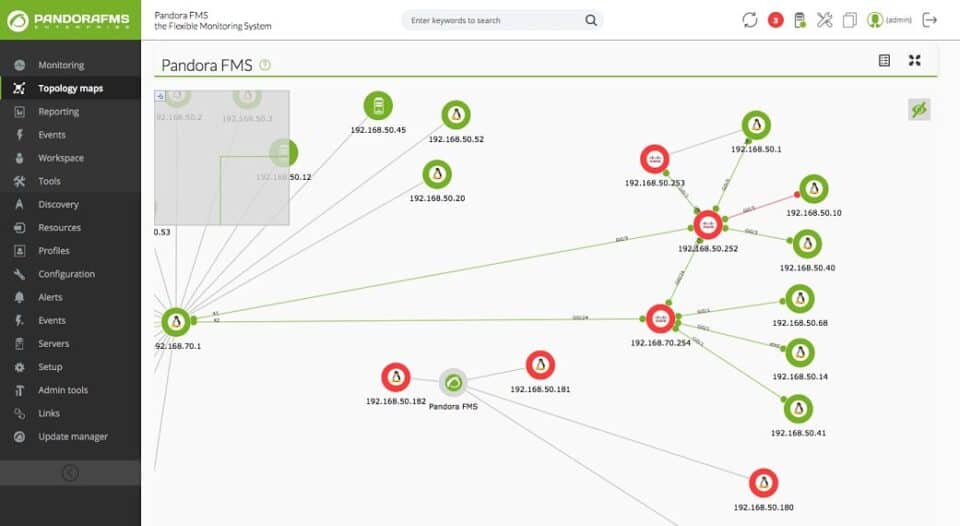
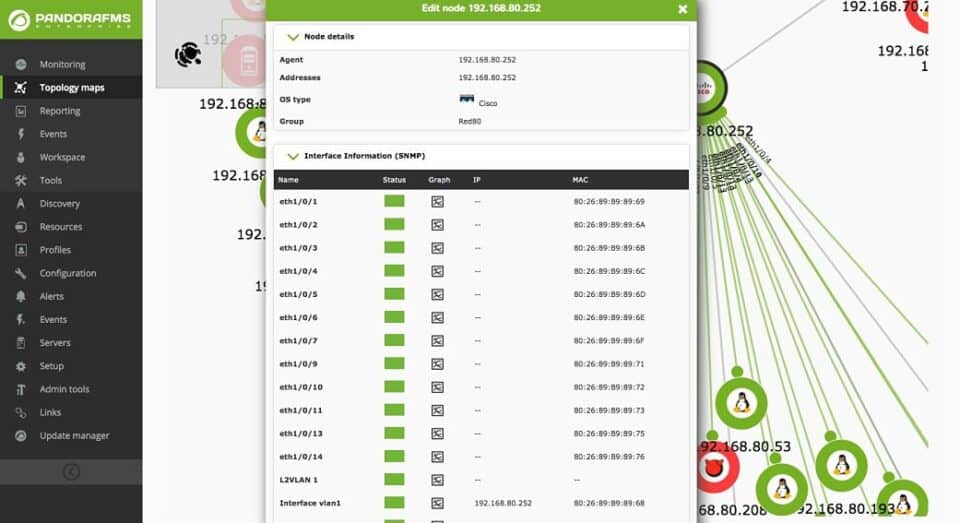
It also has an integrated IPAM system for managing IP, subnets and supernets or its Satellite server for high-capacity distributed network monitoring, or WUX, the User Experience monitoring system. All of them Enterprise features, although the Community version comes with an arsenal of free features such as Netflow monitoring and editable network map management, which allow network scanning and automatic discovery.
Summary and conclusions
We hope that with this comparison between the three tools the most used in IT monitoring you get an idea of what the advantages and disadvantages that these three systems have are. Any questions or features that you may want us to add, or opinions that you consider appropriate, do not hesitate and comment on the post.
Pandora FMS is a flexible monitoring software, capable of monitoring devices, infrastructures, applications, services and business processes.
Would you like to find out more about what Pandora FMS can offer you? Find out clicking here: https://pandorafms.com/
Or if you have to monitor more than 100 devices, you can also enjoy a Pandora FMS FREE 30-DAY TRIAL. Get it here.Do not hesitate to send us your questions. Pandora FMS team will be happy to help you!
Pandora FMS’s editorial team is made up of a group of writers and IT professionals with one thing in common: their passion for computer system monitoring. Pandora FMS’s editorial team is made up of a group of writers and IT professionals with one thing in common: their passion for computer system monitoring.


