Web applications? Blogs? What you need is web monitoring tools!
In English, the word “present” has two different meanings: the first one is “now”, as in now that you are reading this article, and also the meaning of gift. There is no misunderstanding here, but there is also the adjective “free”, which can mean free, something that does not need to be paid, or having freedom. Today we will see several free applications that you may use as web monitoring tools.
Web server monitoring
What do we look for in web monitoring tools? What is a web server?
Its definition entails a computer or device capable of offering information or data through a HTTP protocol (or safely by HTTPS). Its monitoring involves two large areas: internal monitoring and external monitoring.
The internal part consists of three key points:
- General state of your web server: load, disk space and component temperature (if not virtual). Summing up, the basic values of any server.
- Web traffic: open and listening connections, addresses, etc.
- Information contained in logs: it is very important to configure, given the fact that there are several domains on the same web server, each of them with its very own file.
For external monitoring:
- Simple tests: whether it has connection, the response time, certificate expiration (if it uses HTTPS), etc.
- Transactional web monitoring: It monitors processes that meet certain requirements. The simplest example is knowing whether a user can log in to your web server (let’s say you have a simple blog with WordPress installed).
Pandora FMS
If you are a new to our blog, here you have a surprise: The open source version of Pandora FMS is capable of working with the 3 cornerstones of internal monitoring (through software agents) and the first key point of external monitoring!
Can’t you believe it? I will explain:
Everything described so far can be read in more detail on this link.
You probably use a web server with Apache: for that specific case, we have an excellent article written by the creator and founder of Pandora FMS.
Network monitoring (local or wide area) is indirectly involved with web monitoring.
After using Pandora FMS and / or some of the web monitoring tools here indicated, you can optimize your web, since web application performance has become a key element for the correct operation of organizations.
And not only that, in addition to the aforementioned monitoring, Pandora FMS Enterprise version has a powerful WEB user experience server that allows to record your transactions and break them down into different stages for their monitoring, notifying as a result whether the transaction was successful, the total time it took and the individual time of each stage.
Moreover, it there is any problem with the transaction, it will take a screenshot when it can no longer go on, which you will be able to easily see from Pandora FMS web console.
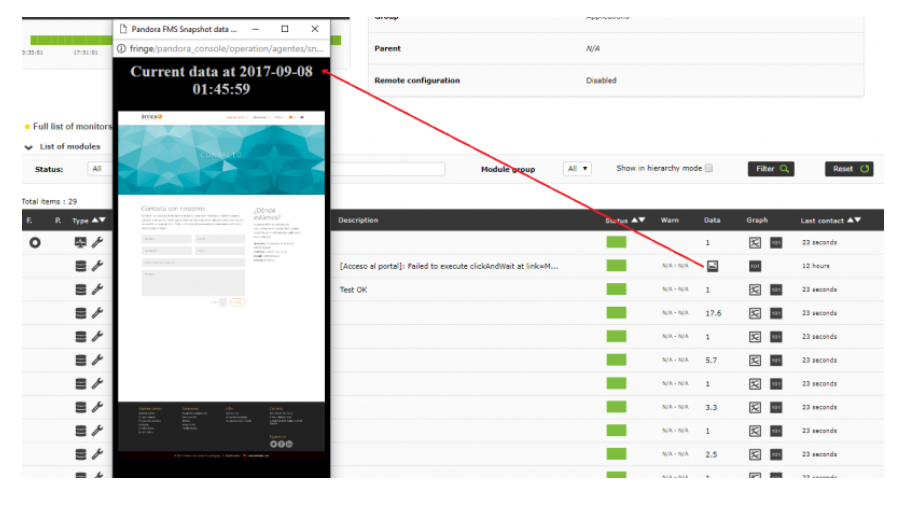
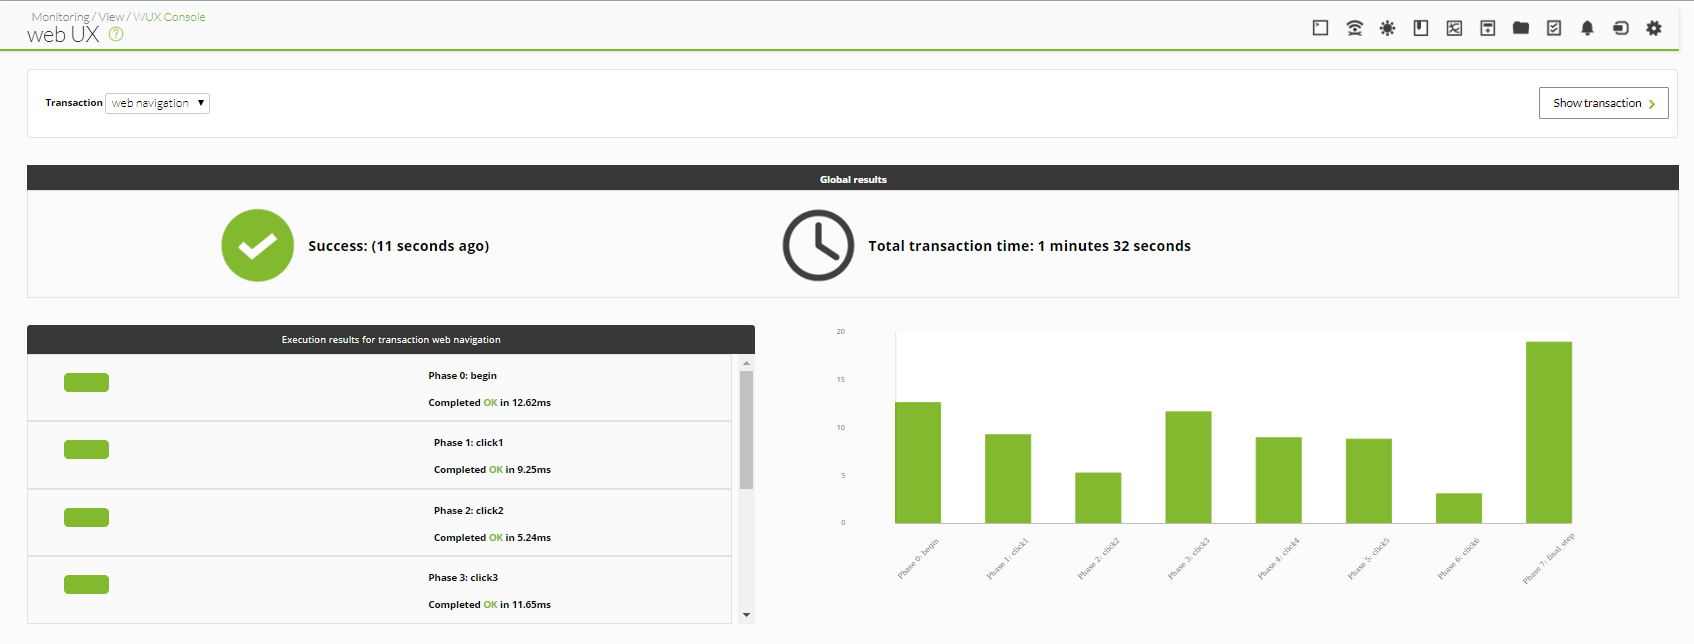
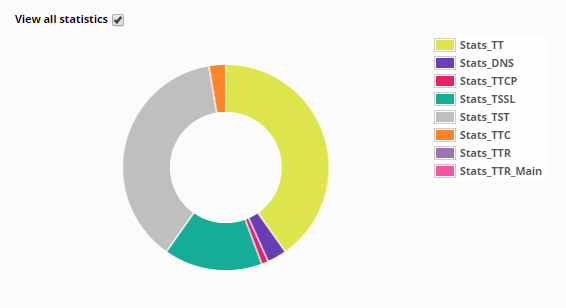
The web user experience server (WUX) not only replicates the recorded transaction in time slots, it also collects stats about the server that hosts the website, such as the website loading total time, time to resolve the server IP address (DNS), time used to set the SSL safe connection and time used to transfer each web resource, such as images, HTML code, style sheets and javascript.
All this is represented in a specific agent section where you can see it graphically.
Web monitoring tools
Going back to the topic of free applications: the web monitoring tools included here also have more permissive licenses, such as that of MIT or the Apache license itself, or more restrictive ones as the open source. Since it is a very broad topic, Wikipedia collects a lot of them, if not all.
Another type of web monitoring tool that must be highlighted is the one offered as physical service from different parts of the world. Although some are free programs, there are obviously some expenses involved in maintaining virtual or real machines all over the planet, so that it regularly reaches our website from such distant places and then inform us about it.
Once this has been made clear, let’s see now web monitoring tools.
On our own
Yes, we ourselves as programmers can take advantage of “real user monitoring”, placing specific instructions before and after our code performs read and / or write operations on our web server and keeping an additional log. Later we will see its counterpart: User Experience (UX).
I must also mention that there is a tool In CodeProject with a free custom license that tells how to work almost in an artisanal way (I do not recommend this method, I include it only for didactic purposes).
Linux Dash
I consider it the lightest, but don’t be fooled by appearances. It was created in a minimalist but versatile way: you can use Go, Python or Node.js languages, since some of these working environments will already be securely installed in your system. That way you will not add load just by installing a web monitoring tool.
Its repository is hosted on GitHub under MIT license and there is an online demo, whose screenshot you have below.

Legend: Linux Dash basic info
I think it has pretty good basics: general status, basic information (shown above) and network, account and application performance (both common and databases, etc.). They also contain modules on a board, which have a search field. Look at this search with the letter “p” in common applications:
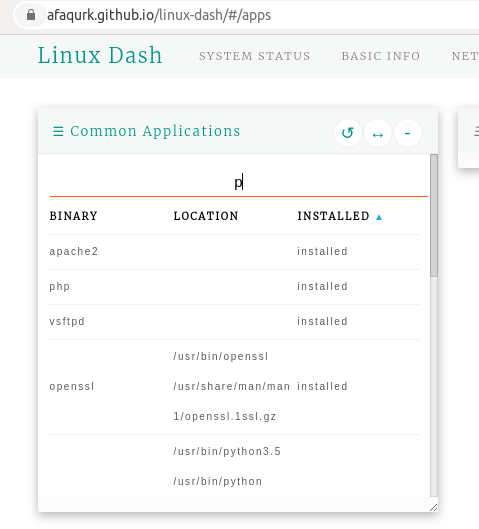
Legend: Linux Dash common applications
You will obtain information in real time, but it does not save historical information or alerts, it only has the very basics. Anyway, if you consider yourself as one of the soldiers of Leonidas in the historical film «The 300 Spartans» (the one from 1962), you will surely feel comfortable with this web monitoring tool.
eZ Server Monitor
It has a totally free license, GNU GPL3, written for GNU/Linux and the possibility of incorporating visual themes, because, as you will see, it shows everything at once on a single board (seeing the same thing every day bores human beings):
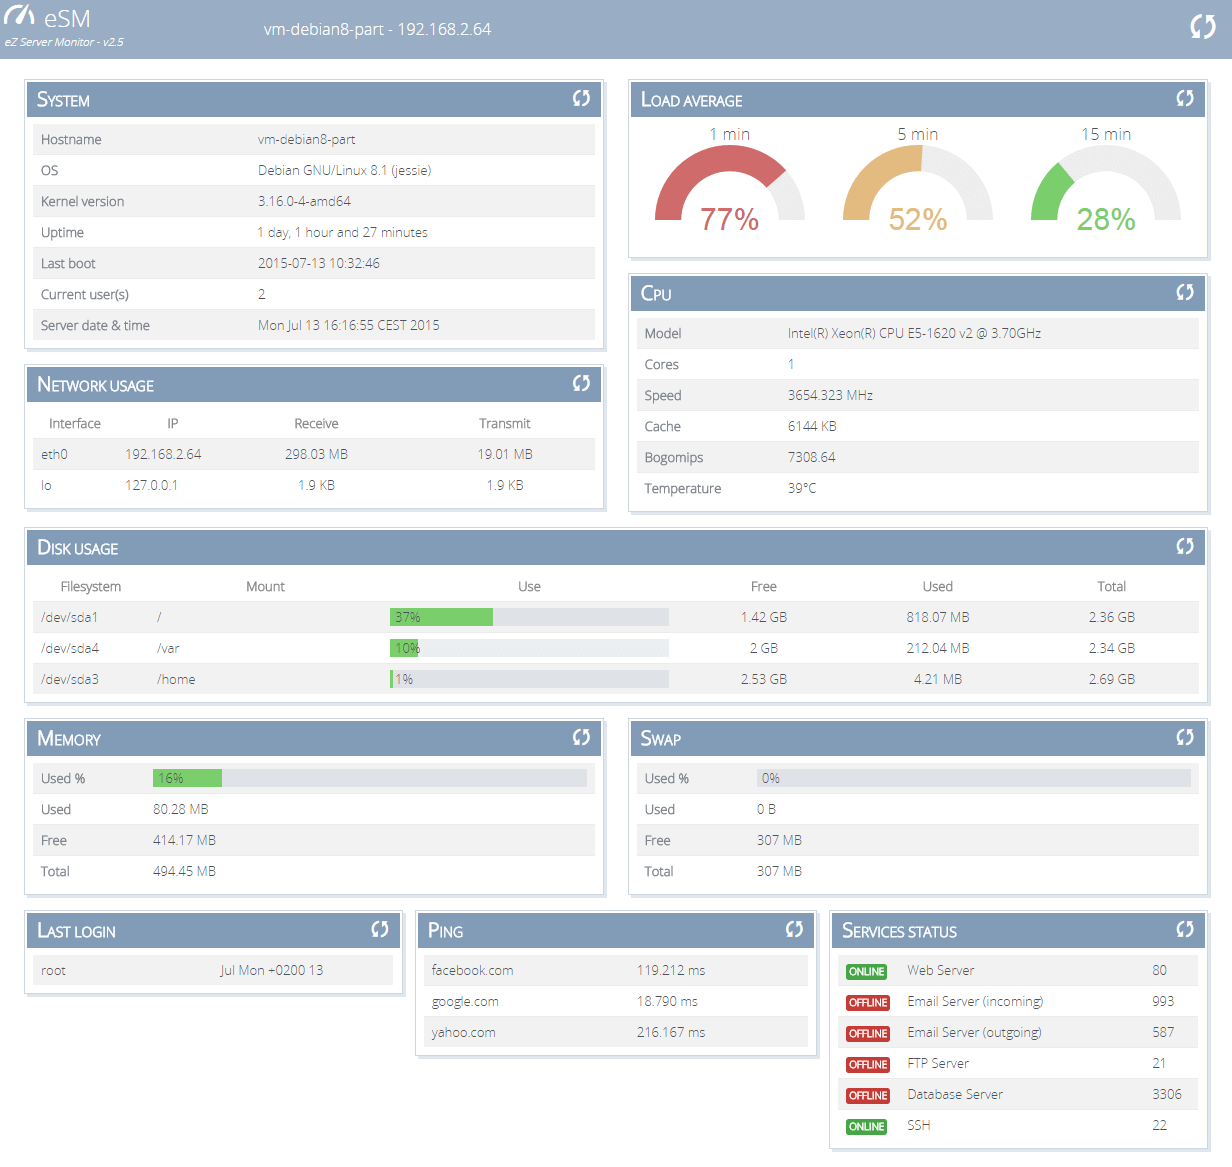
Legend: eZ Server Monitor (GitHub)
You can find out the status of the services according to the status of each port (do not forget to add the 41121 of the Pandora FMS Tentacle protocol, if you have a software agent there), it tests connectivity with ping, memory or the last connected users, among other values. It is also very light. You can see how to enable a module in a simple Raspberry Pi 3 with the identifier AW7KMmxJqnM on Youtube.
It also has a BASH version to use it in a command terminal, if you are still biased towards Sparta.
phpSysInfo
Continuing with really light web monitoring tools, phpSysInfo stands out in two aspects: it is portable and it also works in a Microsoft Windows® environment. It shares similar features as the previous ones: from here, network interface management and their traffic is what interests us. It is translated into several languages. Here you see it in simplified Chinese:
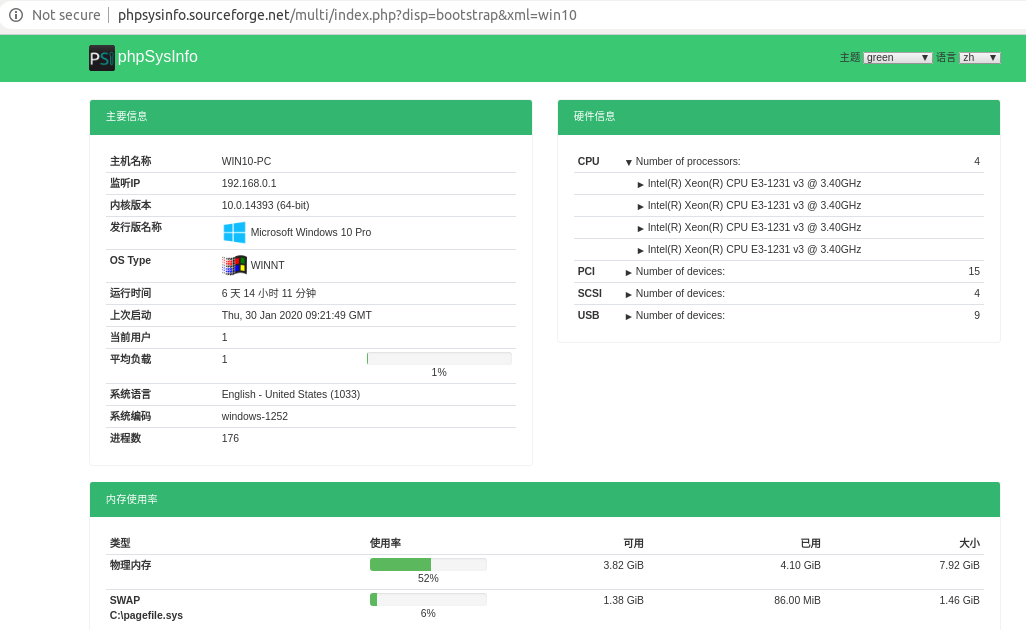
Legend: phpSysInfo (sourceforge.net)
statusok
Ok, let’s raise the bets! How about something automated to notify you by mail (or even Slack) if your website has issues? With Apache 2.0 license, you have statusok, which is also light and fast to set up. You can use your normal mail (but Gmail is recommended) or you can create your own add-ons (avizoro for Twitter).
But before you go rush off to install it, hold on: you need a database called InfluxDB and Grafana (both have free licenses) to work. It’s worth highlighting that the “difficulty” here is to install and configure the underlying tools. Here is a screenshot on how the three look when working:
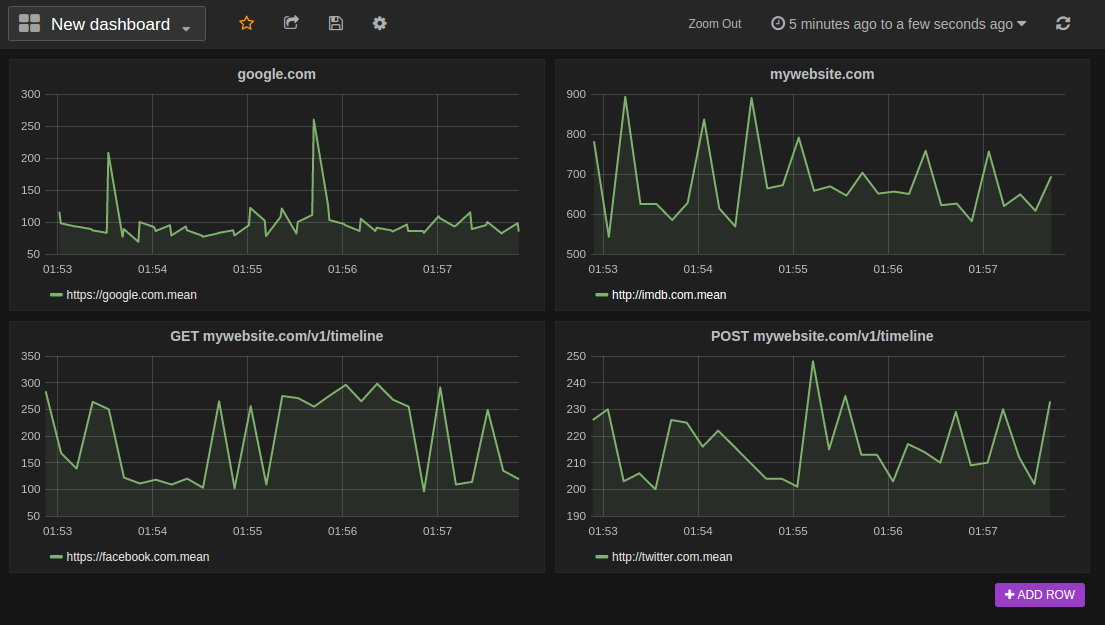
Legend: statusok using InfluxDB and Grafana (GitHub)
Selenium
For the second point of external web monitoring, I present you Selenium, with a free Apache license. It has been developed for years and it is written in Java language. Do you remember that I mentioned user experience (UX)? Well, with Selenium you can create scripts and actions (keystrokes, mouse movement) to simulate that a user interacts with your website, and enters and performs transactions. I consider them to be the most complex web monitoring tools because Selenium has many components and add-ons.
As components, there is an API for several languages such as Python, Ruby, JavaScript, C # and of course Java as well. As complements you can use InternetExplorerDriver and compile with Visual Studio 2008® and thus use it in environments with Microsoft Windows®.
But Selenium is complex. Very complex. I will explain it quickly:
First you must have a development environment called Selenium IDE.
Then install Selenium Remote Control (or simply Selenium RC) to receive requests from your instructions to perform your virtual user transactions.
Once you have read the above, I inform you that this tool is not used anymore… Why do I recommend it then? Because it is part of the classic monitoring, which I will talk about later.
Selenium WebDriver has become the Selenium RC replacement. To give you an idea, it allows the use of web browsers without a graphical interface, that is, only by using text commands. There is also the so-called HtmlUnit, a free program written in Java too. Also, browsers like Google Chrome and Mozilla Firefox have long supported this mode, specially designed for automated testing. It is even part of the standard recommendations of the WWW Consortium (W3C).
Selenium Grid: how about placing a software agent that tests your website on different continents, separated by thousands of kilometers as I depicted above? Well, with Selenium Grid we organize nodes, each with individual WebDrivers and for different browsers. I consider this the best web monitoring, because it combines in real time and distance, but with mock users in different scenarios. How about for 7 thousand users? Two thousand five hundred logging in from Africa, some requesting services, some not, always at the same time? The possibilities are endless.
Other web monitoring tools
Before finishing, remember Pandora FMS is a flexible monitoring software, capable of monitoring devices, infrastructures, applications, services and business processes.
If you have to monitor more than 100 devices you can enjoy a 30 days FREE DEMO of Pandora FMS Enterprise. here.
Do not hesitate to send us your questions. The Pandora FMS team will be happy to assist you!
* Article written by Jimmy Olano with the collaboration of Rafael Ameijeiras.

Traductora a francés e inglés. Me encantan las lenguas. Amante de la ropa oversize, la tarta de queso y el chocolate caliente en invierno. Me gusta leer, escuchar música, viajar y explorar cosas nuevas. Mi frase más temida por aquellos que me conocen es “he estado pensando…”
Translator into French and English. I love languages. Lover of oversized clothes, cheesecake and hot chocolate in winter. I like reading, listening to music, travelling and exploring new things. My most feared phrase by those who know me is “I’ve been thinking…”


