You already know that in this house we love comparisons. Somehow you have to elucidate which is the best monitoring tool on the market, right?
Well, this time we bring you the final battle between three great ones. Prometheus vs Nagios vs Pandora FMS. Nothing like that had ever been seen before in the ring!
Let the bell ring!
Prometheus vs Nagios vs Pandora FMS, the final battle
What is Prometheus?
Prometheus seeks to be a new generation within open source monitoring tools.
A different approach with no legacies from the past.
*You know, for years, many monitoring tools have been related to Nagios by its architecture and philosophy or directly for being an total fork (CheckMk, Centreon, OpsView, Icinga, Naemon, Shinken, Vigilo NMS, NetXMS, OP5 and others).
Prometheus however, is true to the “Open” spirit: if you want to use it, you will have to put together several pieces.
Somehow, we can say that like Nagios, it is a kind of Ikea of monitoring. You’ll be able to do lots of things with it, but you’ll need to put the pieces together yourself and devote lots of time to it.
Prometheus is a data collection tool that works with time series data.
Many companies that need to integrate a tool into their developments and operations choose Prometheus as their primary source of monitoring data because it easily adapts to most software architectures, quickly integrates with most modern technologies, and becomes a kind of data acquisition and management middleware standard.
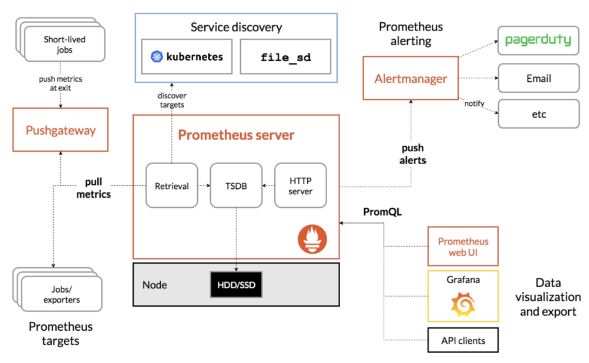
It is usually integrated with Grafana to display data, as the Prometheus user interface is quite basic.
What is Nagios?
Nagios is a classic reference in IT monitoring. You can already see some previous comparisons of ours, with this tool.
What is Pandora FMS?
Pandora FMS is an all-in-one monitoring software used for both IT monitoring and integrating monitoring processes of all kinds, from IoT projects to business tracking projects.
Features
Prometheus and Nagios/Pandora FMS on the other hand offer many different features.
The type of data Nagios works with is very closed and focuses on states, being able to collect numerical metrics.
Prometheus in raw data.
Pandora FMS manages both with flexibility, although Prometheus is undoubtedly the most flexible when it comes to managing open data.
Prometheus collects data from applications that send metrics to their API endpoints (or exporters).
Nagios uses agents that are installed on servers and through SNMP checks. It has a large and heterogeneous plugin system to collect data from other sources. One of its great virtues is this ecosystem (Nagios Exchange).
Pandora FMS has a more centralized system for remote polling (SSH, WMI, SNMP, web transactions, etc.) and is much more convenient to manage by its unified web interface.
It also allows, like Nagios, to collect logs and process Netflow data streams, which Morpheus does not even contemplate.
Reports and control boards
As we said before, the charts and dashboards provided by Prometheus do not meet the current needs of DevOps that are very focused on creating their own dashboards, charts with combined data, and generating screens that serve to show other people.
Many Prometheus users use other visualization tools to display metrics collected by Prometheus, often Grafana.
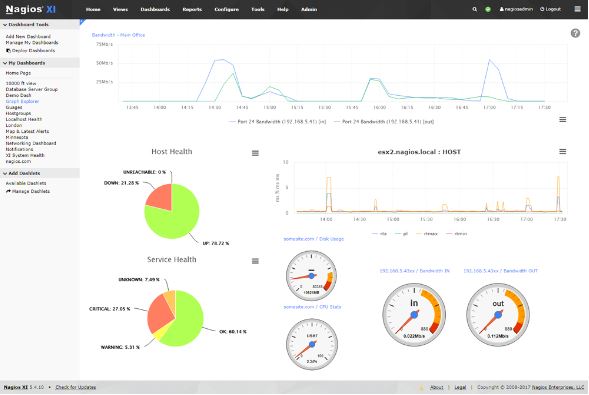
Nagios comes with a set of dashboards that conform to the monitoring requirements of networks and infrastructure components.
However, it lags far behind in this area. Although it has visual screens and other third-party plugins for reporting, it is perhaps one of its weakest points.
Pandora FMS, however, has excellent graphics, custom dashboards (dashboards) and visual screens (Visual Console) that allow you to customize the appearance of the collected data.
On the other hand, its system of templates and reports is extremely powerful and flexible, especially regarding Top-N type reports, different SLAs and all kinds and examples of charts, lists and summary tables.
Nagios XI
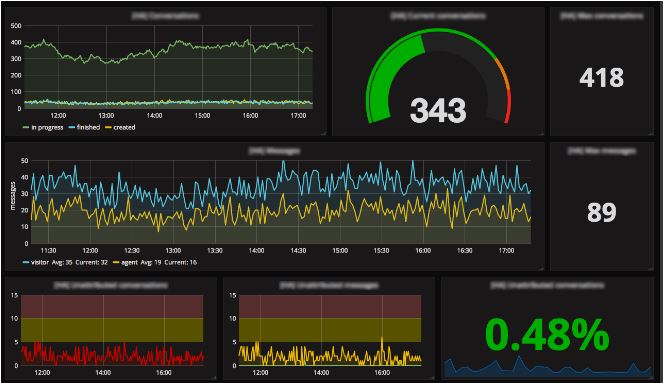
Grafana + Prometheus
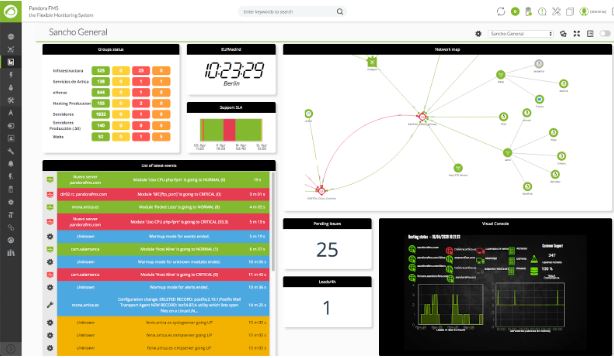
Pandora FMS
Management, configuration, operation, installation and update
Perhaps this is the big difference between Pandora FMS on the one hand and Prometheus and Nagios on the other.
While in Pandora FMS 99% of the configuration is through a graphical interface, with Prometheus and Nagios you will have to deal with configuration files and constant reboots.
The same happens when you want to update, it is a process that requires Linux knowledge and managing with the shell.
In Pandora FMS, it is fully automatic.
As for Pandora FMS initial installation, it can be done using a docker or an online installation with a single command.
In Prometheus and Nagios the installation can be tedious although preconfigured images already exist with Docker.
None of the three tools is click & play anyway. None is a toy that can be simplified since all three are powerful multipurpose and extremely versatile tools.
Community
Prometheus has been growing in recent years, and has more and more extensions.
However, the leader in this category is Nagios, who remains the reference of the community and has the largest library of extensions.
Although Pandora FMS already has a large library of plugins (mostly Enterprise applications), it is behind that of Nagios.
What will you miss in Prometheus?
Particularly, reports, dashboards and a centralized configuration management system.
An interface that allows observing and monitoring grouped information in services / hosts.
Actually, in order to do something you will have to install Prometheus and a set of applications to integrate them together.
What will you miss in Nagios?
A centralized management interface. Wizards, customizable reports and above all, unified management of agent configuration.
What are the great disadvantages of Prometheus over Nagios or Pandora FMS?
Prometheus is designed to work with data.
It has no statuses, no service groupings, and you will not have a view that respects a hierarchy of elements that you can associate with your organization (networks, system groups, hosts).
Prometheus is a data processing ecosystem, not a common IT monitoring system.
Its power in data processing is far superior than that of Nagios, but the use of that data for day-to-day use makes it extremely complex to manage, as it requires many configuration files, many external commands distributed and everything must be maintained manually.
The graphical interface also does not help, as it is excessively simple and does not allow you to configure anything.
We can say that like Nagios, it is a kind of monitoring Ikea, and that Nagios is much more limited in terms of its data processing power, but much more specific when it comes to using that data for something useful and visible.
Conclusion
Comparing Prometheus with Nagios is not fair as they have different approaches, Nagios is much more prepared for traditional IT monitoring, in less time, with less complexity and with more understandable results, even though it is older technology and with a much more rigid architecture that becomes difficult to integrate with the requirements of today’s hybrid environments.
Nagios and Pandora FMS have more resemblance to each other than either of the other two.
However, Pandora FMS integrates better than Nagios with external development processes, since like Prometheus, it also works with raw data as a source of information.
Unlike Prometheus, Pandora FMS uses an SQL backend allowing easier integration.
On the other hand, like Prometheus, Nagios has many “additional” interfaces that are ultimately needed to display maps, graphs, and other types of reporting.
In Pandora FMS everything is “included” as standard: reports, dashboards, dashboards, graphics, etc.
Prometheus has two main advantages over Pandora FMS and Nagios: the fact that it is designed to be part of an integration and its ease of use by having far fewer features.
Its main disadvantage is its poor scalability and the fact that many of the features of Nagios and Pandora FMS just do not exist in Prometheus, especially in network monitoring or in reporting.
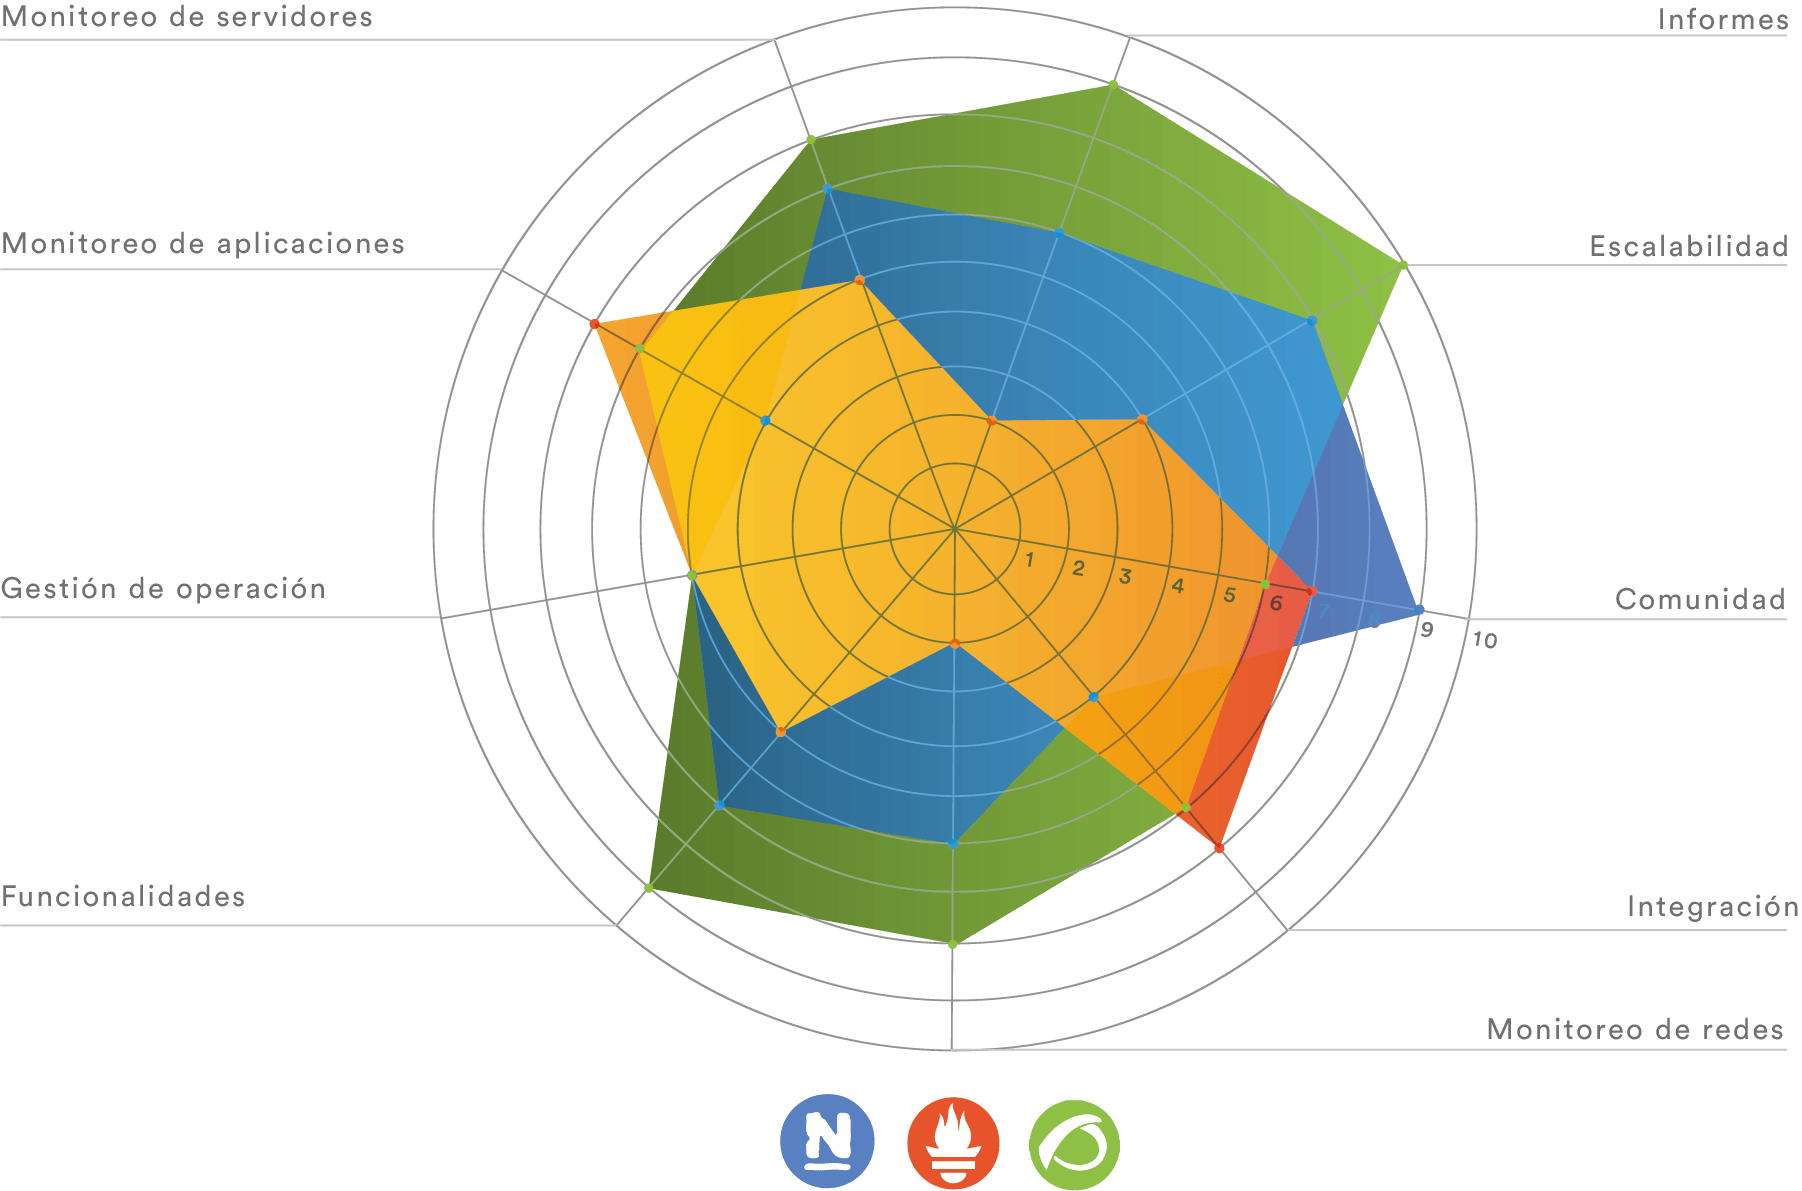
Radar-type graph
Pandora FMS’s editorial team is made up of a group of writers and IT professionals with one thing in common: their passion for computer system monitoring. Pandora FMS’s editorial team is made up of a group of writers and IT professionals with one thing in common: their passion for computer system monitoring.


