


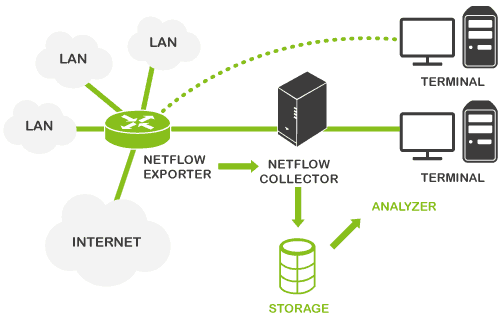
NetFlow is a web protocol designed and created by Cisco to collect metrics on IP traffic and currently constitutes an industry standard in the world of network monitoring. It enables monitoring and analysis of any traffic generated by a specific IP, protocol or software, through allowing filters to be applied based on a source and destination IP address, and a source port and destination port. It works like this:
This is how it works:
- A NetFlow-compatible device; usually network hardware such as a router or switch, which generate packets; or alternatively, a NetFlow probe.
- A NetFlow collector; this receives the packets generated by one of the above devices (whichever it may be), and stores and processes them; usually a dedicated server, or similar network tool.
Let’s take a look at configuring something similar, with the intention of monitoring NetFlow, using a Raspberry device as a netflow probe, and a Pandora FMS server to store and analyze the NetFlow information. And let’s bring it all in at under €100!
Installing and preparing Raspberry
Raspberry comes with a dock for a microSD card, which you can use to install the Raspbian OS. If you have the card with the NOOBS image you can install the OS directly from there, otherwise download it from the official website and set up your own microSD card.
When you boot up Raspberry with the microSD, a wizard will guide you through the installation process, and soon the OS and your device will both be good to go.
Your device’s IP can be automatically designated by DCHP, either by cable or WiFi; your router will automatically provide a free IP. Later we’ll look in more detail how to configure your network in order to work with these conditions.

We’re using Raspbian PIXEL, the most recent desktop iteration.

Once Raspberry’s installed and online it’s time to download updated packets and file repositories here:
apt-get update && apt-get upgrade
Next, install the necessary components to enable NetFlow probe: nfdump, a packet which includes fprobe, nfcapd y nfdump. Each of these components has a specific function that we’ll take a look at shortly.
Previously we’ll download some required tools:
apt-get install gcc flex librrd-dev make
You have to download and install the nfdump packet (https://sourceforge.net/projects/nfdump/), it comes compressed in .tar.gz, so it requires uncompressing. Follow the installation procedure as follows;
wget http://downloads.sourceforge.net/project/nfdump/stable/nfdump-1.6.13/nfdump-1.6.13.tar.gz

tar –zxvf nfdump-1.6.13.tar.gz

cd nfdump-1.6.13

./configure

make & make install
Ok, now you’ve gotten everything you need to mount a NetFlow probe with Raspberry. Farther on, we’ll take a look at the NetFlow collector, a Pandora FMS server.
Do you want to know more about network monitoring?
Remote networks, unified monitoring, intelligent thresholds… discover network monitoring in Pandora FMS Enterprise version.
Network and environment configuration
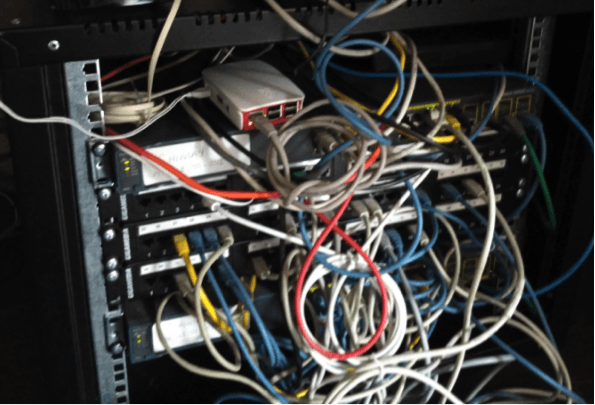
Situate the Netflow probe at a node where network traffic passes through to guarantee you’re collecting all the information about network flow that you can. In this case, the Raspberry is connected to a switch port, with port mirroring enabled, in the office, and we’re ready to monitor all the office traffic. We’re using a Cisco switch, pretty easy to configure, but you could also connect your Raspberry to a router, a firewall, or any kind of switch. Just follow the configuration rules for the device you want to use. So, here’s our setup:

On the Cisco switch, locate the port that the router and the Raspberry are connected to (in our case, Gi0/8 for the router and Gi0/16 for the NetFlow probe).
Connect the router via command line telnet:
telnet 192.168.50.252
<enter credentials>
enable
<enter administrator credentials>
Enable port mirroring:
configure terminal

monitor session 1 source interface Gi0/8

monitor sesión 1 destination interface Gi0/16
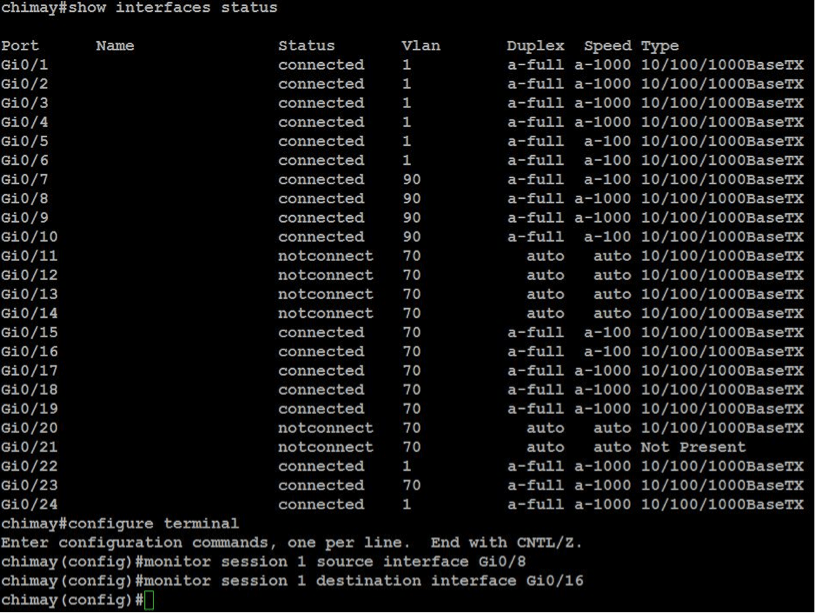
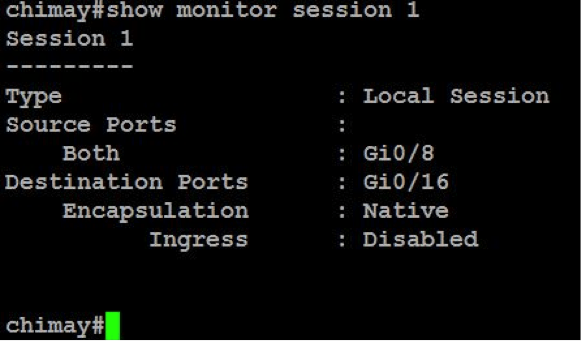
Check the configuration, execute:
show monitor sesión 1
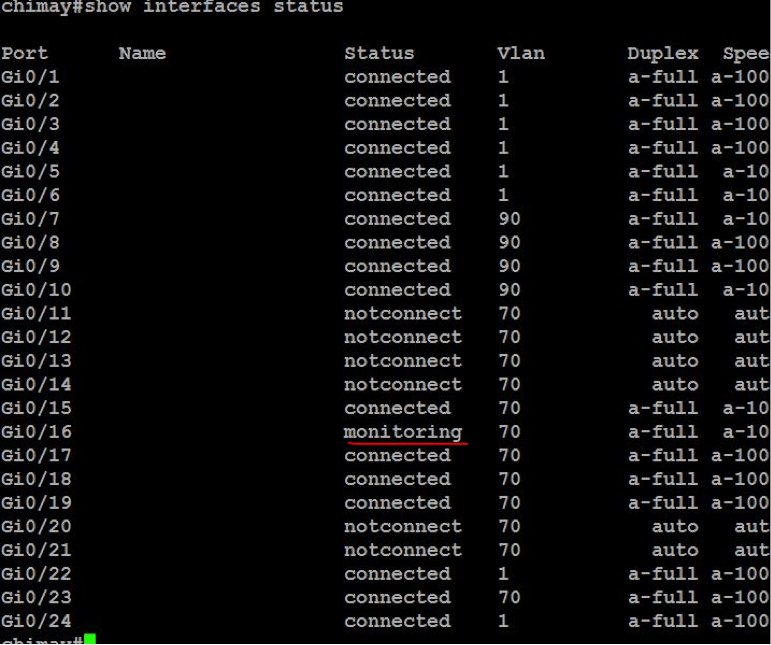
Execute show interfaces status to view the monitoring port (labeled ‘monitoring’)
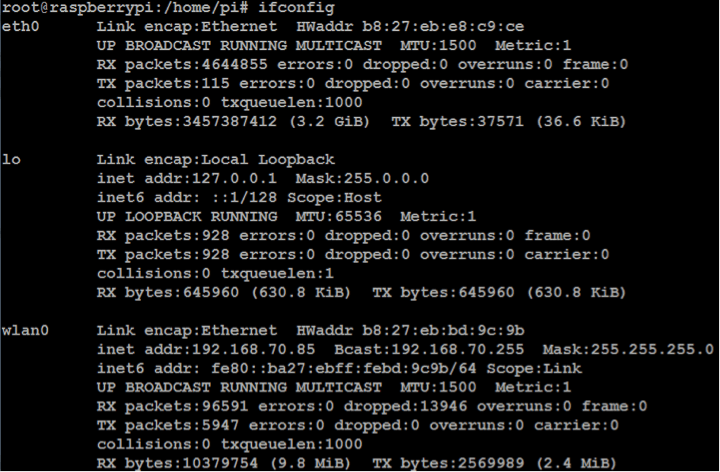
As the Raspberry’s Ethernet connection is being used to listen and collect data on traffic flow, it can’t be used to carry out the configurations necessary for sending the collected data to the Pandora server. For this reason, you need to configure the WiFi connection to enable the Raspberry to communicate with the server via ssh.
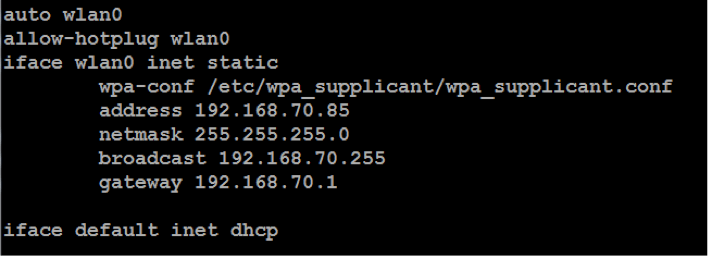
To improve access and management, configure a static IP for the wlan0 interface, and disable the IP address of the eth0 to avoid any conflict. The eth0 interface will only listen in to traffic.
Firstly, configure the wlan0’s static IP by editing the /etc/network/interfaces file in the following way:
Disable the eth0 interface IP with the command:
ip addr flush dev eth0
When both Raspberry connections are ready, enable ip_forward with the command:
echo “1” > /proc/sys/net/ipv4/ip_forward
Now execute fprobe to activate Raspberry as a NetFlow probe:
fprobe –ieth0 –fip 192.168.70.114
In the first parameter, -ieth0, substitute eth0 for the name of the interface where the network traffic flows through, and in the second parameter, -fip, use the IP address where you want to redirect the data collected by your probe.
To ensure the probe remains active in case of reboots, or process interruptions of any kind, it’s a good idea to implement a script which automatically maintains its active status. The script we used checks that the probe is running and, if it detects that it isn’t, turns it on again. The script (NetFlow.sh) is included in a cron task and executes every five minutes:
#!/bin/bash

check=`ps aux | grep fprobe | grep -v grep | wc -l`

if [ $check -eq 0 ]; then

/usr/sbin/fprobe -ieth0 -fip 192.168.70.41:9995

fi
For five-minute interval execution:
echo "*/5 * * * * root /home/pi/netflow.sh" >> /etc/crontab
Remember to give the script permission to execute, or indicate the motor to use (sh). Finally, although this method guarantees the execution of the process, just to be on the safe side, in case of manual intervention, or problems at booting, you can add another script to the file, /etc/rc.local to launch the process as soon as the Raspberry starts.
Prepare the NetFlow collector/ Pandora FMS
Now you need to prepare the point of entry for the NetFlow packets, a Pandora server capable of processing the data and presenting it in the form of graphs.
Install the nfdump packet as in Raspberry with the necessary utilities:
yum install gcc flex librrd-dev make
Secondly, nfdump packet:
wget http://downloads.sourceforge.net/project/nfdump/stable/nfdump-1.6.13/nfdump-1.6.13.tar.gz

tar –zxvf nfdump-1.6.13.tar.gz

cd nfdump-1.6.13

./configure

make & make install
If your Pandora FMS was installed with the official ISO the following steps can be ignored, as the components come pre-installed. Once the nfdump packet’s installed, use the nfcapd utility to open a listening path and receive the NetFlow data from the Raspberry probe. Use the following command:
nfcapd –l /var/spool/pandora/data_in/netflow –D
The –l parameter indicates the route where the data is to be stored, and which should coincide with the NetFlow configuration section of your Pandora console, and the –D parameter permits background execution (daemon mode) to listen full time to NetFlow data coming from the probe.
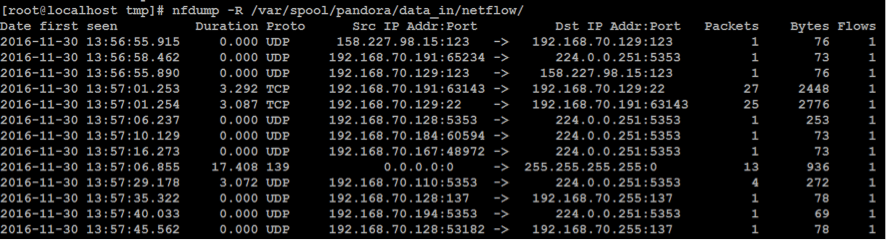
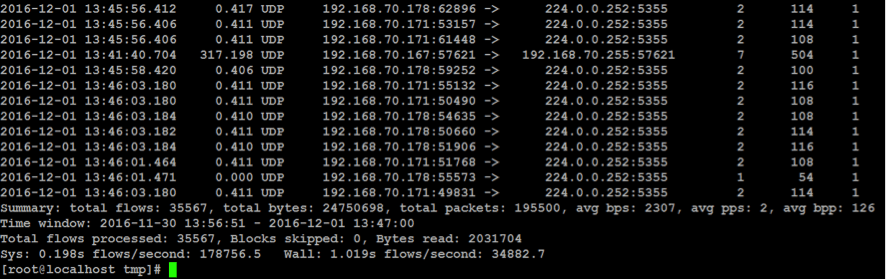
You should now be able to see NetFlow data on your Pandora server. To check everything’s A-OK just execute:
nfdump –R /var/spool/pandora/data_in/netflow
You should see something like this:
Enable NetFlow visualization on the Pandora FMS console setup (Setup -> General):
General:

A new Setup section will appear, where NetFlow parameters can be viewed:
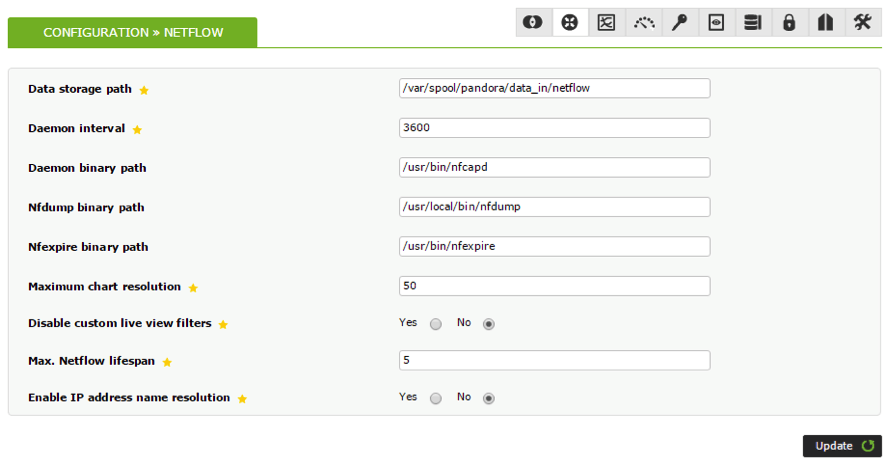
Remember: the “Data storage path” must coincide with the one indicated when nfcapd is executed since this is the directory where Pandora will read the data it uses to create graphs.
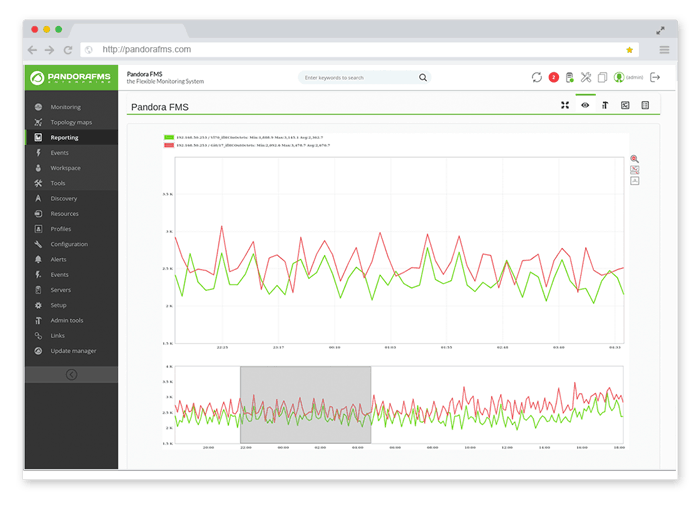
There will be a new element in the view menu; “NetFlow Live View”:
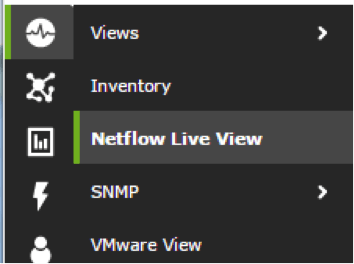
From here you can observe and analyze all the available data received from the NetFlow probe, plus apply different filters to get more detailed information. The basic filters include a series of fields, such as IP or destination and origin port; the advanced filters support pcap filtering:
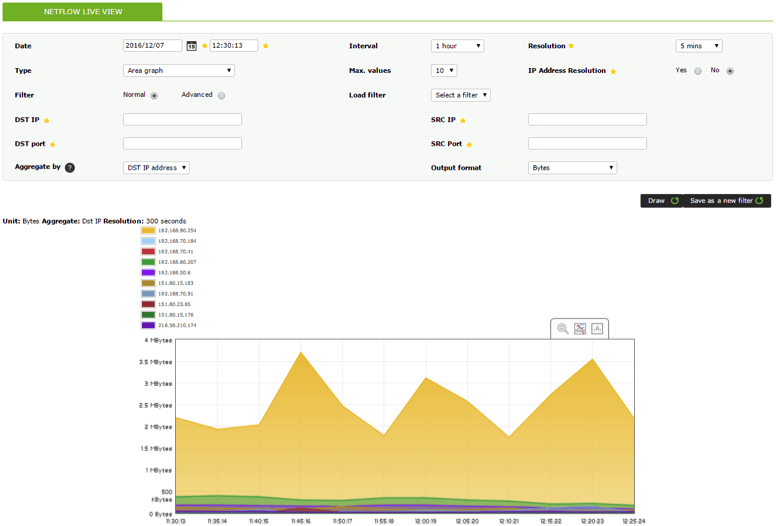
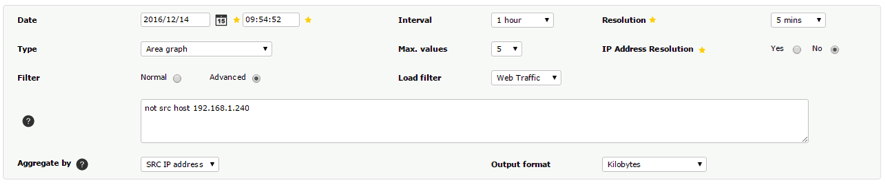
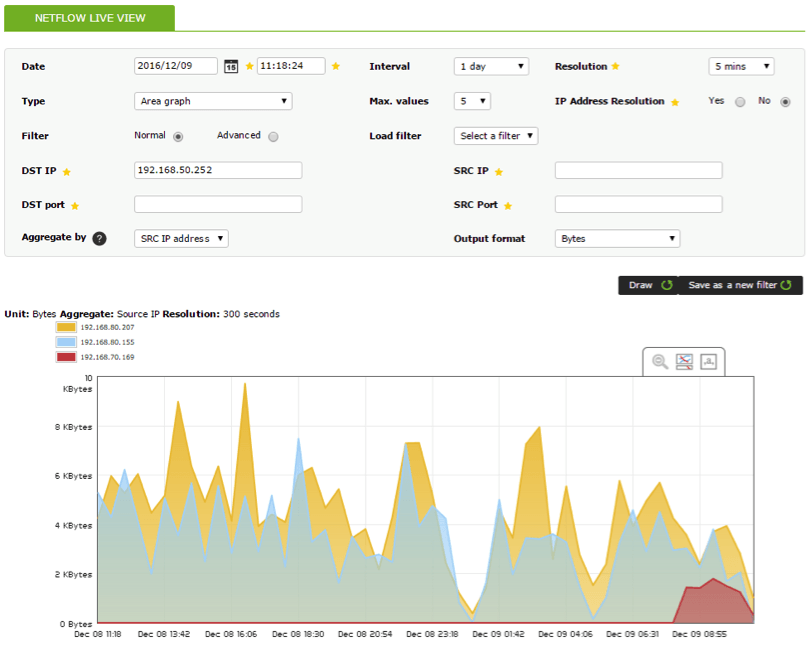
Data can be displayed in different formats of graphs and charts. In the previous image the default graphic with the standard Pandora FMS format can be seen.
Pie chart:
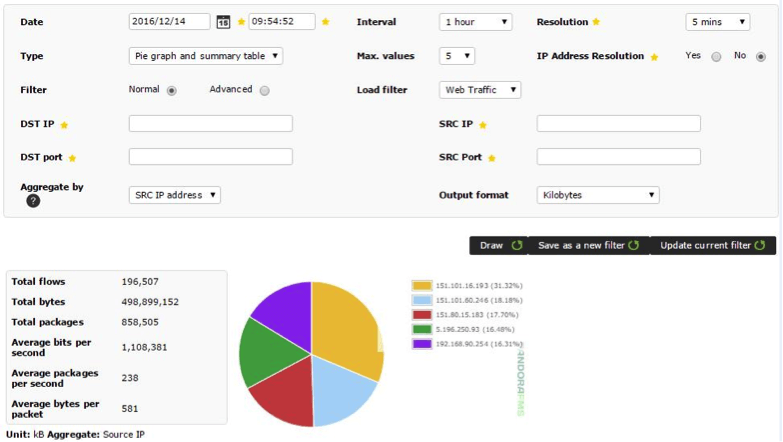
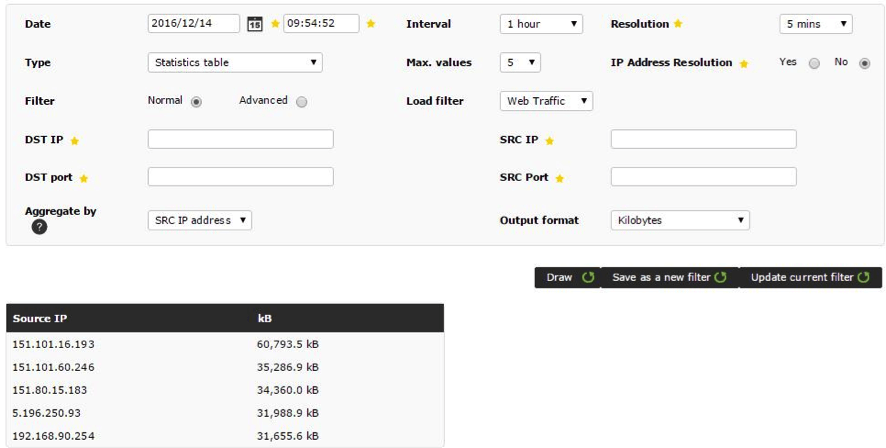
Tables:
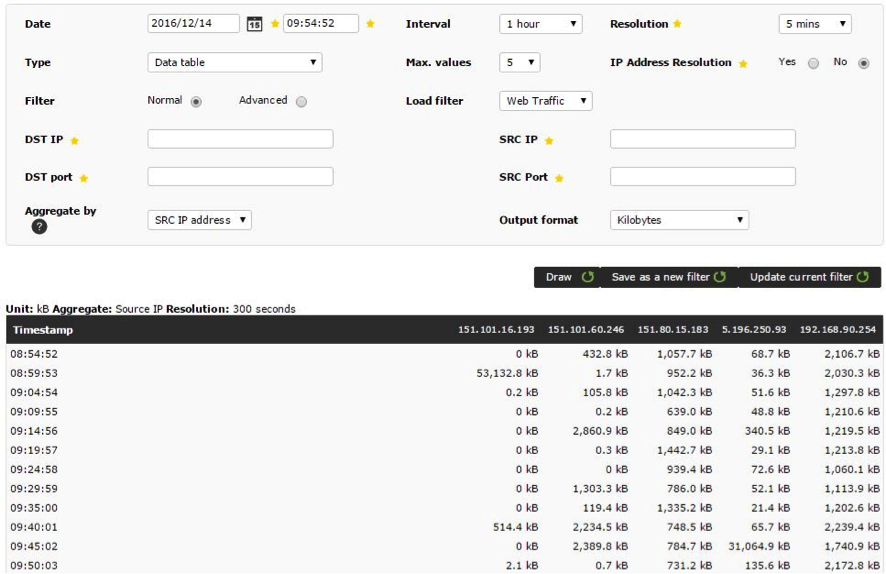
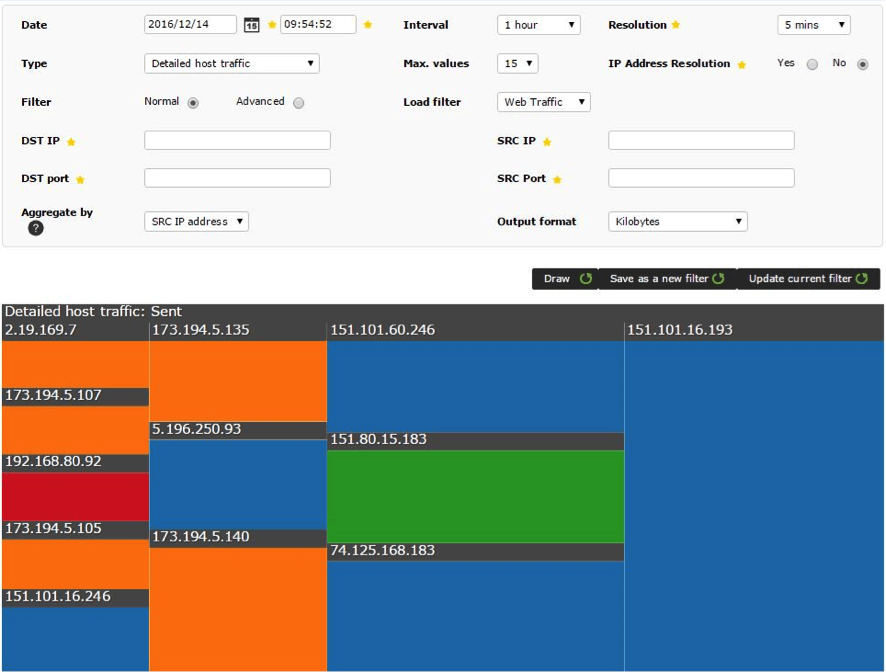
To view in more detail, swipe the cursor over the element you wish to see:
Filters can be saved and reused, and these same filters allow visualization of the data collected in NetFlow reports. Users without permissions to manually create filters can also have access to these filters.
EXAMPLES
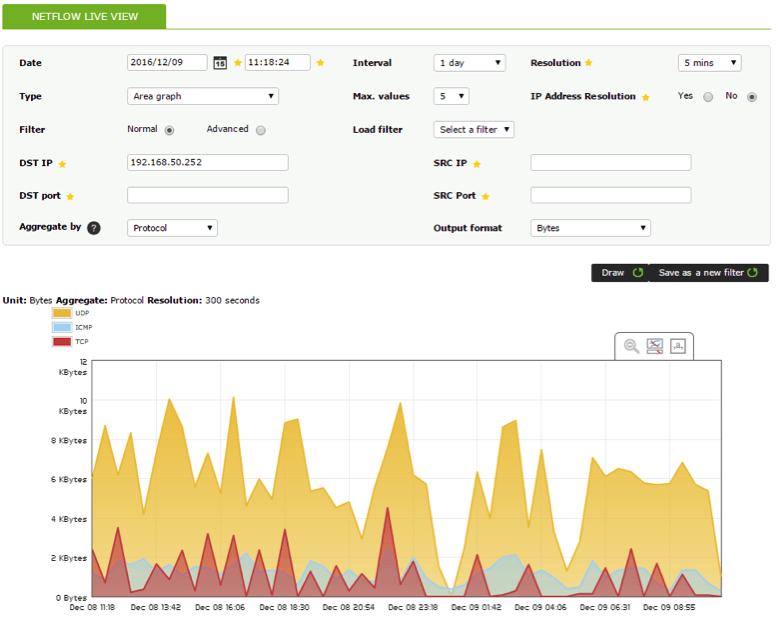
1. Show all daily IP traffic with destination address 192.168.50.252:
2. Show protocols employed daily by IP destination address 192.168.50.252
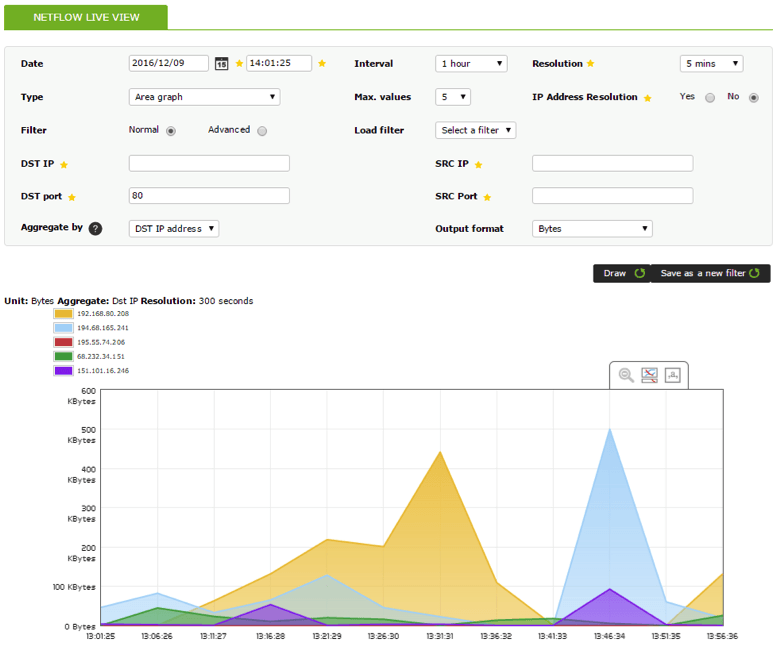
3. Show 5 traffic results from origin port 80 during a 1-hour interval:
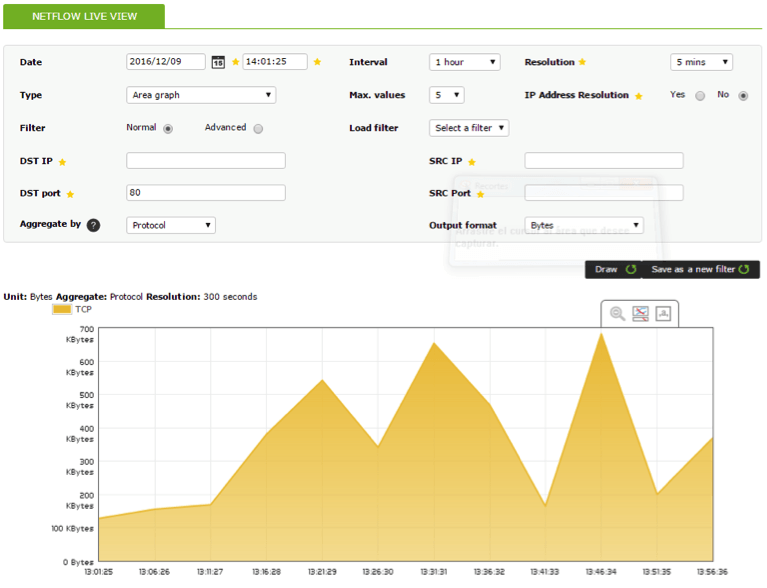
4. Show traffic with destination port 80 during a 1-hour interval, plus protocol:
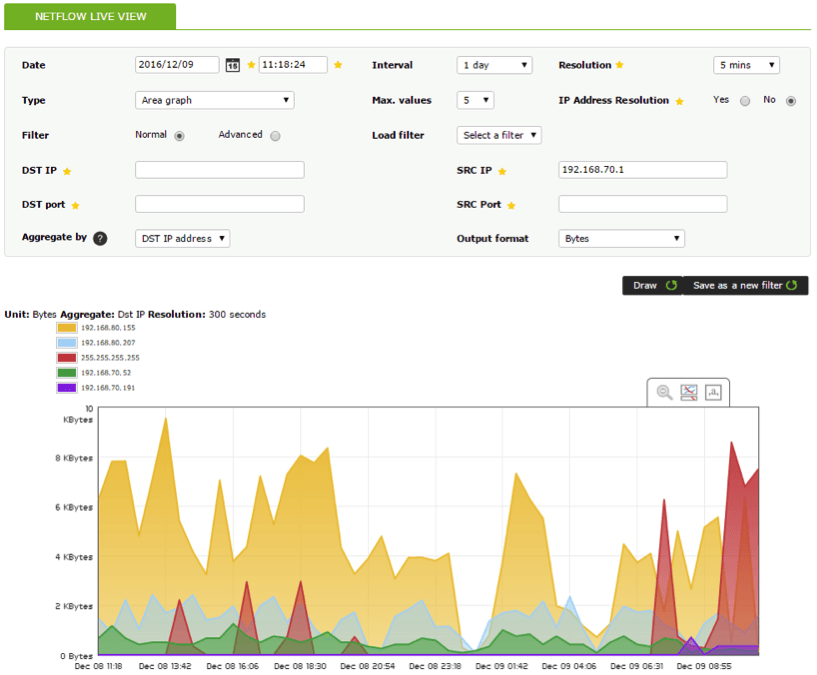
5. Show 5 results from destination addresses with origin 192.168.70.1 during a 1-day interval:

Pandora FMS’s editorial team is made up of a group of writers and IT professionals with one thing in common: their passion for computer system monitoring. Pandora FMS’s editorial team is made up of a group of writers and IT professionals with one thing in common: their passion for computer system monitoring.


