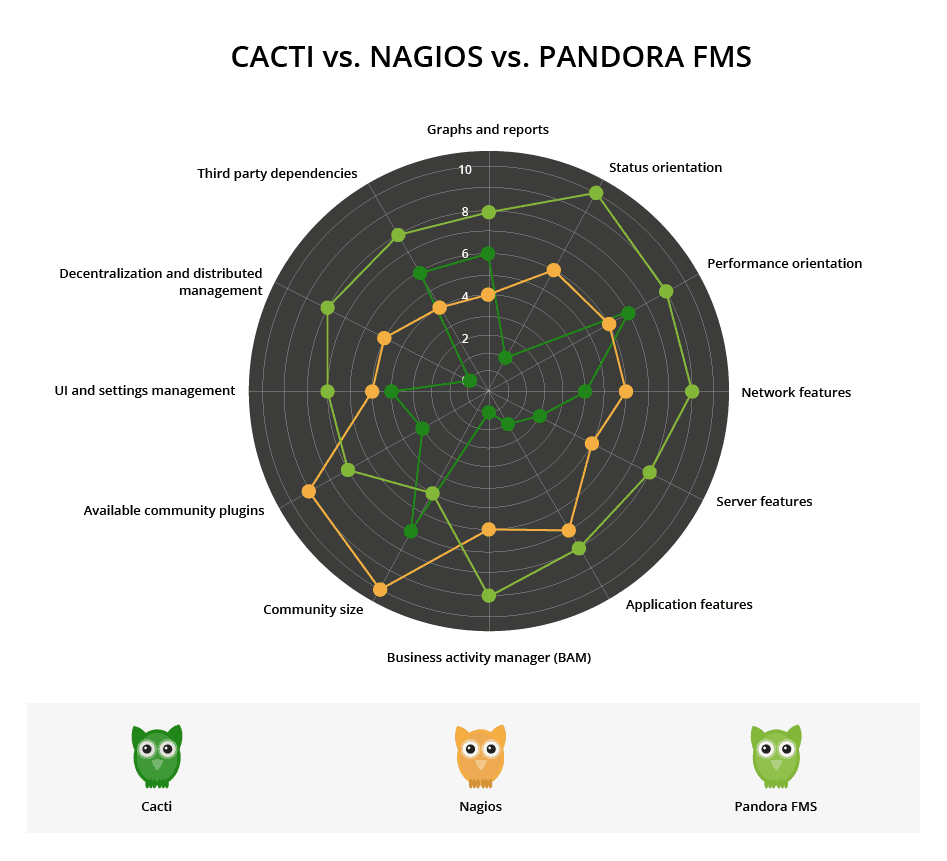
Cacti, Nagios and Pandora FMS are three monitoring applications with three different approaches: Cacti is focused on graphics, Nagios on status and Pandora FMS covers both, among other functions. If you are familiar with RRDTool or MRTG, Cacti expands on that philosophy: for example, if you have a data source, you can create a graph with that data. If you have various data sources, you can combine them. Cacti started out with that philosophy and has evolved from there: creating graphs from data, which, it must be said, it does very well, as can be seen in the graphs below.
Traditionally, Cacti was used to create graphics, and Nagios to manage status and create alerts. Which is not to say that Cacti cannot create alerts, nor that Nagios has no graphical capabilities, but in both cases these are add-ons. Pandora FMS, meanwhile, was conceived and designed to execute both functions.
In this article we’re going to take a look at some different monitoring tools, make some comparisons and put them to the test in order to help our community on this blog take the decision of installing a monitoring tool on their own system.
Cacti vs Nagios vs Pandora FMS: The global picture
Data Storage and Management
Cacti uses RRDTool to manage data, storing the information as numerical data in temporal series. However, it is not designed to work as a conventional database, which limits its use outside of its graphics capabilities, and impedes comparison of data from different sources, a drawback not experienced with Pandora FMS, nor with Nagios, provided it has the relevant add-ons.
This is not to say Cacti does not use a relational database, only that it uses it to save information related to graphics and reports, among other functions, but not to store or process the graphic information it generates.
Cacti, Nagios and Pandora FMS: Network Monitoring
Cacti developed out of MRTG (Multi-Router Traffic Graphing), in order to measure router traffic via SNMP (Simple Network Management Protocol) and was later expanded to measure any information transmitted through an SNMP interface, and ultimately, any information that returns numeric data (network traffic, lost packets, CPU process time on a server, and so on).
Monitoring a network is more than measuring broadband consumption, counting lost packets, or measuring network latency. Fundamentally, we are checking for pings.
Moreover, self-discovery, system detection and topological mapping are common requirements for any network monitoring software, primarily at L2 (data link level). Furthermore, in sizeable environments, it is necessary to receive status and performance reports via asynchronous monitoring based on receiving SNMP traps, and to generate network traffic statistics working with NetFlow to visualize consumption in real time, with information proceeding from routers, and according to user-generated filters.
Cacti is only able to perform a reduced portion of these functions, due to a lack of capacity to detect a network link collapse, or to explore a network, and much less to create a network map. Nor can it receive traps or work with NetFlow.
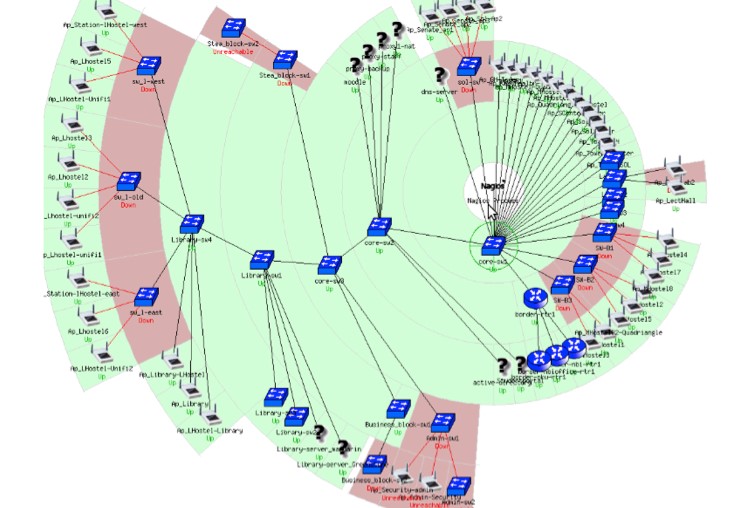
Regarding Nagios; its initial function was to detect if a host was down, and little by little additions were introduced, although it is far from providing all the functions which a complete network monitoring system requires. Traps management is basic, and mapping is not customizable, and only works at network level. Furthermore, measuring information through graphs is only possible via third-party plugins. Nagios, however, unlike Cacti, is compatible with NetFlow.
Pandora FMS covers all these functions, and is particularly effective in the area of network discovery and mapping levels 2 and 3. The traps management system is similar to that of CA Spectrum or BMC Patrol, and is able to process dynamic variables in traps with various bindings, generating visual data modules, and alerts or events from single specific values in a trap variable. Furthermore, Pandora FMS can generate graphics of traffic consumption in an SNMP interface, monitor latency, service availability, etc.
Do you want to discover the most flexible monitoring software on the market?
Pandora FMS Enterprise is capable of monitoring devices, servers, applications, services or business processes. What are you waiting for to get to know it better?
Nagios
Pandora FMS

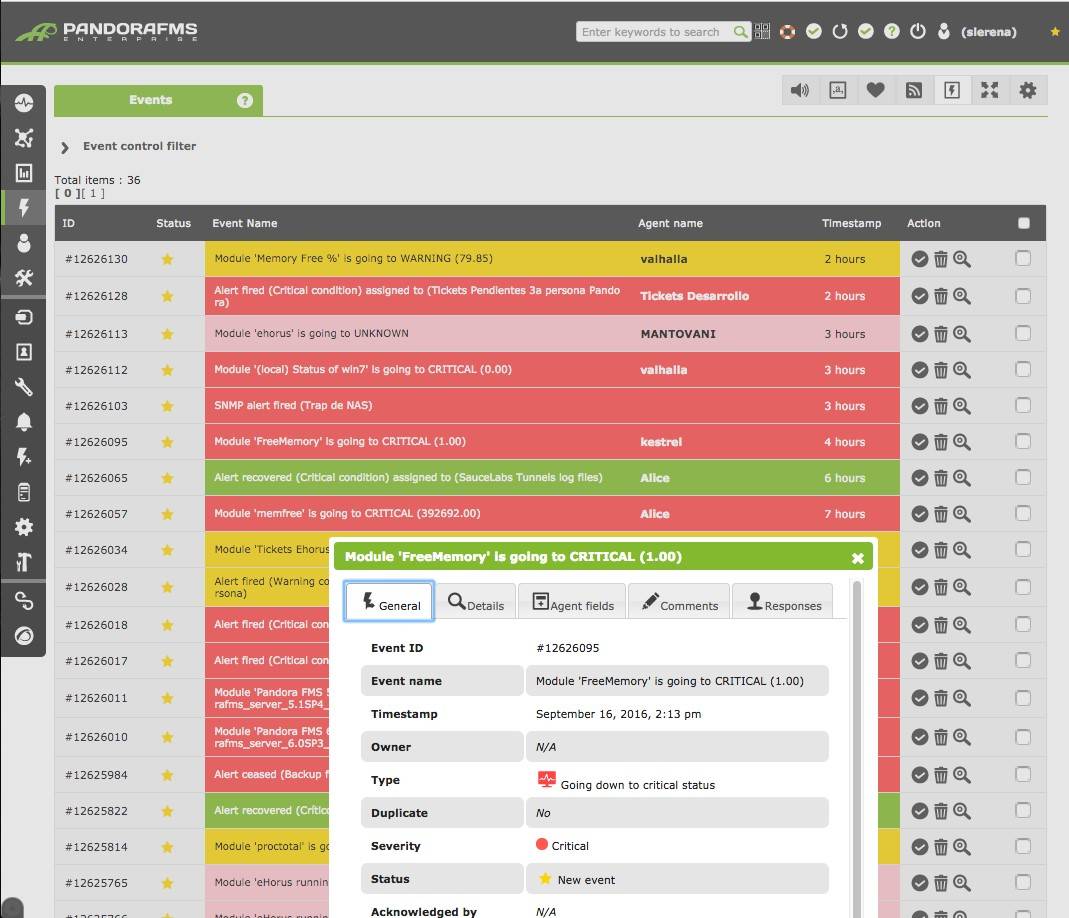
Cacti vs. Nagios vs. Pandora FMS regarding Event Management
Or the monitoring of all events throughout an IT infrastructure, and the keeping of a record of events and incidents as they occur, are resolved or remain pending.
If a monitoring tool detects an incident this triggers an event, and another event is triggered when the incident is corrected. An event is also triggered when the system detects new elements, or in case of an alert, or in the case of reconfiguration. Event management therefore serves as the initial point of investigation as to why an incident has occurred, and also provides a history of the incident.
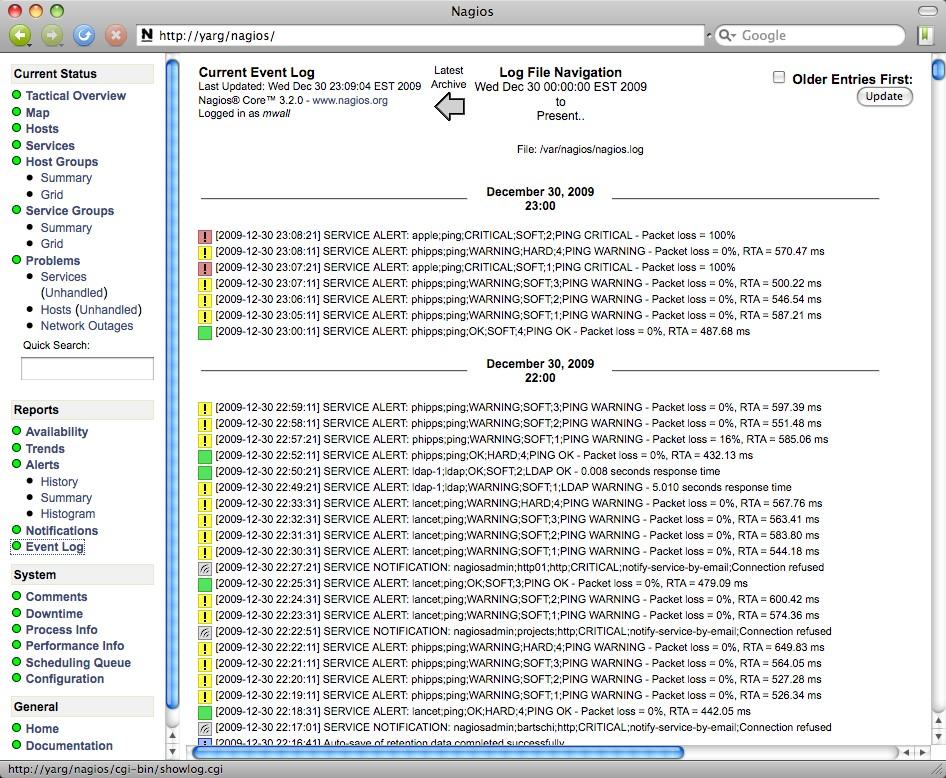
This technology is standard in the business world, where software programs such as HP OpenView, IBM Tivoli, BMC Patrol o CA Spectrum, Pandora FMS and ZenOSS are all used for event management. However, neither Nagios or Cacti can perform all of these functions, despite Nagios having incorporated an event history function, as this function cannot provide a full monitoring service, being merely a record of the event, without the correlation, auto-validating or monitor streaming capabilities of the above mentioned software.
Nagios
Pandora FMS
Decentralization and Management Distribution
Both Pandora FMS and Nagios have the problem of having to obtain information from networks which are inaccessible to the main server. Nagios gets around this through its agent catalog, while Pandora FMS features a server specifically designed to function independently, to monitor, explore and detect high performance networks (more than 50,000 devices running through each autonomous server. Furthermore, Pandora FMS features specific tools for distributed network environments, such as Export Server, Metaconsola and backup servers. As for Nagios, it can be installed distributed network environments, although it requires multiple third-party tools to make this possible. Unfortunately, despite the number of plugins available, the catalog is badly maintained due to its open source nature and not having a company dedicated to maintaining or managing the extensive library of plugins.
Plugins and out-of-the-box monitoring
As mentioned, Nagios requires numerous plugins to offer a complete range of services, as does Cacti, with a much smaller catalog of plugins and extensions available, making it incompatible with standard business software such as Oracle, Exchange, Active Directory, Informix, SAP and others. Pandora FMS’s plugin library is much smaller than that of Nagios (fewer than 500), but it has the great advantage of having a company behind it to provide maintenance and management. Despite some of the third-party offers not being free, they are focused on providing real-world solutions to daily situations. The open version of Pandora FMS comes with a collection of ready-to-use plugins and modules, for basic tasks, whether with agents or for remote diagnostics. It also incorporates an SNMP explorer and various wizard SNMP and WMI to remotely monitor network teams and servers.
Cacti has an ingenious system of templates which allows it to reuse the definition of a type of source and use it massively, which simplifies its deployment in similar environments, although its usefulness is limited to the kind of homogenous environment we already know.
Network monitoring with Nagios implies having to get used to struggling with hundreds of personalized scripts, which, when completed, someone else will transform into black magic. Its very complicated to work with collaboratively, resulting in Nagios being an unwieldy combination of software and custom development.
To get the most out of Nagios, between four and five add-ons are required (check_mk, HighCharts, OMD, NRPE, NSCA, ndoutils, thruk, nagvis), plus other complex projects, such as puppet, and thousands of lines of one’s own script, in order to manage configurations. All of which makes Pandora FMS a much more independent solution.
User Community
Nagios: the first one on the scene, and with the largest community, with an almost infinite number of forks: OpsView, Op5, Centreon, Icinga, Naemon, Shinken. The community is inevitably a little chaotic when it comes to implementing plugins, and P2P tool-sharing. Each offshoot of Nagios has a different focus, which, over time, has led to issues of incompatibility among the different branches and with the original project.
Cacti has a forum, and a repository of plugins and extensions which cover the majority of the functions not included in the original software and which are maintained and updated by the users themselves. It is a widely-used system, with a variety of device templates related to network equipment.
Finally, the Pandora user community is small but compact. At least a third of the modules library is generated and maintained by the community itself, and there are forums that are continually growing. Furthermore, Pandora FMS has a community of business-users whose requests to improve specific aspects of the software, contribute to its development and improvement, and to its application in many different areas of enterprise.
Management and Configuration
One of Cacti’s notable features, when considered from a professional perspective, is the absence of group profiling, which makes it inappropriate for working with operators, clients and managers. User role management is straightforward, consisting of assigning permission to each user, via resource graphic
The user profiling system of both Nagios and Pandora FMS is more powerful, allowing integration, in Pandora FMS’s case, of users in Active Directory, Ldap or SAML (Security Assertion Markup Language), reducing the number of functions of specific users, or even defining which parts of a node are accessible to a user (all functions unavailable on Nagios).
Management on Cacti is achieved via creating data sources, based on scripts, and/or SNMP, graph management, user generation and little else. Most of the low-level work performed using Cacti is done at the keyboard, editing files of text.
There is a seemingly infinite number of plugins available for Nagios dedicated to improving aspects of its management, many of them with proprietary interfaces and even their own licensing systems, which tends to make managing Nagios something akin to trying to interpret an ever-changing collage in real time. Confusing, to say the least. Not to mention that Nagios generally requires extensive personalization from the shell, editing file configurations.
Furthermore, Nagios, and various recent forks, including Naemon, still use CGIs written in C, which isn’t necessarily bad, but it does makeit complicated to expand on it, or to make improvements. Even the most basic change requires patching and manual compiling, and bear in mind that the Nagios ecosystem is a hodge-podge of patches on each different fork, and every time you want to reconfigure it you have to restart.
Pandora FMS, on the other hand, is completely homogenous and coherent in this aspect. Plugins, extensions and third-party tech are seamlessly mounted in the interface. 99% of management is done via the WEB console, without ever having to touch a file or the shell.
Dashboards
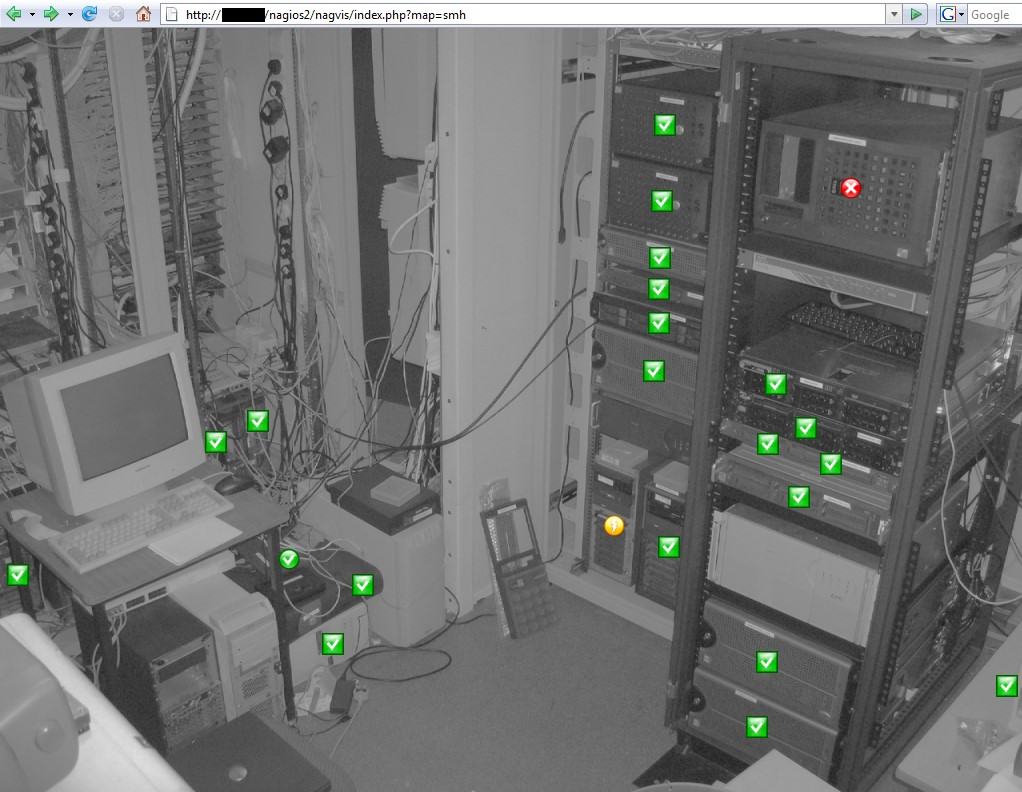
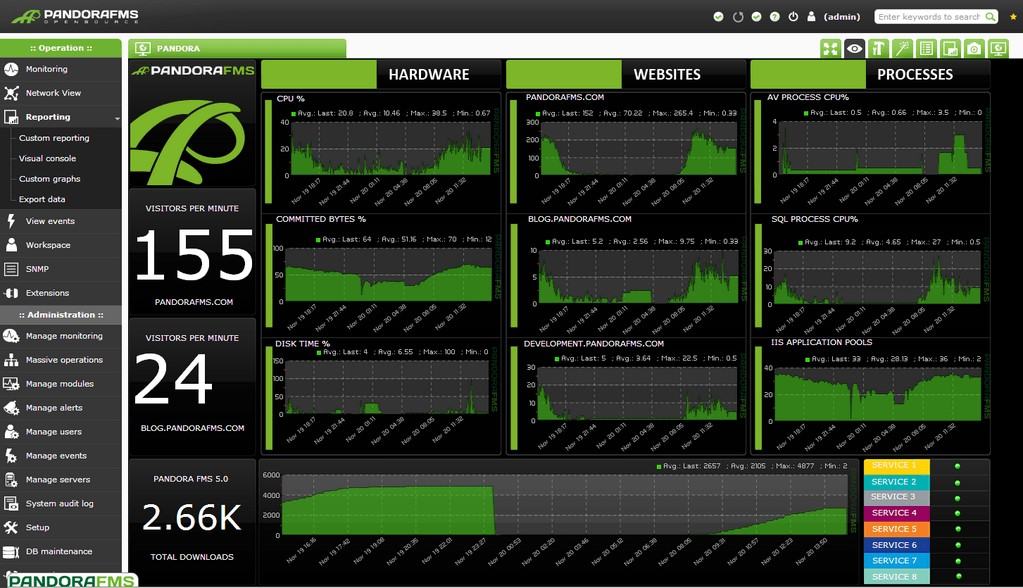
While basically absent in Cacti, Pandora FMS and Nagios both entertain the concept of a customizable dashboard, which in Nagios is possible with the nagvis plugin. In Pandora the same plugin comes as standard, and it could be said that it is the software which provides the best results.
Nagios
Pandora FMS
Cacti
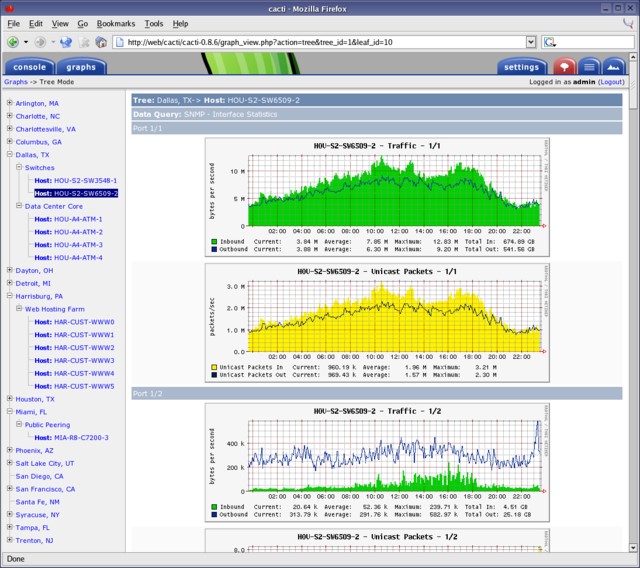
These kinds of screens are not available on Cacti, although there are extensions that permit visualization of graphs in grids and charts, but can’t show status or values, very far removed from what one can achieve with Nagios or Pandora FMS.
Reports
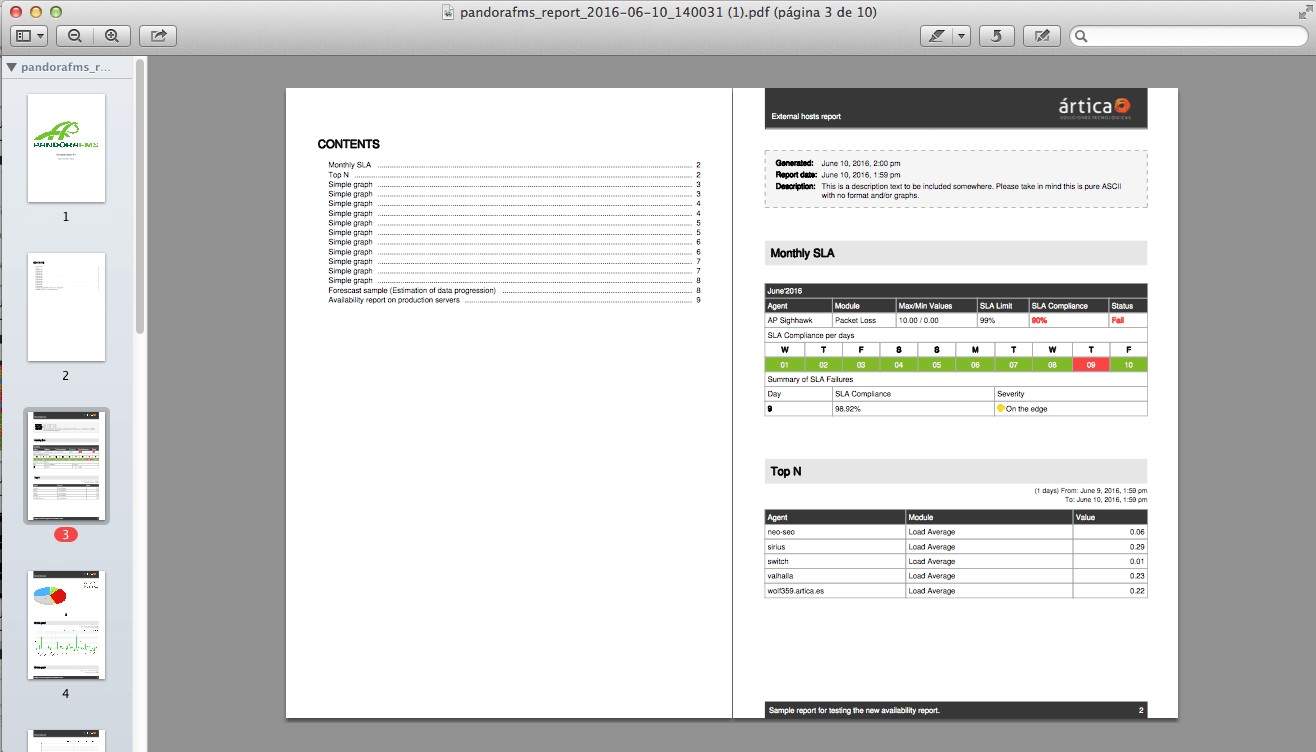
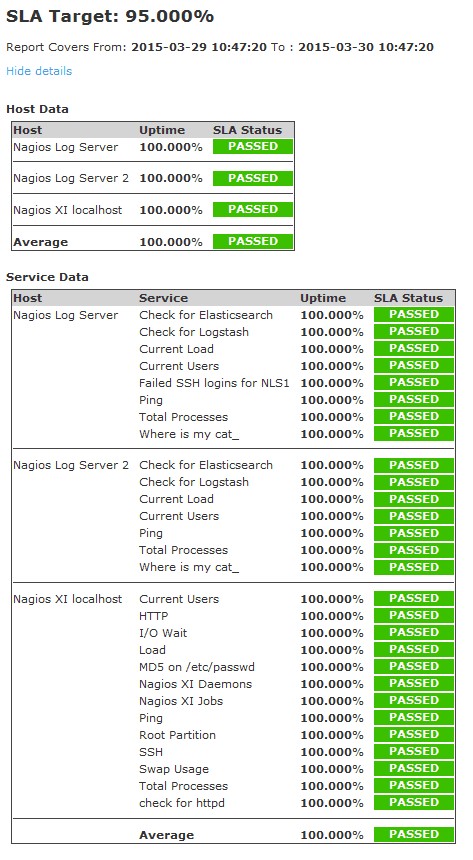
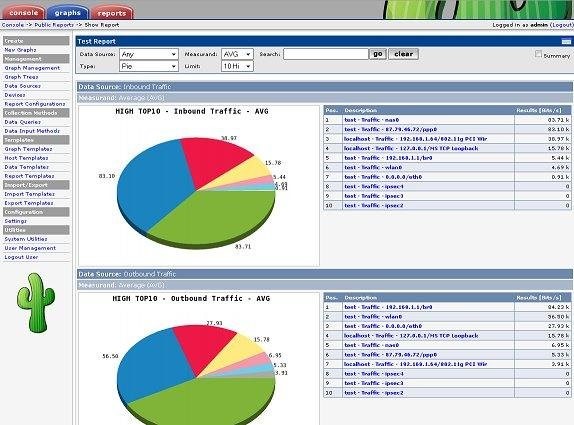
The standard of reports which Nagios is capable of generating is quite low, while Cacti doesn’t even feature any kind of report function: the most it can do are stacked graphs. However, a few plugins are available which perform similar functions to the report software available on Nagios. Keep in mind that, unlike Pandora FMS, neither Nagios or Cacti operate under the philosophy that a report is a highly polished end product, something fit to be presented to a senior manager, an executive or a client. Even the opensource version of Pandora FMS comes with a powerful report generator , which allows customizable report creation, light years removed from the capabilities of Nagios or Cacti.
Pandora FMS
Nagios
Cacti with report plugin
Agent Software: Server Monitoring / APM
Some may believe that monitoring software based on agents is out of date, it remains true that powerful players, such as CA, HP or IBM sometimes cover up their remote technologies, passing them off as 100% agent-free, when really, what they are doing is making a copy of an agent, executing it, and later deleting it.
For many monitoring tasks, it’s still necessary to have an agent in the machine. Nagios has quite a few (NRPE, NCPA, NRDP, and others), which, like almost everything on the program, require a bit of DIY, and, in many cases, are out of date and poorly maintained. The use of different agents within the same program is consistent with the Nagios philosophy.
Cacti doesn’t feature agents or anything like it (as is the case with ZenOSS), while Pandora FMS has far and away the most powerful agents of any of the software under consideration here. If we make a technical comparison of the quantity and the quality of the functions of Nagios and Pandora FMS agents, we can see that it’s the latter which features the most complex functionalities integrated within the agent, such as collection of events in its native form, (using a fully compatible and speedy API derived from Windows NT4, totally distinct from WMI methods), inventory collection, watchdog services and processes, collection IRT of process and service incidents, native WMI user-interfacing, agent-integrated networks diagnostics, and many others that can’t be implemented via scripts or commands, as this implies that the agent works at a low level, rather than at user level.
Not being able to rely on agents limits server/application monitoring (both of performance and status management), being as they only use SNMP (remotely) and WMI, as a plugin.
The power of Pandora FMS’s agents allows them to execute auto-validation tasks, removing elements dynamically- depending on which host they are deployed in- generating information depending on the specific host system configuration, avoiding generic metrics, and compiling the most relevant information according to the circumstances.
Scalability
As the creators of Cacti say on the first page of their website, the software is intuitive, features many systems as standard and is suitable for LANs, and other networks connecting hundreds of devices.
All of which is to say that, what it does, it does very well, but it is not designed for networks of thousands of connected devices.
While it’s true that there are many well-known cases of Nagios being installed on dozens of nodes, it’s also fair to point out that there are no documented examples of clients with over 15,000 nodes featured on the Nagios website. Although Pandora FMS presents similar numbers, under laboratory conditions it has monitored up to 500,000 nodes. However, in real-world conditions, the most successful examples have been with clients with 15,000 nodes. Suffice to say that Nagios and Pandora FMS are leagues ahead of Cacti in this area.
Conclusions Nagios vs Cacti vs Pandora fms comparison
By now it should be clear where we stand (especially so, considering that this is a Pandora FMS blog!), although it must be said that we have been objective in our evaluations, testing the different under laboratory conditions and seeking always to be impartial in our considerations.
Hopefully this article will have been of use to anyone considering installing a monitoring software on their system.
Remember that if you have to monitor more than 100 devices you can enjoy a 30 days FREE DEMO of Pandora FMS Enterprise. Get it here.
Pandora FMS’s editorial team is made up of a group of writers and IT professionals with one thing in common: their passion for computer system monitoring. Pandora FMS’s editorial team is made up of a group of writers and IT professionals with one thing in common: their passion for computer system monitoring.


