Unicast Flooding Traffic: root cause and monitoring
Unicast Flooding Traffic is associated with the learning process of network switches.
In fact, with this method, switches identify the MAC addresses of the devices that are accessible by each of their ports, thus constructing a table that will then be used to decide the destination of each frame that arrives at the switch.
However, this type of traffic can also present a perverse side, in which we will be dealing with an excessive amount of Unicast frames that without justification are transmitted through all the ports of the switch.
There is a consensus that Unicast flooding periods can range from low performance to complete network failure.
And although we do not find statistical data that allow us to estimate the prevalence of Unicast Flooding Traffic problems, it is true that, constantly, we observe in the technical forums many network administrators looking for information on the subject.
It is also important to mention that network device manufacturers, such as Cisco, have developed procedures and commands to try to contain the negative effect of this type of traffic. Although the issues of diagnosis and monitoring have not been addressed so forcefully.
Now, what symptoms can lead us to think that we could have a problem associated with Unicast Flooding Traffic?
Symptoms
A Unicast Flooding Traffic problem in an acute phase can lead to an increase in the amount of traffic over a VLAN, an increase in the number of lost packets, an increase in the latency of the affected services and, as we said, it can degenerate into a complete network failure.
On the other hand, the negative effect that this condition could have when it does not reflect too alarming symptoms and the network “gets used to them”, that is to say, there is excess traffic, there is a degradation of performance and the associated support cases are closed without reaching the root cause.
In our experience, those cases of “recurring” support, which do not close satisfactorily and are opened by users who report slowness or impossibility in accessing network resources, may actually be a symptom that leads us to suspect the presence of Unicast Flooding Traffic on the platform.
Do you want to know more about network monitoring?
Remote networks, unified monitoring, intelligent thresholds… discover network monitoring in Pandora FMS Enterprise version.
I think I have Unicast Flooding Traffic. Now what?
There are three elements that make it difficult to fight Unicast Flooding Traffic. The first is that this condition is difficult to pinpoint.
Support analysts can visualize the Unicast Flooding condition if they have the opportunity to evaluate with a traffic analyser the Broadcast packets of the segment and they can observe Unicast traffic, where they should only see Broadcast or Multicast packets.
Here is the second element; this condition, depending on its root cause, may be temporary. Therefore, we can have a flood of Unicast traffic for a variable period of time and it can disappear without any intervention.
This complicates the visualization, since you must have the opportunity to analyse the right traffic, the right segment, at the right time, which in a large platform can be very complicated and costly in terms of resources.
The third point is that there are many conditions that can generate flooding, which complicates its visualization, analysis and decision-making.
Possible Causes vs. Root Cause
There are many conditions documented as generating Unicast Flooding Traffic; from changes in the topology that could patent failures in network design and switch configuration to malicious attacks that promote flooding, passing through different technical conditions, such as the dreaded Asymmetric Routing.
However, all of these conditions are based on how names and addresses are resolved in a switch-based network schema.
The name resolution scheme supports communications since device A wishes to contact and transfer information to another device B, for which the IP address is required at the network level and the MAC address of that device at the data link level.
There are many protocols and procedures involved in this name resolution scheme, but as for Unicast Flooding Traffic we must stop at two elements that participate in the scheme and are managed by the switches: the ARP table and the MAC address table.
Device A can obtain the IP address of device B in the ARP table, where the records have a dwell time, generically called arp aging time, whose value can be 4 hours, for example.
In the absence of the registry, a series of three Broadcasts messages will be broadcast consecutively in search of the address in question. If the reader is interested in finding out more about Broadcast packages and their negative effect, we recommend reading this article, published in this blog.
Having the IP address defined then requires, at the level of data link, the MAC address, for which the table of MAC addresses is used, whose records also have a permanence time that we can refer to as mac address table aging time, whose default value can be 5 minutes. If there is no proper registry, the switch understands that it must try to learn where this address is and generates Unicast Flooding traffic.
The capabilities and current situation of each table, as well as the inequality in the permanence times of the records and the way in which the protocols use these records, is the basis for most of the conditions that generate Unicast Flooding Traffic:
- Topology changes can lead to table inconsistencies or table overflows.
- Malicious codes use table overflow as a tool.
- Asymmetric routing can be generated by multiple links between two VLANs, and by the difference in dwell times between the arp and MAC address tables.
This is why our recommendation is that, before studying the specific conditions of each situation, and of course before taking administrative decisions such as blocking Unicast traffic in one or more ports or for an entire VLAN, so you need to:
- Investigate and understand well how the name resolution scheme works on the switch-based platform, considering the brands and models of switches available.
- Review the ARP and MAC address tables, as well as the display and modification commands associated with them.
This will offer us a working capacity with which we can try to solve the specific conditions of Unicast Flooding Traffic generation, when they arise. The issue of monitoring then remains unresolved.
A first approach to monitoring
A first approach to the task of monitoring the conditions that can generate Unicast Flooding Traffic can start from evaluating the behaviour of the MAC address table.
We can use Pandora FMS to obtain the information of the switches, automate the revision that initially we could do in a manual way and then use the information and all the visualization facilities to facilitate our analysis.
We could then follow these steps:
Display network topology:
The idea at this point is to get a map that allows:
- To identify the switches that make up the platform (with variables such as name, brand, model and number of ports).
- To identify managed and unmanaged switches, as well as those that operate at the network layer and those that operate only at the data link layer.
- To identify the ports that interconnect switches and the configuration scheme of those ports (simple links or defined as trunks or others).
- Establish the distribution of the devices of each VLAN in the switches.
Therefore, we will use the facilities that Pandora FMS offers in the Network Maps theme. Bear in mind that Pandora FMS maps can be automatically generated, but they also allow us to establish the information that we want to be present in the map, in order to achieve a topology map, both physical and logical, that is especially useful for the case we are dealing with.
Once the map is developed, perhaps we can make it visible from the dashboard of those responsible for monitoring the network, being unnecessary for the group of people more oriented to the administration of applications, for example. For it, we will use Pandora FMS facilities that allow us to define customized dashboards for each user.
Evaluate the MAC address table:
Let’s say, for example, that we want to evaluate the number of records used and available in the MAC address tables of all or a selected group of our network switches, so as to identify whether there is an overflow condition at any time or fluctuations too wide to be investigated.
To automate the revision of the tables let’s consider as an example the following commands, extracted from Cisco switches that allow to evaluate the current situation of the MAC address tables:
- show mac address-table
It displays in a general way the MAC addresses that are accessible by each port and to which VLANs these addresses belong. - show mac address-table aging time
It displays information about the length of time records remain in the table. - show mac address-table count
It displays the capacity in terms of the number of records contained in the table. It also shows the number of available records.
Note that the application of these commands involves connecting to the switches via SSH, presenting credentials, and executing the command as such.
We could then automate the application of the command show mac address-table count in intervals lower than the mac address aging time, using for it the facilities provided by Pandora FMS for the automation of this type of evaluations, or the monitoring based on SNMP if in the MIB of the switch in question the required variables appeared.
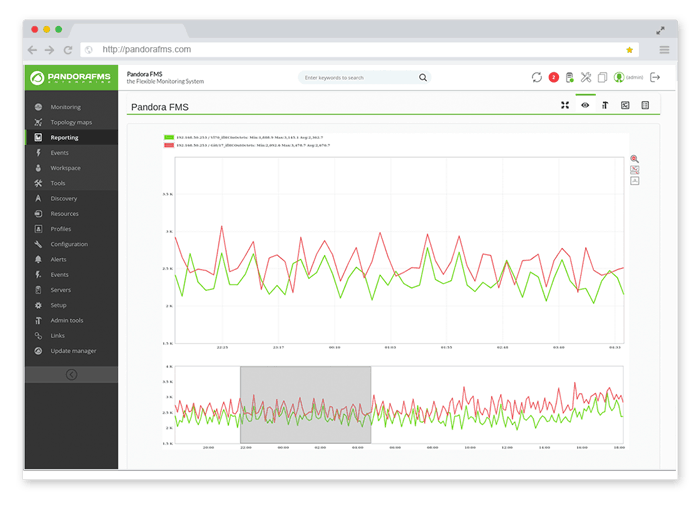
Then, this information of each switch will be registered in a file or graph that later we will be able to evaluate; identifying if it changes with the time and if some table arrives to experience an overflow. Here we could evaluate the need to generate an alarm about this condition.
We could also cross these data with those provided by Pandora FMS monitoring scheme on performance indicators that we already measure in our platform, and try to relate behaviour identified in the MAC address table with unacceptable fluctuations of indicators, such as latency in a service or application, for example.
From here we could continue working on the analysis of this type of traffic, depending on the existence of it in our platform and its effects on global performance.
Finally, we hope that this first approach to the monitoring of such an evasive condition, as Unicast Traffic Flooding will motivate you to consider Pandora FMS based monitoring as the tool to monitor this and other error conditions.
Of course, we invite you to share your experiences with Unicast Traffic Flooding and to request information about the network monitoring capabilities provided by Pandora FMS by clicking here: https://pandorafms.com/network-monitoring/


