Monitoring Zimbra: with this tutorial you’ll find it quite easy to do
1. Context
1.1. What is Zimbra?
Loyal to our style, let’s get started by having a look at what Zimbra is. Zimbra is a product from Synacor, which offer us a fairly complete collaborative platform, which includes email, file exchange, calendar, chat and video chat, as well as empowering around 500 million email inboxes. Additionally, it’s worth mentioning that Zimbra Collaboration was built on an easy to implement platform with a great messaging and collaboration system.
Zimbra is likely to be implemented within the installations, in the cloud or, if you prefer, as a hybrid solution and even as a hosted service throughout any of the commercial solutions of Zimbra or services offered by Synacor. Zimbra’s solutions provide to their users the control of the physical locations in which their own collab’s information is allocated.
Apropos this last aspect, we could blame it on the growing interest in the location of the data by governmental authorities (or state authorities to be more all-inclusive) and also by the industries who are being meticulously regulated, as it is the case of medical organizations or financial companies.
A ‘file manager case’ it’s included in Zimbra Collaboration Server, which allows the user to:
- Save attached files
- Sharing files with other users
- Load documents
1.2. Other important features of Zimbra Collaboration:
Zimbra Collaboration Server includes Zimbra Mobile which offers to their clients Microsoft Exchange and ActiveSync. The information is always available, without the need of installing any clients, neither middleware applications. To make it clear: it consists of a complete communication solution which allows the clients to send (and receive) emails, to add and to edit contacts in Zimbra Mobile’s address book, using a global list of addresses or ‘GAL’, or create dates and meetings, as well as managing the tasks list.
Another relevant feature from Zimbra is that Zimlets and API give the clients the possibility to download and integrate new functionalities with the aim to customize Zimbra’s experience and, therefore, widen its performance. Zimlets, in particular, include integration with Salesforce.com and Webex.

Let’s have a look at another important characteristic: Zimbra Collaboration offers Zimbra Talk, which provides the users with collab text, voice, and video capabilities, integrated with the user’s interface of Zimbra. Regarding all this, we could say that all Zimbra’s functionality (except Zimbra Suite Plus and Zimbra Talk) are included in the principal product. Thanks to this, the clients don’t have the need to constantly buy additional products.
2. How to monitor Zimbra Collaboration Server?
To understand how to monitor this well-stocked and practical server, we have to consider the following:
2.1. Statistics and server’s status
To capture and show the statistics of the server, we count on Zimbra Logger package, which is useful for:
- Keeping control of the mailbox capacity.
- Tracking messages and creating night reports.
- Log files.
- Overseeing the MTA mail queue.
- Supervise, through an SNMP tool, the error selected messages with SNMP snapshots.
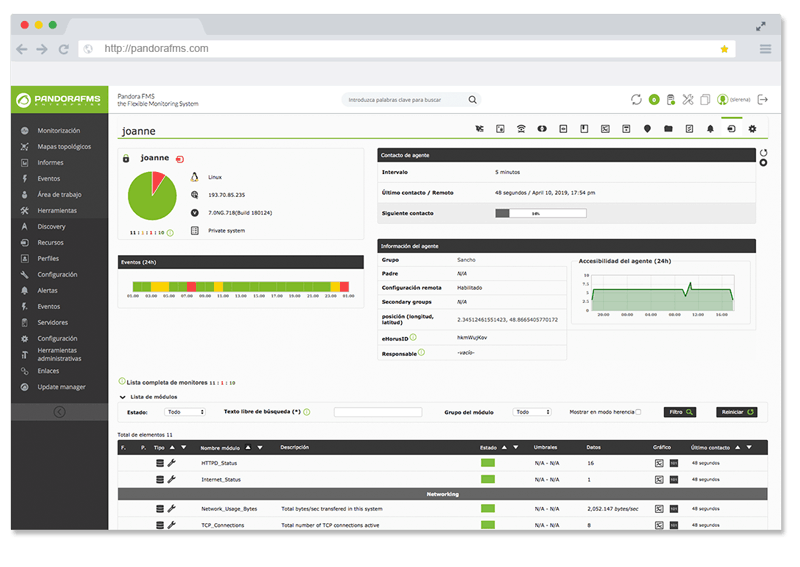
It’s worth mentioning, continuing with Zimbra Logger, that in the “Module Library” of Pandora FMS, we can find valuable information about Zimbra Collaboration, concerning specifically Zimbra Mail. Zimbra Logger has a useful and much needed set of tools aimed at the creation of reports and message tracking.
Despite the package Logger installation being optional, we recommend doing it. Otherwise, the status information of the server and its statistics won’t be able to be captured, as well as the message tracking won’t be available for us.
2.1.1. Environments with more than one server.
Logger is just enabled for one mailbox. Therefore, the host for the tool to monitor Zimbra is the one responsible for checking the status of each and every one of servers using Zimbra. Also, it’s in charge of displaying the information within the administration console of Zimbra. The information is updated every 10 minutes.
However, in an installation of several servers, we have to set the configuration files of syslog, in each server, so we can allow the logger to show us the statistics from the server in its respective console. In addition, it’s needed to enable the logger of the host. So, in case of not having this configuration set when Zimbra Collaboration Server was installed, we recommend doing it as soon as possible.
Do you want to know more about application monitoring?
Pandora FMS Enterprise is capable of monitoring the most popular applications and databases. Click here and find out…
2.1.2.The statistics of the server
We must keep in mind that, to enable the statistics, we have to write in each server (in its root directory) the following: /opt/zimbra/bin/zmsyslogsetup , which will give us the possibility for the server to show us the statistics. What’s more, to log the remote computers’ statistics in the host’s Logger display, we have to enable syslog.
To achieve this, we can edit the log file /etc/sysconfig/syslog, adding -r to the configuration of SYSLOGD_OPTIONS, like this: SYSLOGD_options = “-r -m 0” . Then, we have to disable the syslog daemon and write the following: /etc/init.d/syslogd stop . Next, we will get the syslog daemon started again by writing: /etc/init.d/syslogd start . It’s important to mention that all these steps are not necessary for the installation of just one node.
2.1.3. Server’s status check-up
The section called “Server Status” lists all the services and servers, along with its status and, really importantly, when was the last time the status was checked for the last time. To better understand this concept, we’ll say that the servers include the LDAP, the MTA, and the mailbox.
In addition, the services include LDAP, MTA, SNMP, inbox, anti-virus, anti-spam, logger, and orthography corrector. Now, when it comes to starting a server (in case that it’s not already running), we can use the following command: zmcontrol CLI. As well, we could initiate and stop services through the administration console of Zimbra, inside Servers and, more specifically, in the tab called “Services”.
2.1.4.The server’s performance statistics
Something really important to bear in mind when it comes to monitoring Zimbra is the fact that the section “Server Statistics” show us several bar graphs, in which we can see the volume of the messages, the count of them, the activity of the anti-virus and information related with the spam. This graphical information can be seen within the last 48 hours and in periods of 30, 60 and 365 days. To be more clear about this, here’s a more in detail explanation:
- The count of messages shows us the amount of these, both the received and the sent ones, every hour, every day.
- The volume of messages gives us the information about the size, in bytes, of both types of messages, in the same way, every hour, each day.
- The anti-virus and the anti-spam activity show the number of messages which were checked by Zimbra, in both the search of the anti-virus and the anti-spam, as well as the number of messages which were discarded as “spam” and the ones which were considered a threat.
- The drive shows us the use of our storage and, also, the available space for individual servers. We can sort this information by the last hour, day, month and year.
Important: the anti-virus and anti-spam activity graphs, in addition to the count of messages, they do different recounts for several reasons. One of these reasons is because the sent messages can’t go through the filter Amavisd as it quite is the case that the architecture of the system doesn’t require for them to be verified. Another reason is that the messages are sent and checked by Amavisd in search for viruses and spam before being delivered to all the recipients.
We have considered important to give a brief explanation of what Amavisd is. This open source tool consists of a filter of content for email, which also implements the email messaging transference to decode them, as well as interacting with the external content filters to give us protection against viruses, malware, and spam. We’ll also mention that it could be considered as an interface between an email software, as MTA, and one or more filters of content.
Remember when we said before that Zimbra also has services which include LDAP, MTA, SNMP, inbox, anti-virus,etc.? Right, we can use Amavisd additionally to detect banned content or to capture syntax errors within the email messages. You can also quarantine and then release or store messages in mailboxes or in a SQL database. The last version of Amavisd is 2.11.0, which was launched in April 2016.
2.1.5. Message tracking
It’s possible to track a message which has been received or sent during the last 30 days. Each email has a heading which shows us the route it has had, from its own origin up to its destination. This information is used to trace the route of the email when there’s an issue with it. In this case, Zimbra’s utility, zmmsgtrace , can be executed to look for emails, filling the following attributes:
- Message ID:
-i [msd_id] - Address of the sender (“From”):
-s [sender_addr] - Address of the recipient (“To”):
-r [rcpt_addr] - IP address from which was sent:
-f [ip_address] - Date and time:
-t aaaammdd (hhmmsss)
To finish with this subsection, we can sum this up by saying that the heading of the email in Zimbra we can see it through the display offered by the web client of Zimbra Collaboration, in which case we can right-click on a certain message to select “Show original”. In case the messages are being displayed through the “Conversation view”, first we’ll have to open the conversation to see the messages, and then we’ll select the message we want to read.
2.1.6.Creating daily mail reports
When we installed the package Logger, it’s set automatically, in crontab, a daily mail report which contains the following information:
- The total number of messages which were handled by Zimbra MTA.
- The errors from the logs of Zimbra MTA Postfix.
- The delay (in seconds) for the delivery of messages.
- Information regarding the size of the message, in total and average of bytes for each message.
- The amount of returned deliveries.
- The majority of the active recipients’ accounts and the number of sent messages.
- The majority of the active senders’ accounts and the number of messages.
PS: The report contains all the data which we’ve just listed is called every morning, at the same time it’s sent to the email of the administrator.
2.2. Monitoring mail queues
To monitor Zimbra when it comes to the supervision of mailbox queues we know that if we have any issues with the deliveries of the mails, we can check the queues of sent emails within the administration console. For this purpose, we have to access the section “Mail queues monitoring”, to analyze if we can solve those issues, keeping in mind that when we open the queues, the content shown belongs to the delayed, active, received, corrupt and “waiting” queues. Also, we can see the number of messages, their origin, and destination. Additionally, if you want to read a description of the types of queues, we suggest you check Zimbra’s site on monitoring mail queues.
2.3. Monitoring mail storage
We can access the information about the mail storage, for all the accounts, through the administration console and, more specifically, in Supervision > Server Statistics > Mail Storage. Inside this last tab we’ll see the following information for each account:
- Assigned mail storage.
- Used storage.
- Percentage of the assigned storage used.
Be careful: when the assigned storage is completely used, all the messages will be rejected. Therefore, the users will need to free some space (by deleting emails) in order to receive those emails. Another option is to increase the assigned storage for emails.
2.4.Log files
The processes related to Zimbra create files for the majority of the activities of Zimbra Collaboration Suite. It’s not needed to check most of the log files as the most relevant logs appear, as well, in many main log files, being the case, for example, of Zimbra’s syslog (which specifies the activities of Zimbra Collaboration Suite MTA), Logger, Authentication, and Directory.
3.Concluding
Monitoring Zimbra is a relatively easy task, as long as we follow the steps closely to the recommendations we have shown you in this clear and simple tutorial. For those in search to complete this information, we propose you to check Pandora FMS to find additional solutions.
Rodrigo Giraldo, freelance technical writer. Lawyer and astrobiology student, he is passionate about computers, reading and scientific research.


