How to use Pandora FMS from Microsoft Azure
In this article we will focus on our on-premise platform, or cloud monitoring after having installed Pandora FMS console in Microsoft Azure. The installation will be made with an automated script that installs the Community version and with a second script, it allows to update Pandora FMS to its Enterprise edition (Corporative), leaving a 30-day test version (Trial).
Requirements
In order to use Pandora FMS, it is necessary to meet the following requirements:
| Requirement | Settings |
| CentOS 8 Virtual Machine | 2 GB RAM, 40 Disk (minimum) |
| WEB Console (Firewall) | 443 TCP (https) |
| Tentacle Agents (Firewall) | 41121 TCP (Tentacle) |
| SSH management | 22 TCP (SSH) |
| SSL Certificate | Public Certificate |
| CNAME alias | To use your own domain |
Note: The script is only supported on CentOS 8
Pandora FMS running in Azure
Once Pandora FMS is installed in Azure, the functional diagram will be as follows:
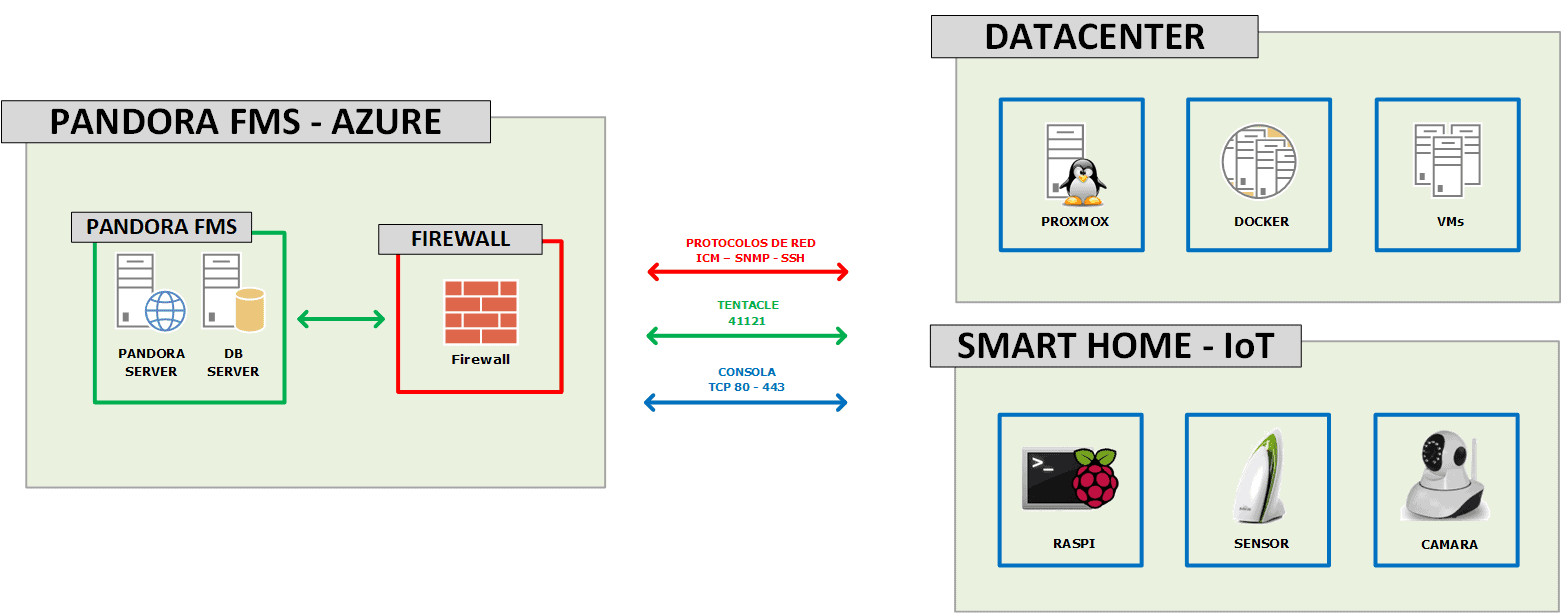
Functional Outline
Before continuing, let’s see some screenshots of a Pandora FMS console running in Microsoft Azure:
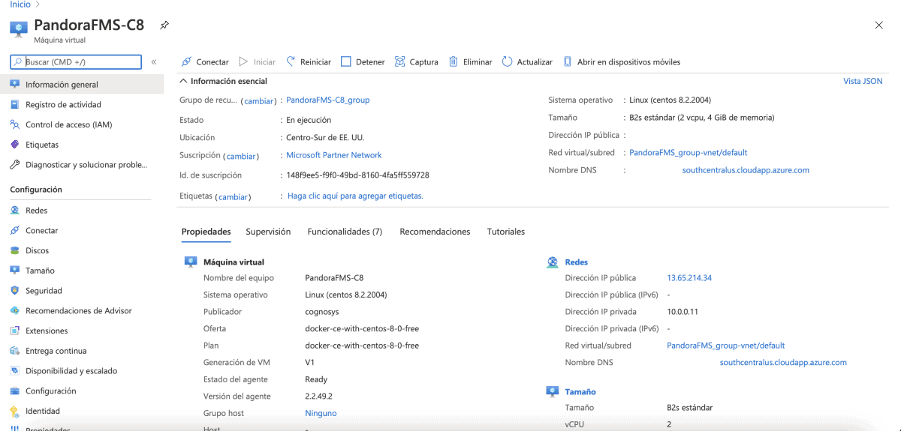
Virtual Machine

Settings -> Networks
Virtual Machine Creation
For the script to work properly, it is important to use a supported virtual machine for this process. To do that, go to Microsoft Azure console (https://portal.azure.com) and select the following:
Azure Services -> Create Resource

In the Marketplace, look for CentOS 8.2 and select the following image:
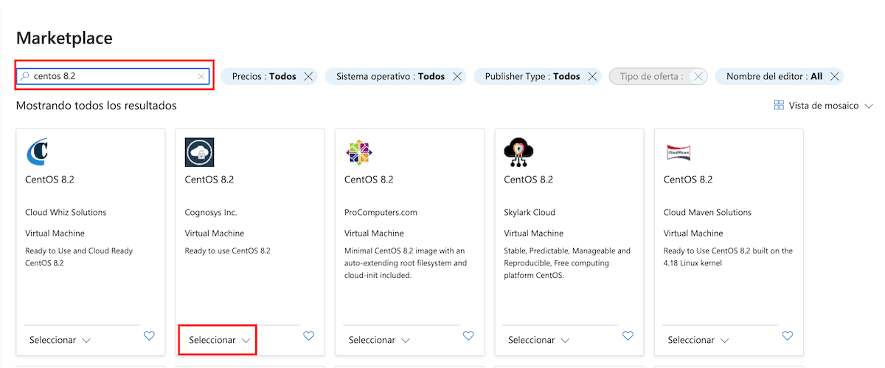
Note: The script works using this image. In case of using another, if the repositories are set up differently, the installation may fail.
The rest of the process can be seen in detail in this guide.
Why monitor from Azure (Cloud)
Technology evolves over time and as a result of this evolution, our way of implementing changes. Many customers already have part of their infrastructure in the cloud. Today there are many hybrid on-premise (data center) + Cloud environments and many companies have their mail in SAAS (Software as a Service) format, as it is the case with Google Apps and Office 365.
Bearing this in mind, is Pandora FMS ready to run in the Cloud? The answer is simple. Yes, Pandora FMS is capable of being executed from the Cloud without any kind of difficulty. Software agents send information using TCP port 41121 (Tentacle). That way, all modules created in the software agents, whether Windows or Linux, will be reflected in your Pandora FMS implementation
Pandora FMS running in Azure
After this short introduction, let’s see Pandora FMS running directly in Azure. As you could see from the functional outline, at the beginning of the article, I am monitoring my smart home from Azure. Let’s see the tactical view:
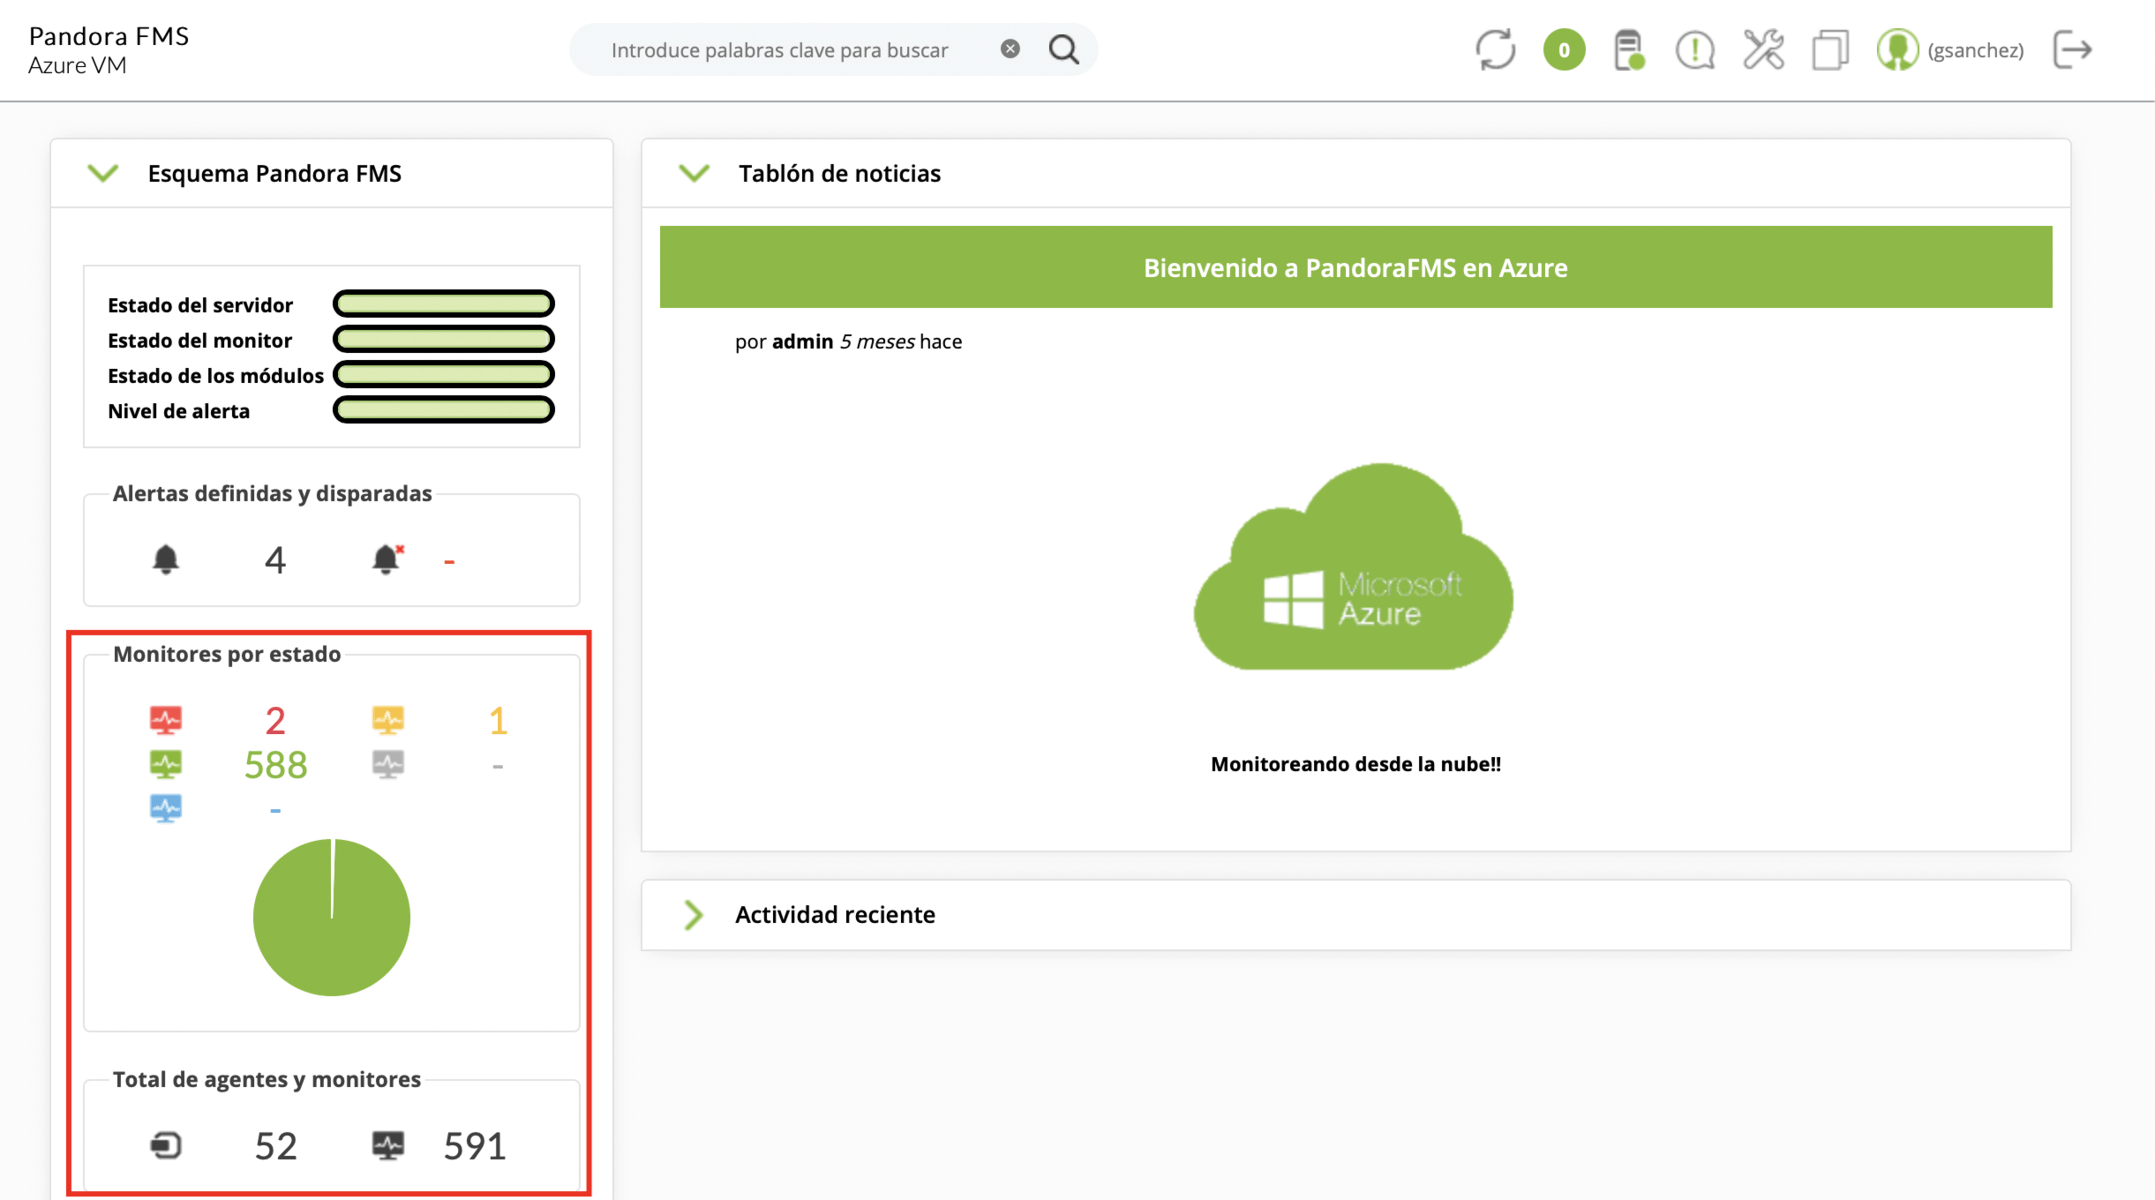
We can see in this case that 52 agents are being monitored, where there are 591 modules, 588 of them in Ok status (Green), 2 in Failure (Red) and 1 in Alert (Yellow). The tactical view is very useful to quickly find out the health status of your platform.
Another very interesting view in Pandora FMS is the group view:
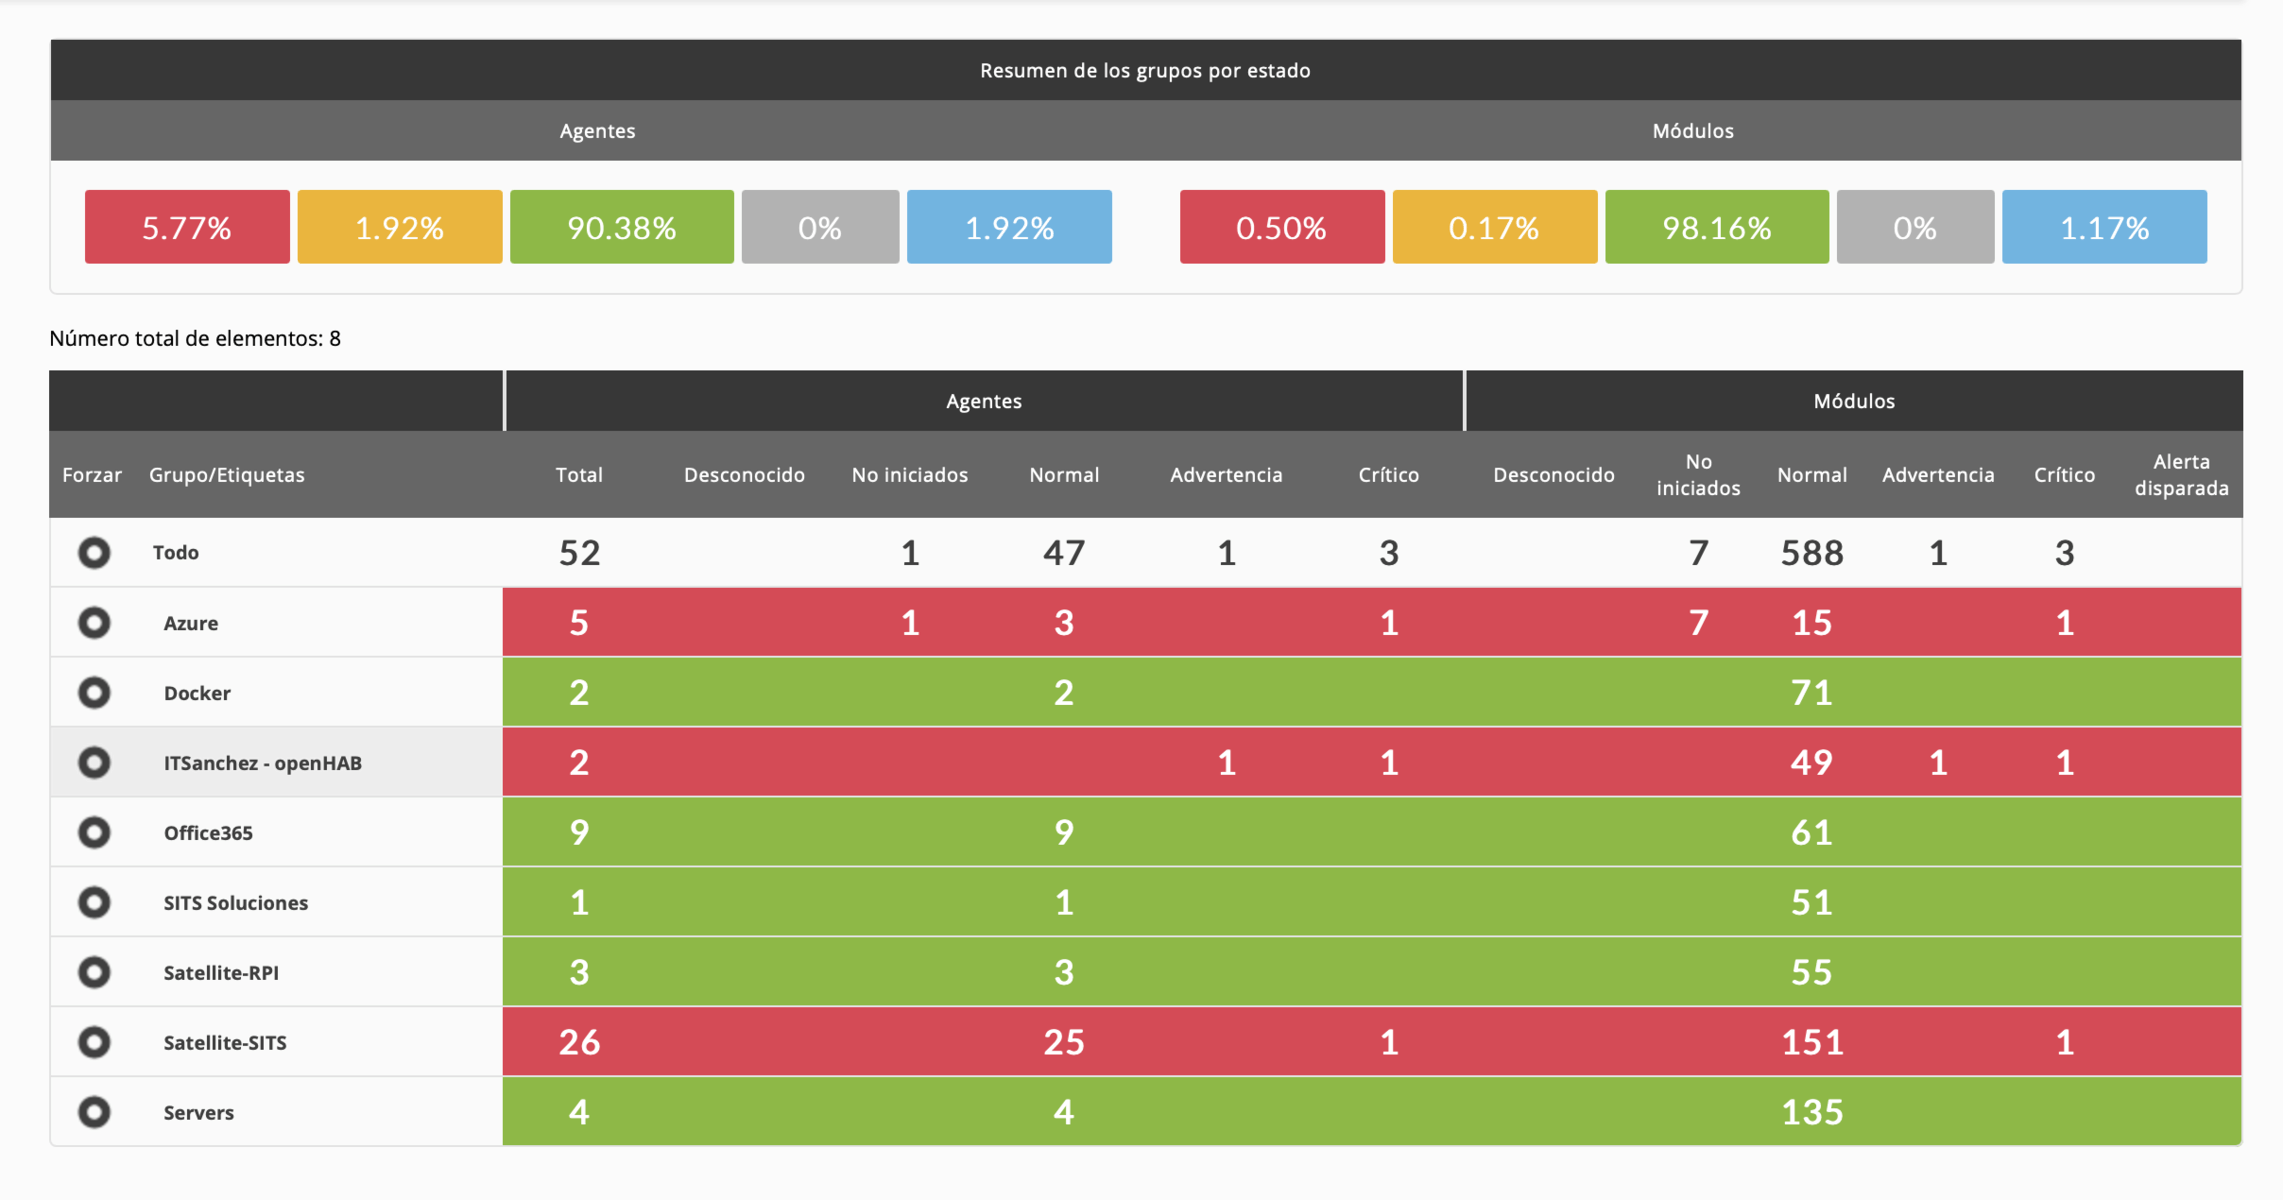
In this view we can group our agents to be able to organize in a simple way the technologies that are being monitored, the place where the agent is or any data that helps us quickly find the monitors that we are creating.
Useful features
Running any application from the Cloud brings new challenges, even if we have a hybrid infrastructure. Bearing in mind that it is a reality in many companies, we are going to focus on the advanced features that Pandora FMS has and that can help us work efficiently by having our solution running in Azure.
An extremely useful Pandora FMS feature is Discovery; one of the options is to perform a network sweep (scan) and sum all the ICMP, SNMP and WMI devices in a very easy way. This is very simple if the agents are on the same network as that of Pandora FMS server or if they have a network connection from another branch with a site-to-site tunnel for example. But all this does not happen having Pandora FMS in Azure; so what happens? Do we lose this feature?
The answer is very simple, we do not lose this feature, we can use it with a Satellite Server (only in Enterprise version).
It allows exploring and detecting new systems, monitoring remotely, executing remote plugins and allowing forwarding data files from the software agents to the main server, working as an agent proxy. It sends the monitoring data as XMLs through a Tentacle connection, so it does not require connection to the database.
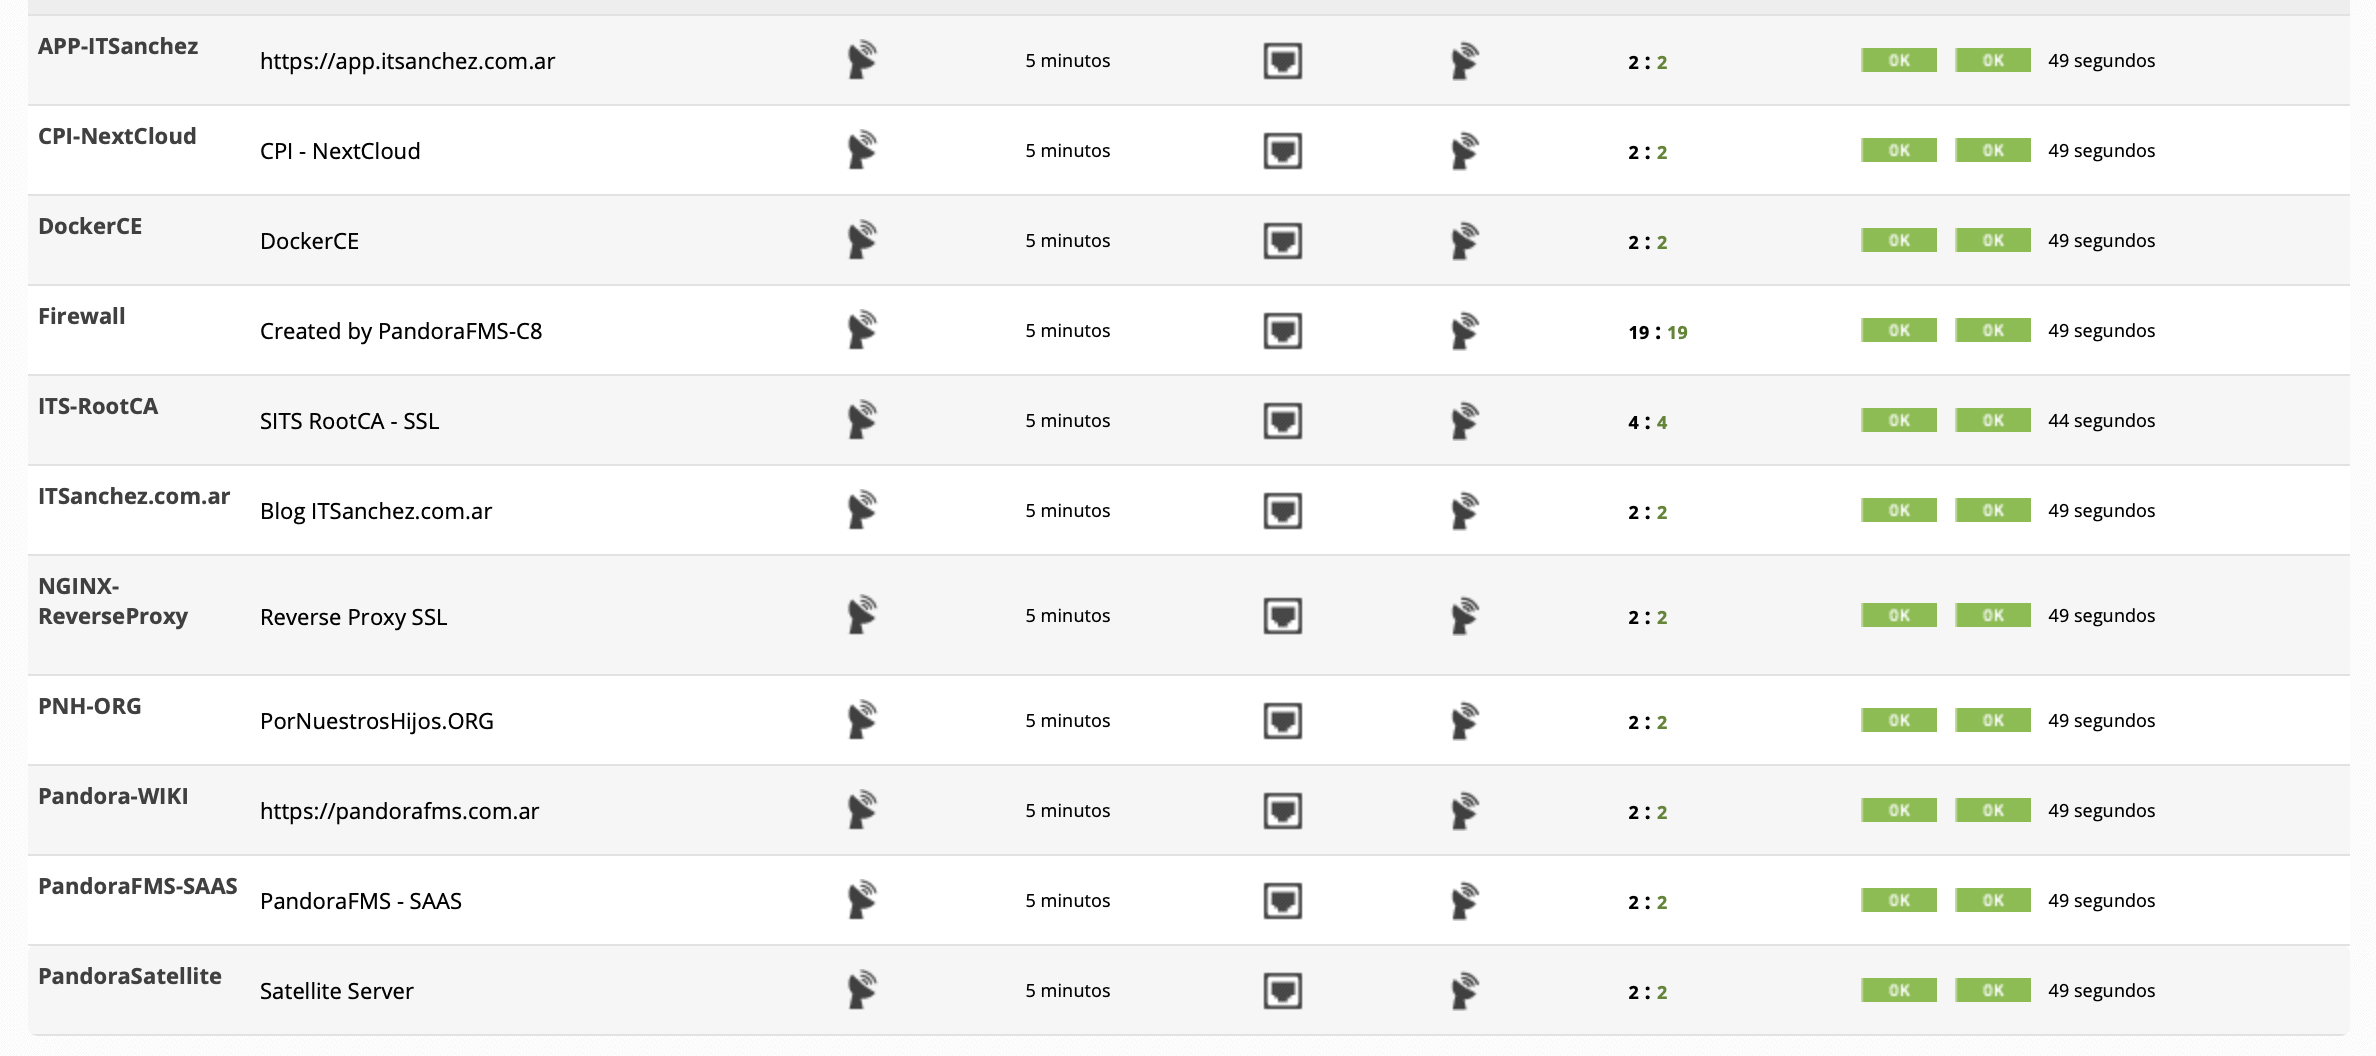
Here is a link to the official documentation on Satellite Server and below some screenshots.
Agents created from a Satellite Server:
Firewall discovered by Satellite Server SNMP:
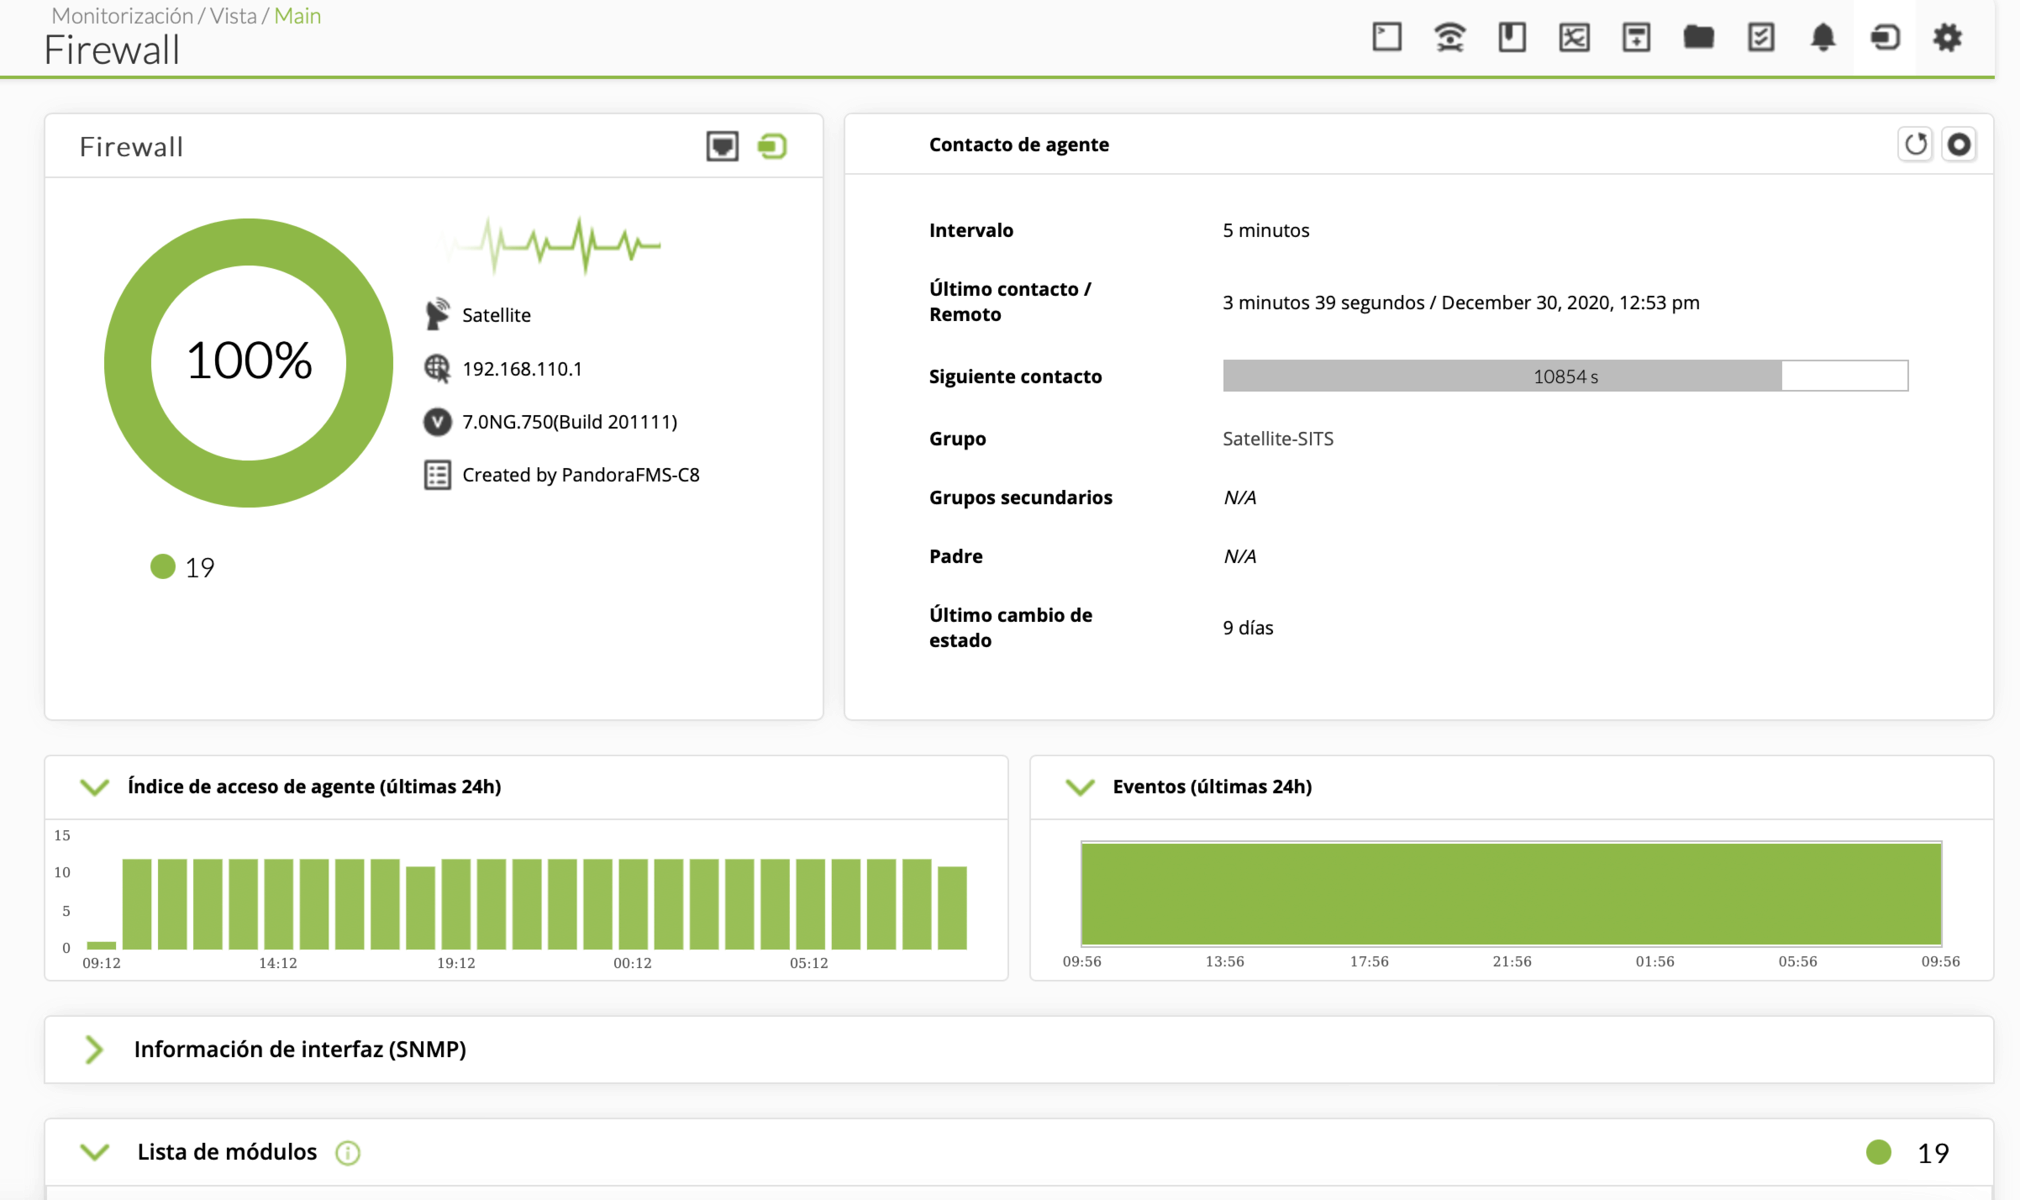
SNMP details:
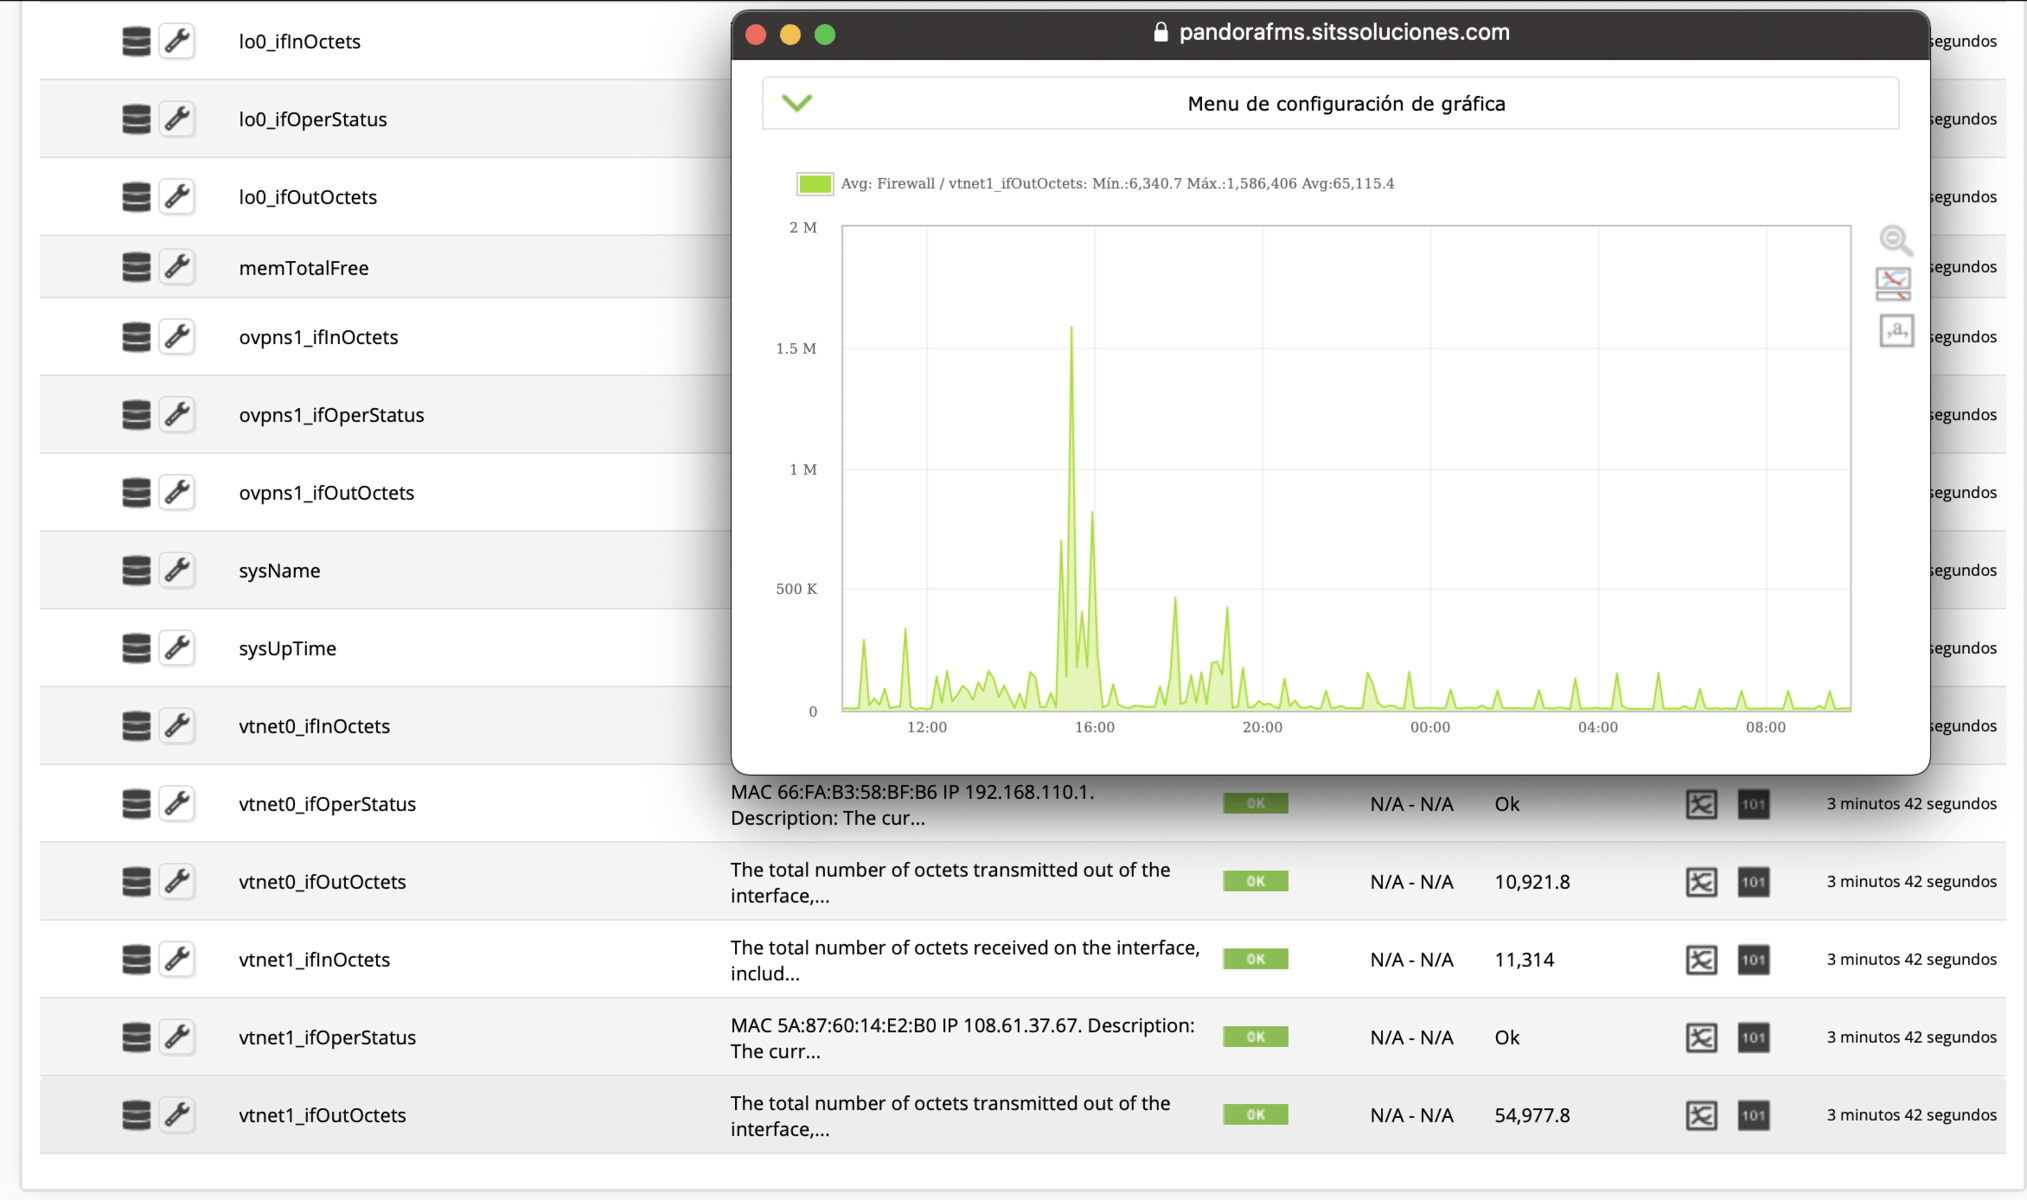
It is important to bear in mind that the SNMP values seen in the graphs are generated automatically, only giving as values the IP of the device and the SNMP community that it must check.
Remote Configuration and Collections
Another feature available only in the Enterprise version and very useful for companies with many agents is remote configuration and collections, which allow us to solve two great challenges running Pandora FMS in Azure; the first is to manage the agents 100% from the WEB console and the second is to distribute agent plugins in a simple and efficient way that does not require any additional configuration to work in Azure.
Agent with remote configuration enabled:

Collection enabled for an agent:

Synced scripts on the agent in ITSanchez collection:

A link to the official documentation on remote configuration.
Cloud Monitoring from Pandora FMS
Pandora FMS is constantly evolving according to the evolution of technology itself. Bearing in mind that many companies use Office 365 and virtual machines running on Azure, is it possible to monitor them natively?
The answer is very simple: yes, it is possible, you can make a query using Office 365 APIs and obtain the status of the services that are part of the solution.
Office 365 status view
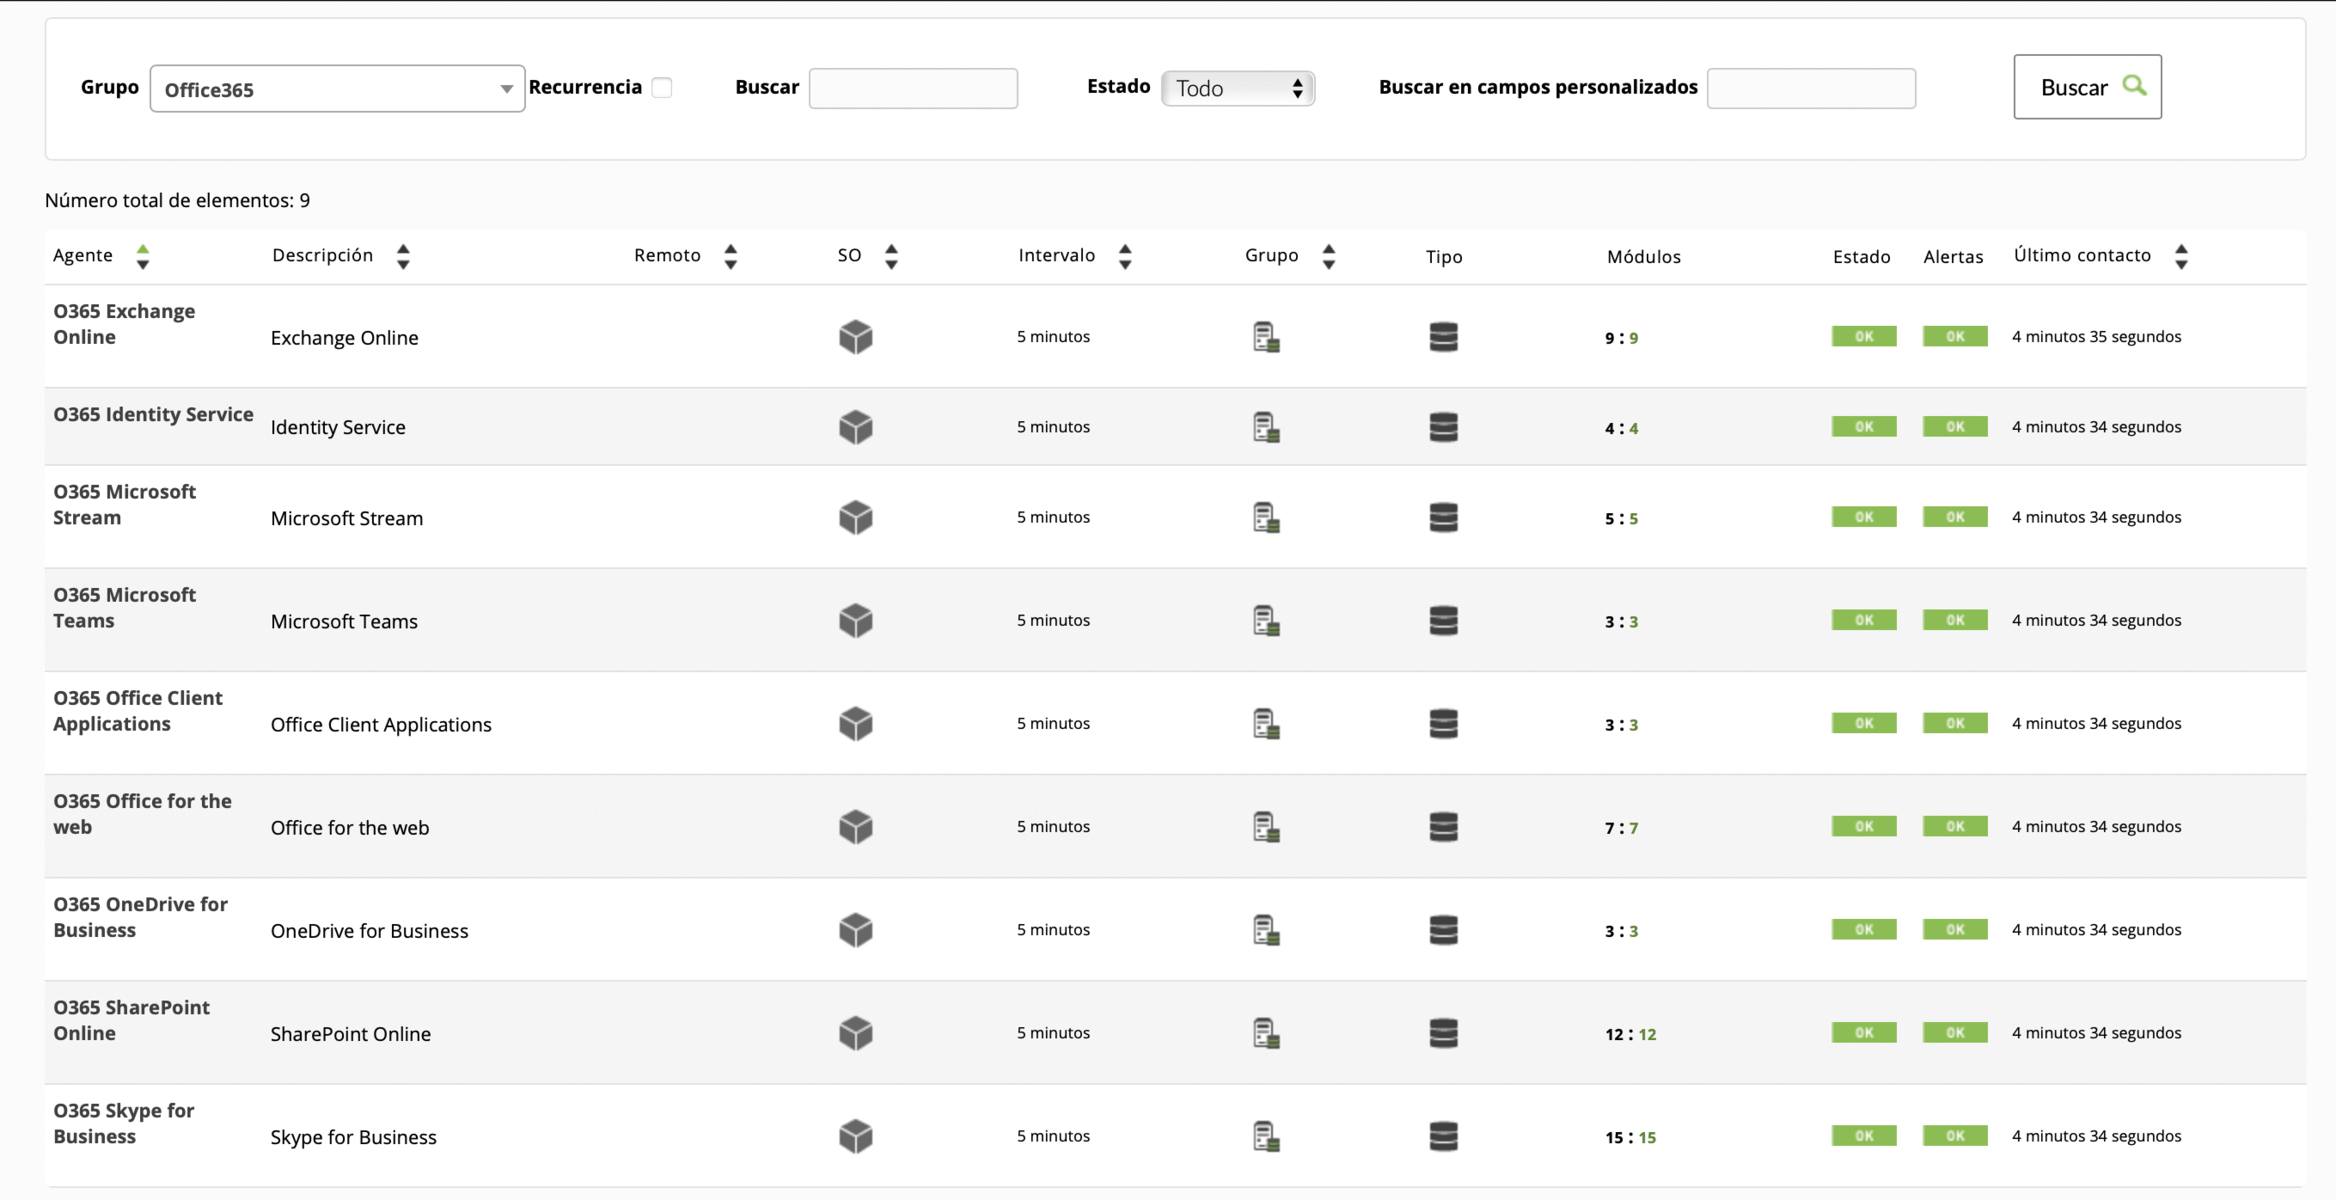
As for Azure virtual machines, from Discovery it is possible to configure the automatic discovery of your infrastructure running on Azure.
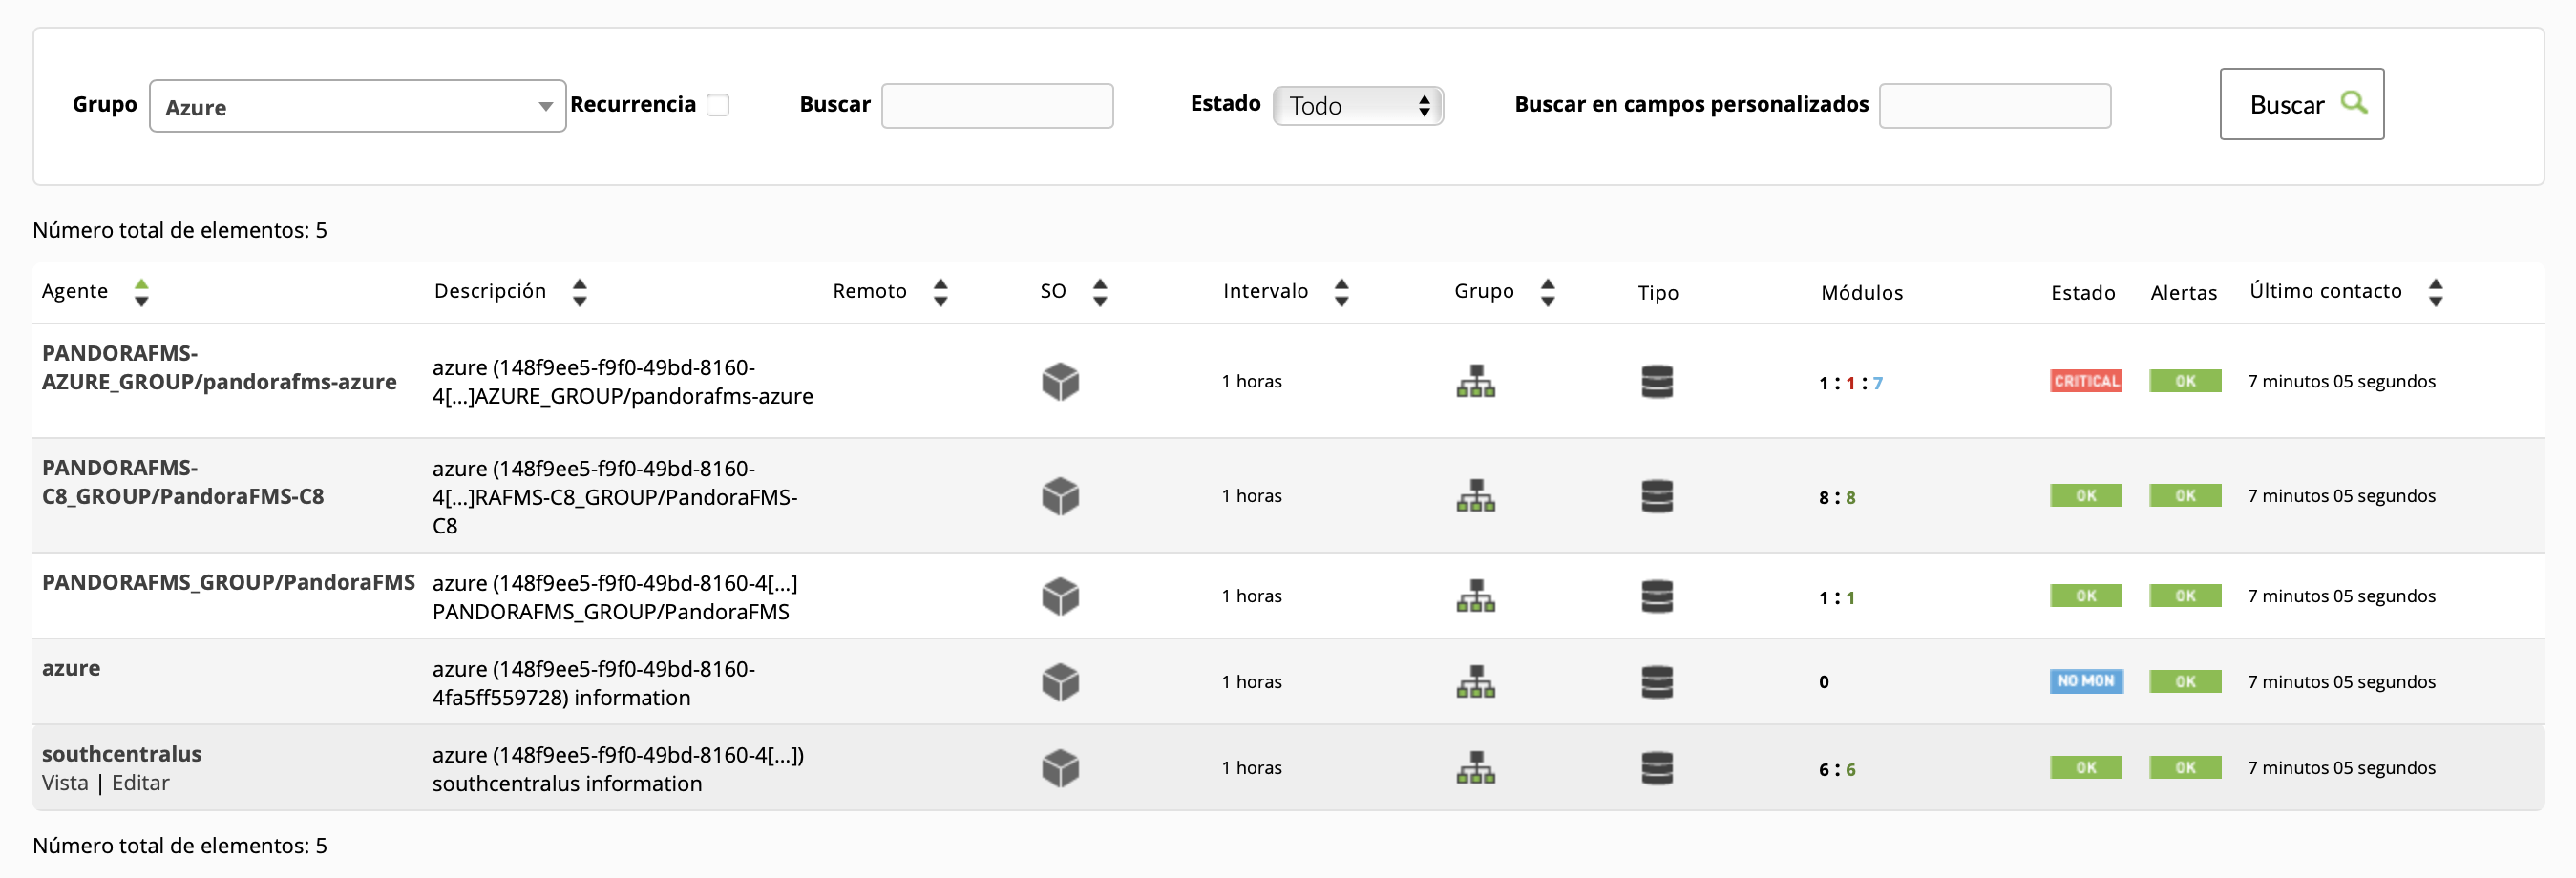
In this case, we see 2 virtual machines, one is running and the other is off, as well as a sum of the consumption in the southcentralus datacenter.

Here is a link to the official documentation on Azure monitoring.
Practical Case on Monitoring from Azure
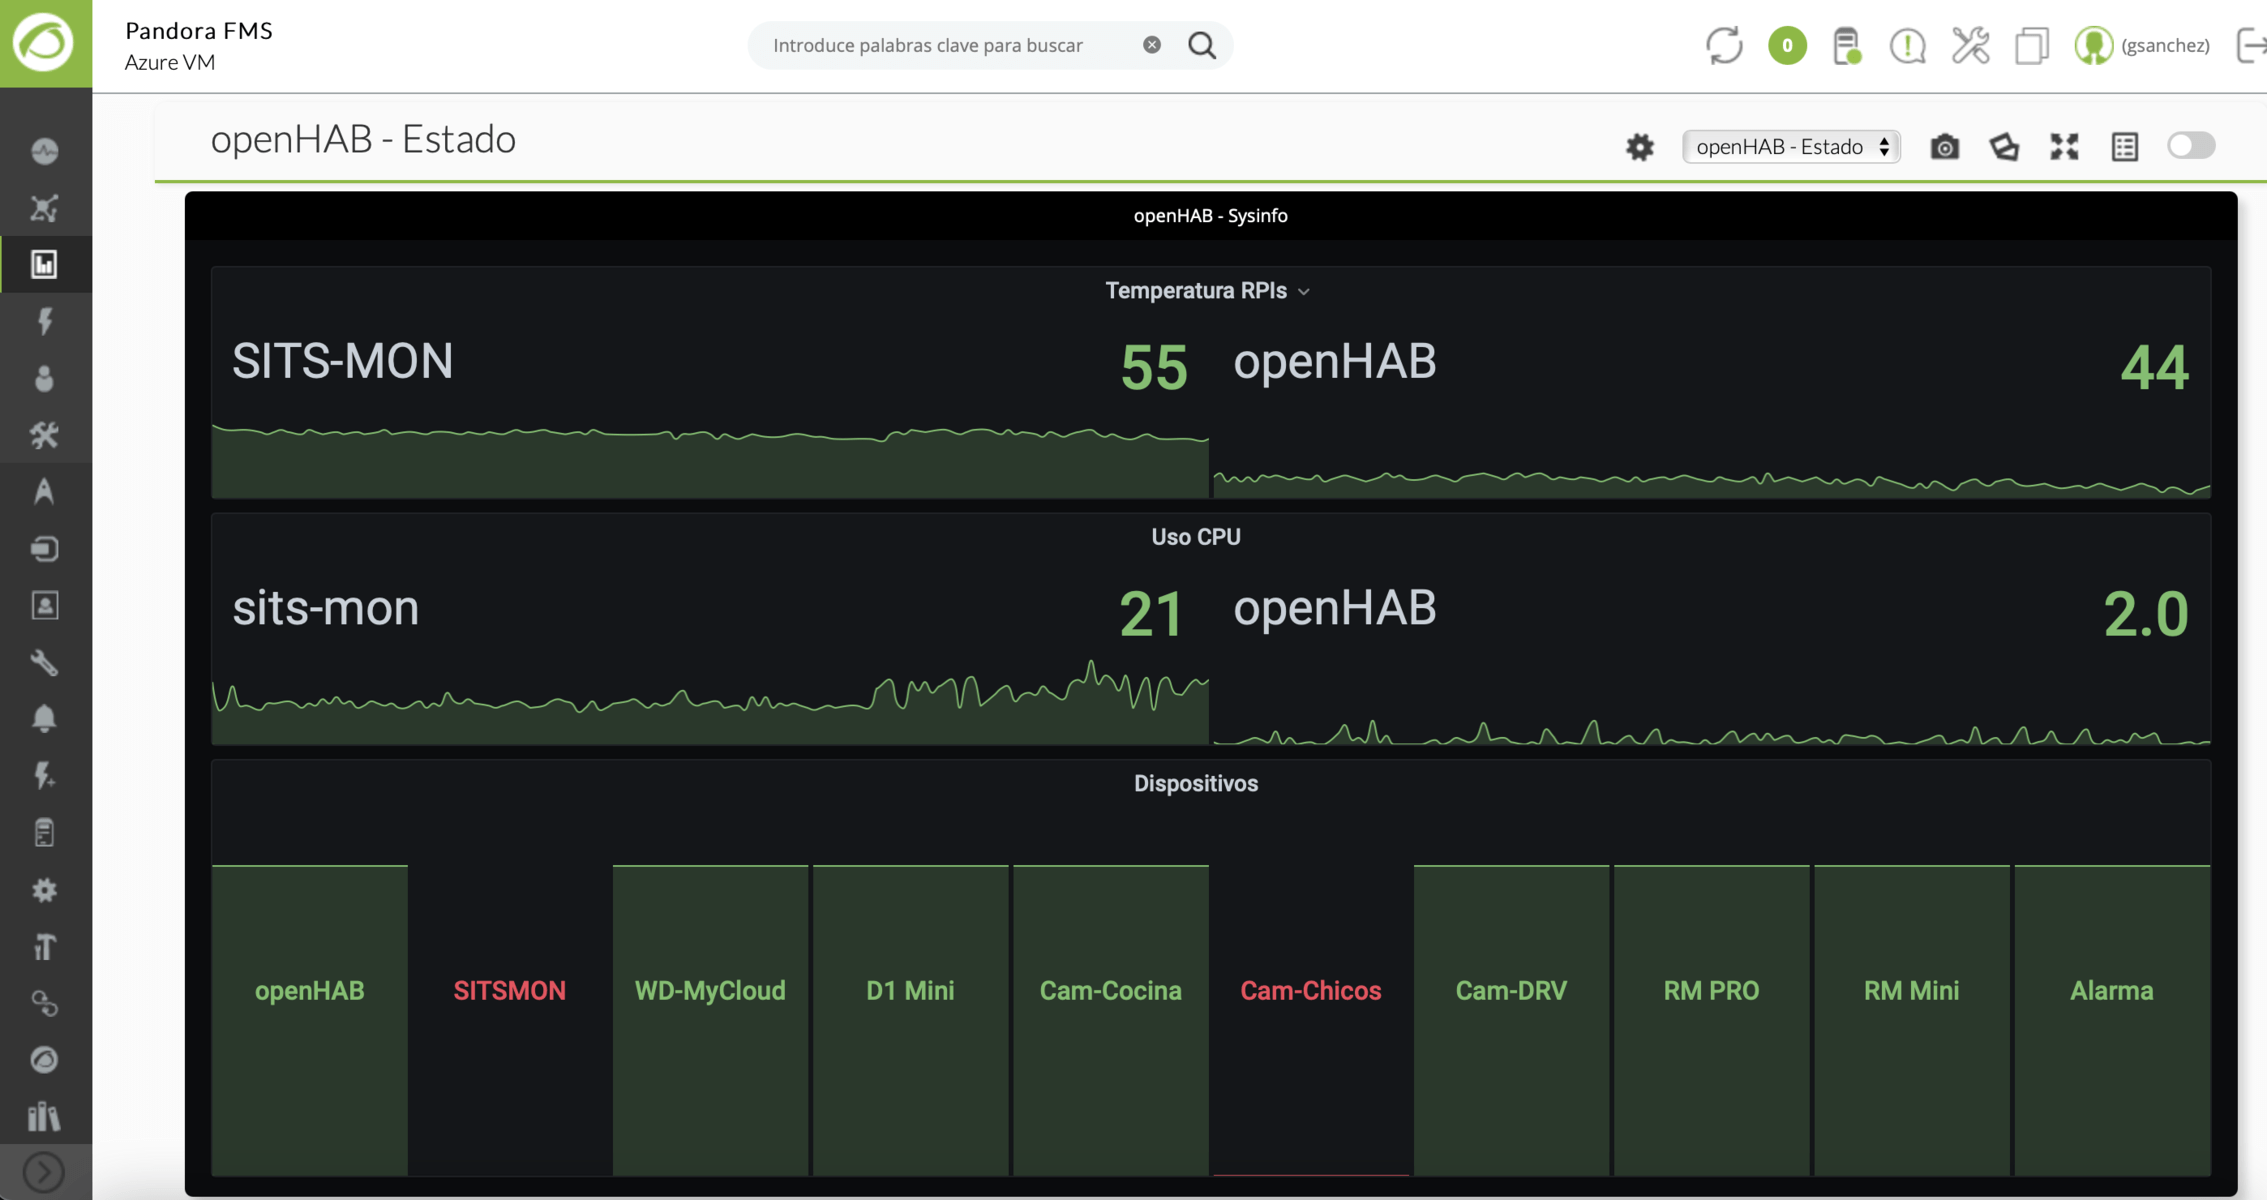
To close this article I am going to share how I can see the health status of my smart home solution based on openHAB.
To run the solution, I am using two Raspberry PIs, where a key value is to know the working temperature of each computer.
Raspberry PI CPU Temperature View:
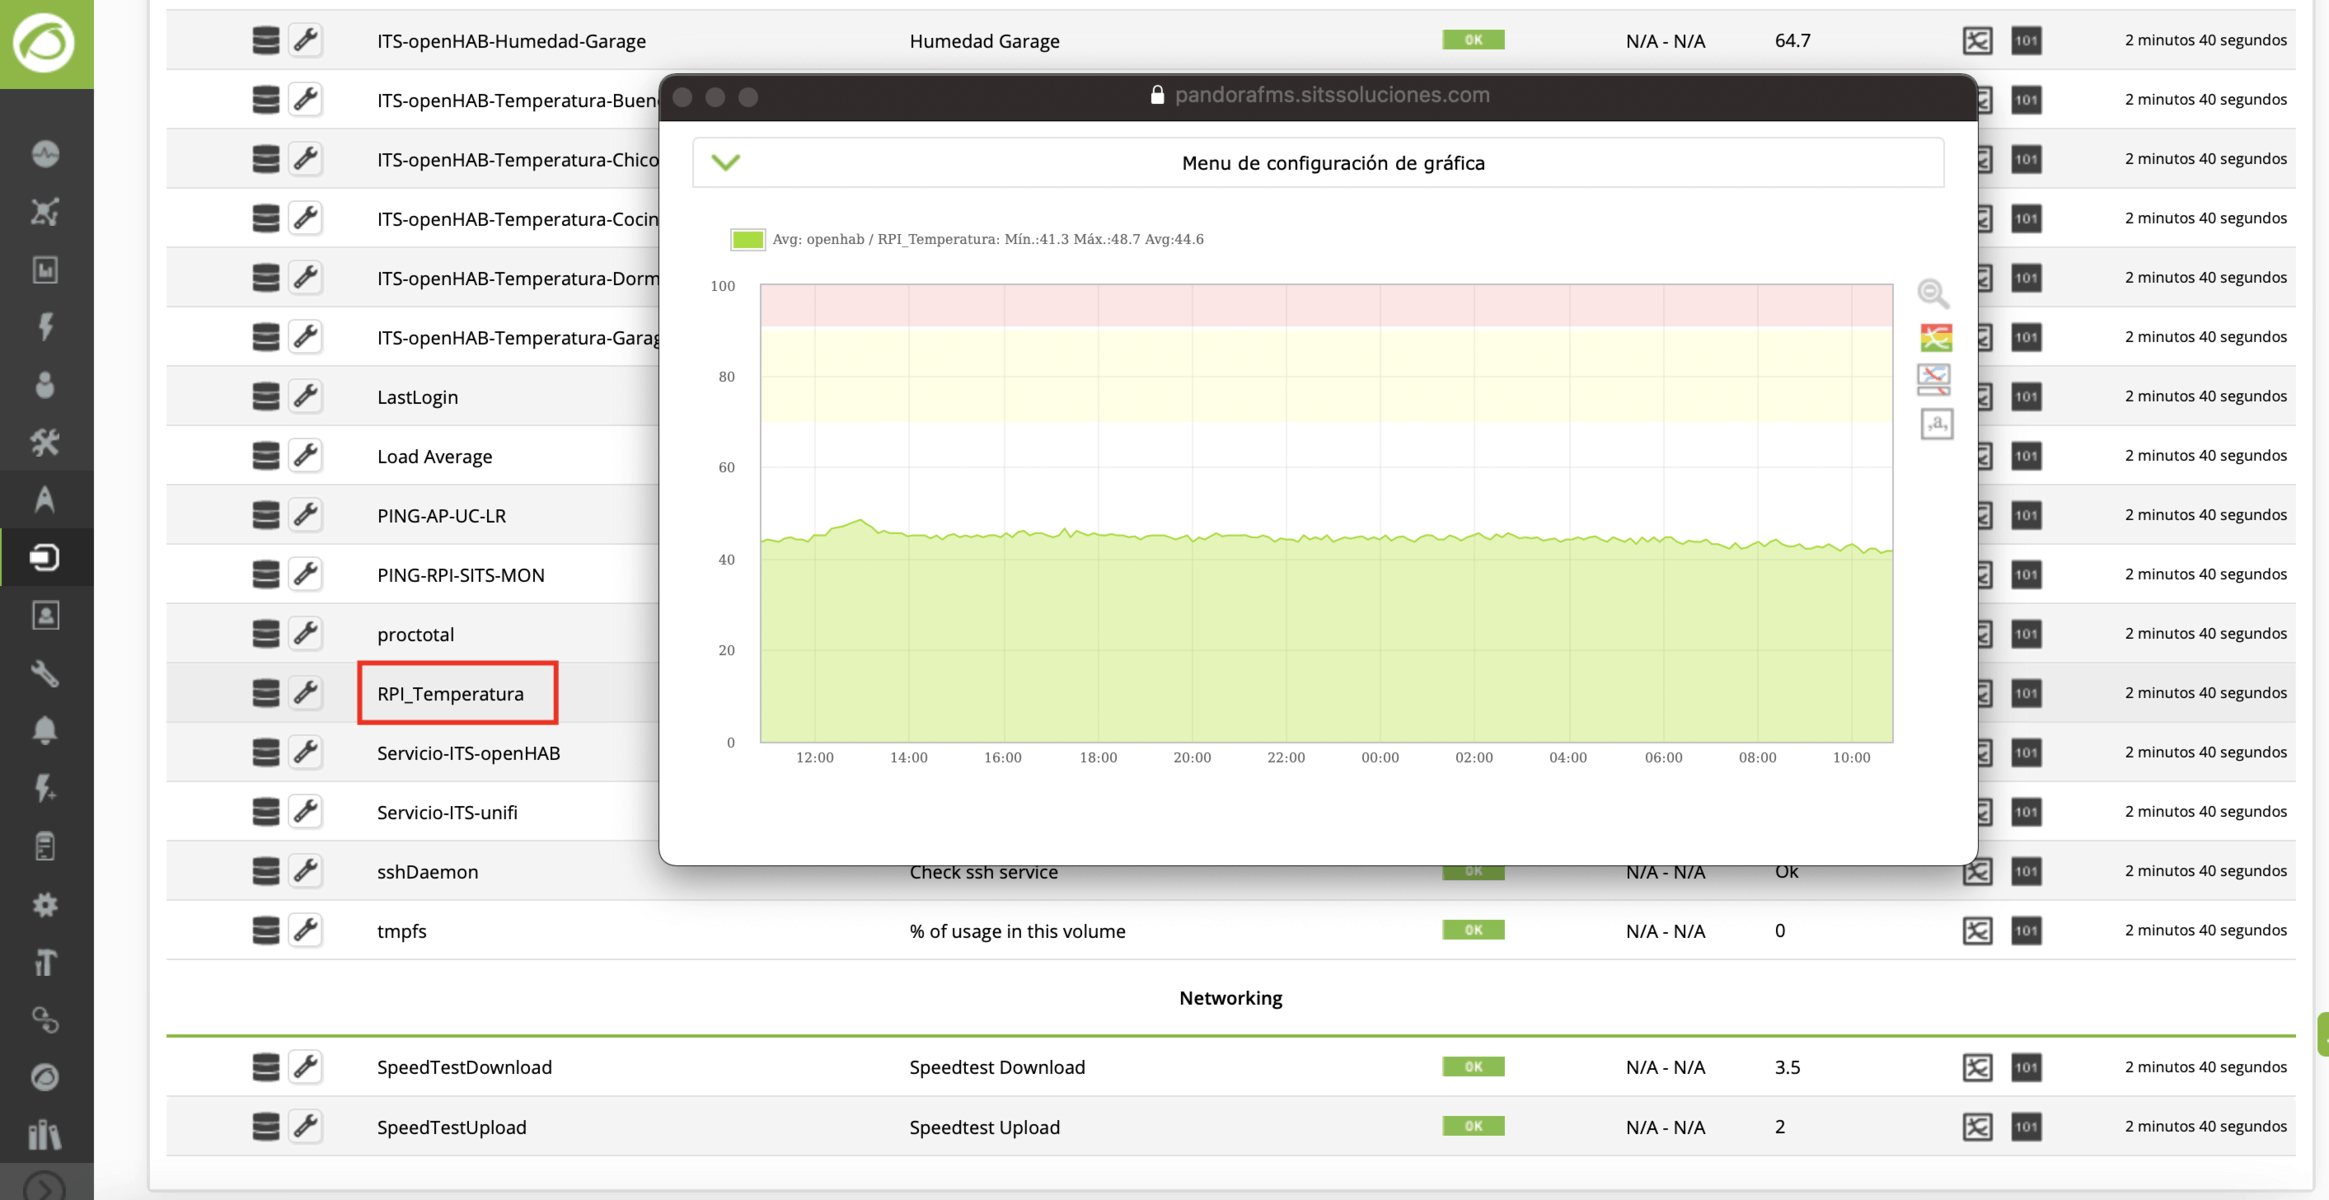
Dashboard in Grafana integrated into Pandora FMS:
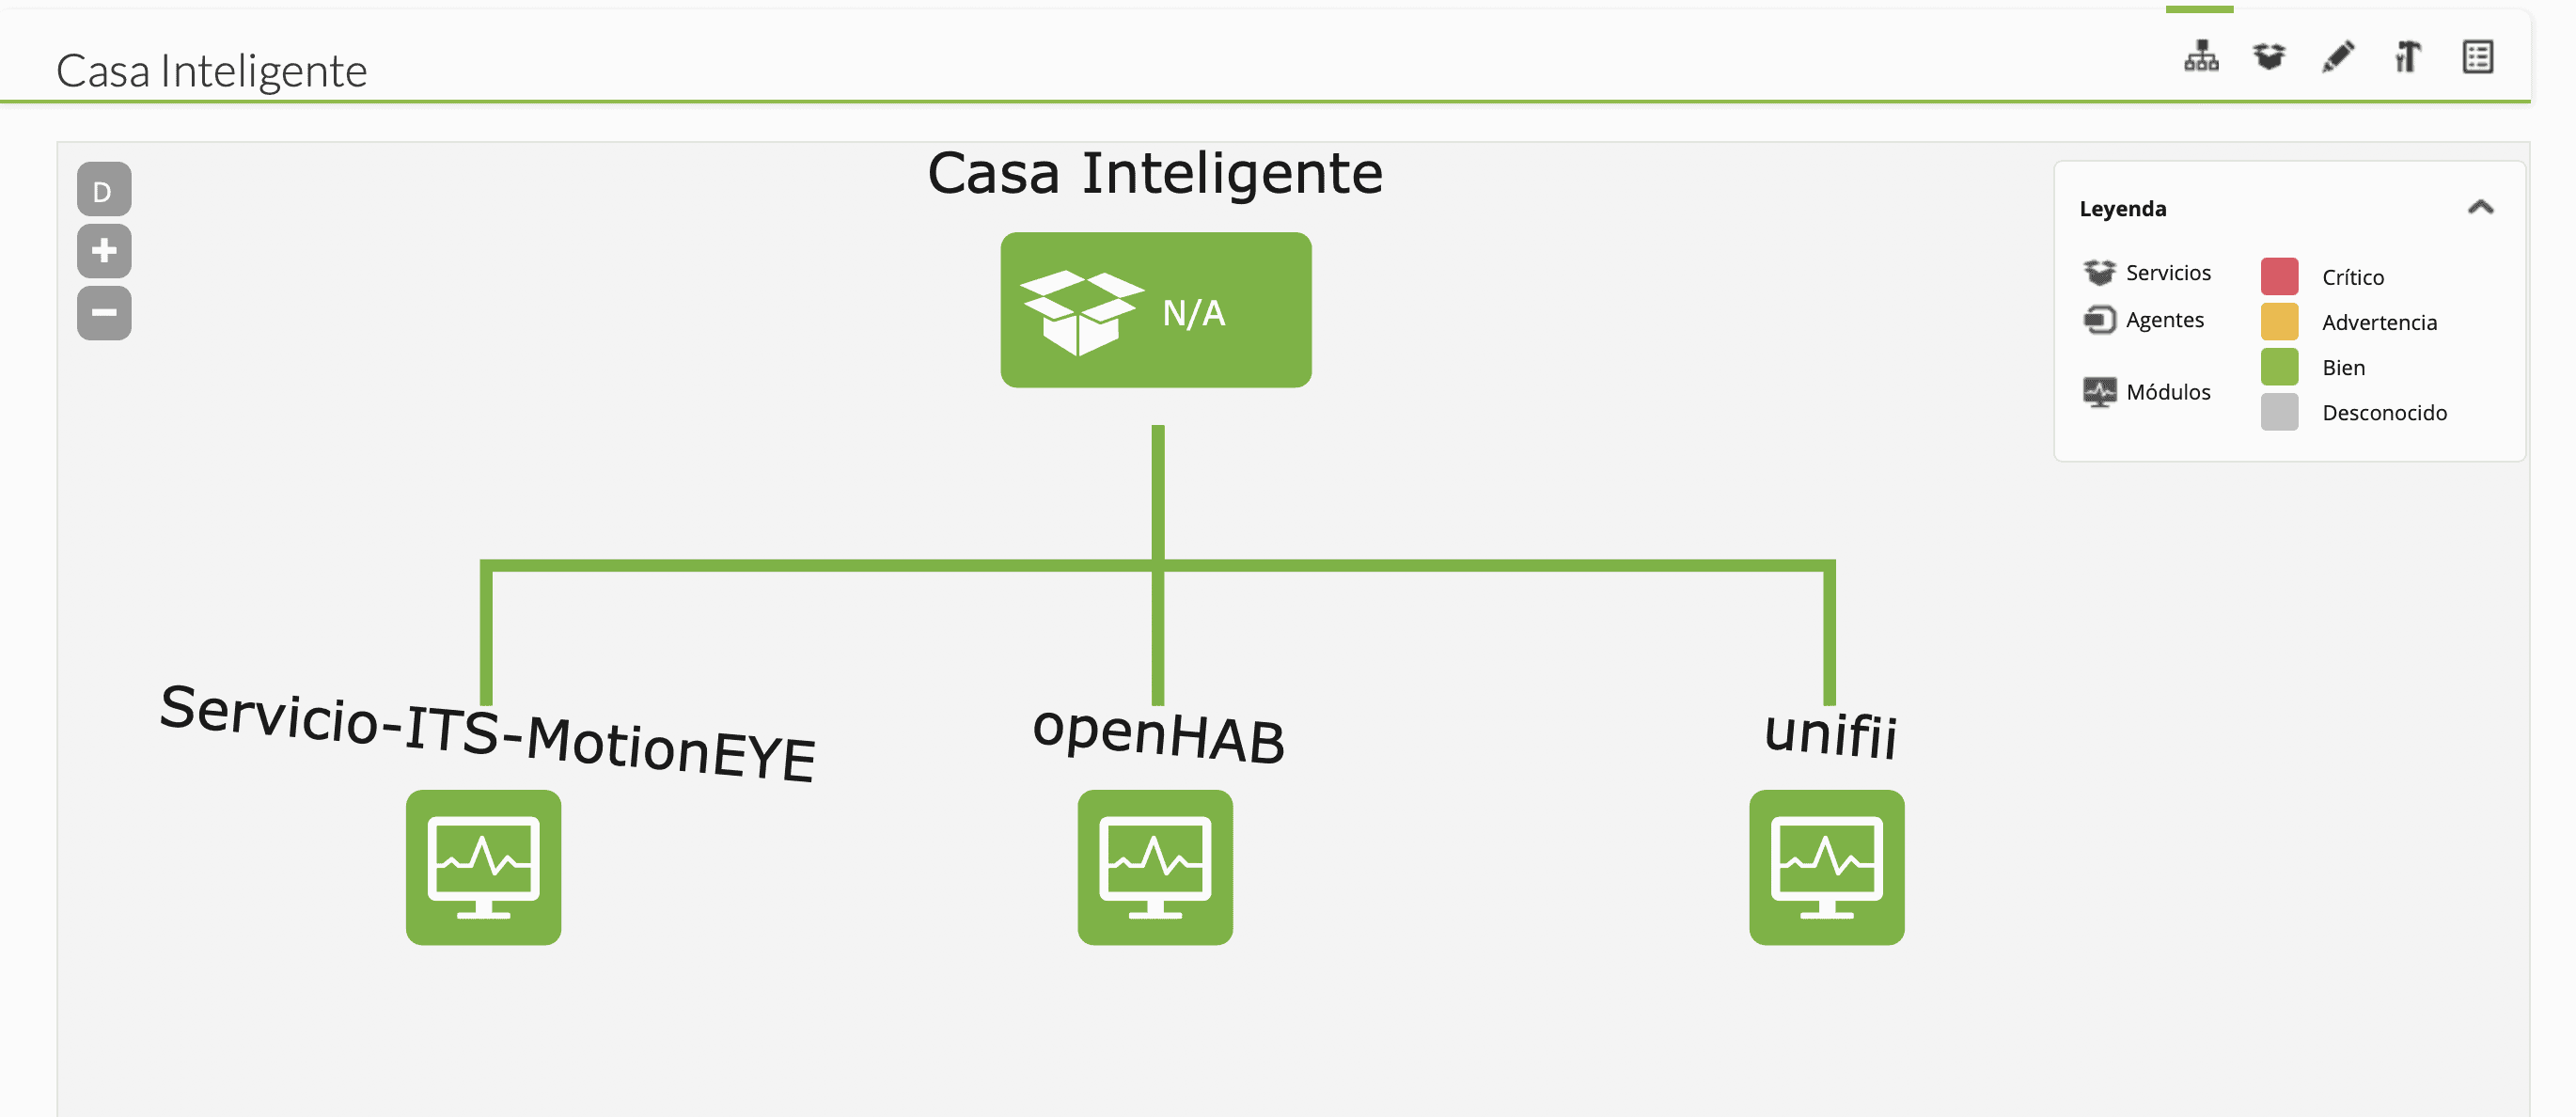
To finish off, here you have a service view (Enterprise feature) that allows you to build a view of any application based on the business.
Conclusion
Pandora FMS is a tool that allows you to monitor the health of your infrastructure by running the solution from the Cloud, in this specific case from Microsoft Azure.
If you want to find out more about what Pandora FMS can offer you, click here.
Moreover, if you have to monitor more than 100 devices, you may also enjoy a FREE 30-day Pandora FMS Enterprise DEMO . Get it here .

Foundering Partner and CEO of SITS SOLUCIONES. Restless entrepreneur, Technologist by training and innovator by vocation, he has more 25 years of experience in the IT universe. He is going through digital transformation and creating innovative solutions, currently focused on Pro-Active Monitoring, Cloud and High Availability. He makes contributions to the Pandora FMS communities for Argentina, Chile and Uruguay. Founder partner and CEO of SITS SOLUCIONES. Restless entrepreneur, trained technologist and innovator by vocation, has more than 25 years of experience in the IT universe. Moving the digital transformation and creating innovative solutions, currently focused on Pro-Active Monitoring, Cloud and High Availability. He makes contributions to Pandora FMS communities for Argentina, Chile and Uruguay.


