Monitor the storage of lots of data
In recent times with the arrival of social networking, appeared the need of storage and manage huge quantity of data. The classic database management systems have been, in some sense, deprecated due the low performance an scalability on this kind of systems.
The giants of social networks had noticed about that.
Facebook created Cassandra DB to power their Inbox Search feature in 2008, and Twitter announced to use Cassandra because it can be run on large server clusters and is capable of taking in very large amounts of data at a time in 2010. Nowadays, Cassandra is an Apache top level project, also knows as Apache Cassandra.
To manage lots of data increase the importance of monitor this part of the architecture. If you use Cassandra, you will want to know how to monitor it.
What is Apache Cassandra?
Apache Cassandra is an open source distributed database management system designed to handle large amounts of data across many commodity servers, providing high availability with no single point of failure. Cassandra offers robust support for clusters spanning multiple datacenters, with asynchronous masterless replication allowing low latency operations for all clients.
Key features and comparison with other NoSQL database enviroments
How to collect data
The Cassandra data extraction is done basically through the execution of commands in the Operative System. The CQLsh client is used to run CQL commands and the general log files of Cassandra are used to retrieve info too.
Parameters that we will retrieve from Cassandra are describe below:
-
Cassandra_Process: Displays information on the status of the cassandra process.
-
Cassandra_CPU_Usage: Displays the cpu use for the cassandra process in %.
-
Cassandra_Memory_Use: Displays the memory use for the cassandra process in %.
-
Cassandra_Error_Log_Messages: Displays the amount of error messages in the cassandra log.
-
Cassandra_Warning_Log_Messages: Displays the amount of warning messages in the cassandra log.
-
Cassandra_Network_Connections: Displays the amount of network connections by clients.
-
Cassandra_Thrift_Server_Status: Displays the status of the thrift server.
-
Cassandra_Cluster_Status : Displays the status of the main Cluster.
-
Cassandra_Key_Cache_Size: Displays the size of the key cache in kbs.
-
Cassandra_Active_Commands: Displays the amount of active commands or task being executed.
-
Cassandra_Pending_Commands: Displays the amount of pending commands.
-
Cassandra_Completed_Commands: Displays the amount of completed commands.
-
Cassandra_Active_Responses: Displays the amount of active responses to commands executed by cassandra.
-
Cassandra_Pending_Responses: Displays the amount of pending responses to commands.
-
Cassandra_Completed_Responses: Displays the amount of completed responses to commands.
-
Cassandra_Nodetool_Configuration: Detects if Nodetool is working properly.
Parameters that would influence badly the performance of Cassandra:
-
Cassandra_ReadStage_Pool_Pending_Tasks
-
Cassandra_RequestResponseStage_Pool_Pending_Tasks
-
Cassandra_MutationStage_Pool_Pending_Tasks
-
Cassandra_ReadRepairStage_Pool_Pending_Tasks
-
Cassandra_ReplicateOnWriteStage_Pool_Pending_Tasks
-
Cassandra_GossipStage_Pool_Pending_Tasks
-
Cassandra_AntiEntropy_Pool_Pending_Tasks
-
Cassandra_MigrationStage_Pool_Pending_Tasks
-
Cassandra_MemoryMeter_Pool_Pending_Tasks
-
Cassandra_MemtablePostFlusher_Pool_Pending_Tasks
-
Cassandra_FlushWriter_Pool_Pending_Tasks
-
Cassandra_MiscStage_Pool_Pending_Tasks
-
Cassandra_PendingRangeCalculator_Pool_Pending_Tasks
-
Cassandra_ReplicateOnWriteStage_Pool_Pending_Tasks
-
Cassandra_Comitlog_archiver_Pool_Pending_Tasks
-
Cassandra_InternalResponseStage_Pool_Pending_Tasks
-
Cassandra_HintedHandoff_Pool_Pending_Tasks
Do you want to know more about application monitoring?
Pandora FMS Enterprise is capable of monitoring the most popular applications and databases. Click here and find out…
How to monitor Apache Cassandra
To monitor Cassandra, we are going to use Pandora FMS. You can download this software by clicking here.
After installing Pandora FMS, you can download the Cassandra plugin.
This plugin monitoring is done basically getting data through the execution of commands in the Operative System, analyzing Cassandra’s log and executing nodetool (Command line utility included on Cassandra’s installation).
It execute the commands, parses all of the important values into software agent modules, XML formatted, ready to be sent to Pandora FMS Data Server.
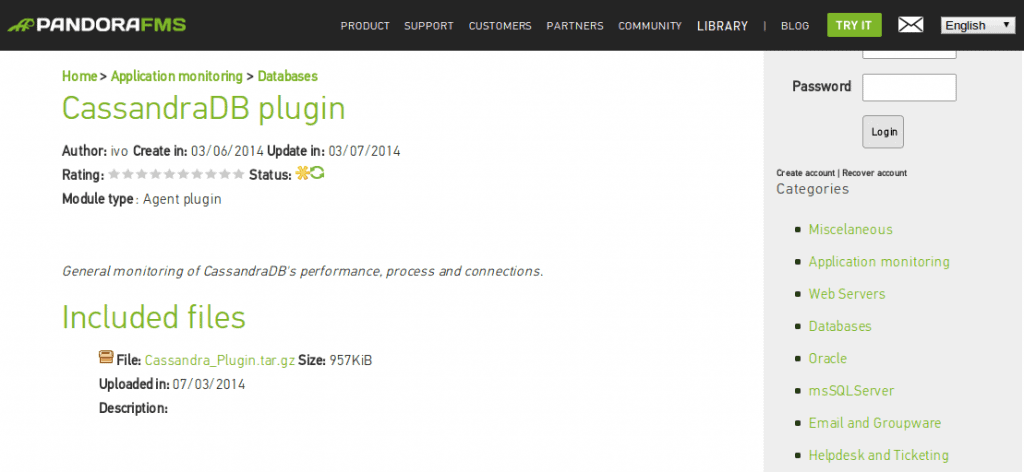
Thus, we can download these prebuilt checks anytime, without having to develop them by ourselves. This is how the Cassandra plugin looks at Pandora FMS library:
After downloading and upackaging the plugin (tar file), you will get a bash script (.sh) and the documentation for using the plugin (libreoffice .odt and .pdf). You can read step by step how to install Cassandra including the necessary requirements.
Copy the plugin file (cassandra.sh) in the agent plugin directory: /etc/pandora/plugins
Now, edit the default Pandora FMS agent configuration file: /etc/pandora/pandora_agent.conf
Use this line:
module_plugin /etc/pandora/plugins/cassandra.sh
Restart the pandora agent:
/etc/init.d/pandora_agent_daemon restart
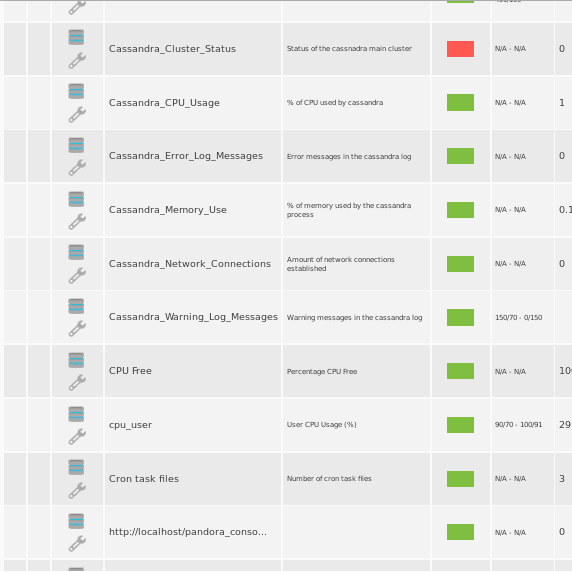
Hold on for 5-10 seconds before searching for the information about Cassandra in the agent you just installed. It should look like this:

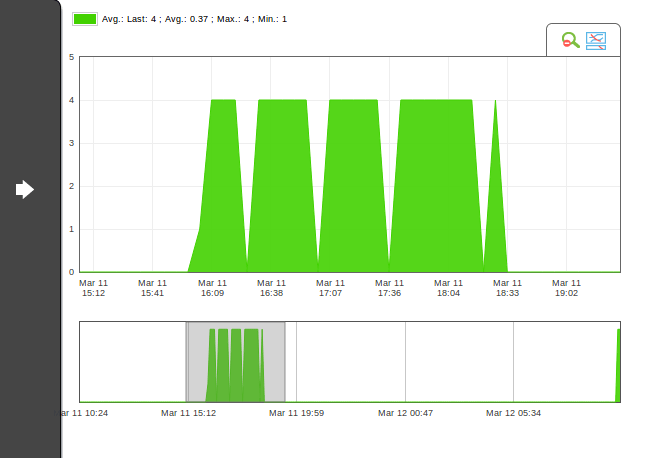
There are many things that we can do with all this information. One of them is to display the graphs for each of the modules.

With all this data in our Pandora FMS, a complete world of possiblities is open up to you:
- Be warned by mail/sms when something goes wrong with using the alerts system.
- A complete events list with customizable filter available from your internet browser and even from your mobile device using our mobile apps.
- Generate on demand or receive periodically complete reports.
You just have to check Pandora FMS manual to explore all your possibilities!
Do you not use Apache Cassandra yet? Download it HERE
Pandora FMS’s editorial team is made up of a group of writers and IT professionals with one thing in common: their passion for computer system monitoring. Pandora FMS’s editorial team is made up of a group of writers and IT professionals with one thing in common: their passion for computer system monitoring.


