
In the IT world, basic monitoring is an essential practice for overseeing servers, networks, and applications. Whether through logs, custom scripts, or specialized tools like Pandora FMS, it provides an overview of the infrastructure‘s health and helps detect performance or availability issues.
However, having all indicators in green does not always mean everything is working perfectly. Sometimes, end users still report issues: a website that takes too long to load, a transaction that does not complete, or processes that intermittently fail. Even worse, if these problems affect key transactions, they could lead to financial losses or user frustration.
Waiting for users to detect and report failures is not an option. This is where transactional synthetic monitoring comes into play, a proactive solution that simulates user behavior and detects issues before they take place.
What is transactional synthetic monitoring?
Transactional synthetic monitoring is a technique that simulates user interaction with an application or digital service using predefined scripts. Its main advantage is that it allows you to detect issues without the need for real users interacting with the system.
This approach allows for:
- Simulating key transactions such as logins, purchases, payments, or information searches.
- Detecting availability and performance issues before they impact end users.
- Testing specific scenarios such as high traffic loads or failures in external components.
- Automating tests in different environments, suppressing the need for real users to validate the system’s functionality.
Thanks to synthetic monitoring, companies can ensure that their digital services work properly, even before users interact with them.
Why traditional monitoring is not enough?
Conventional monitoring oversees the status of networks, servers and applications, but it does not always reflect what end users experience. Some situations where synthetic monitoring is crucial include:
- All indicators are green, but users experience issues: A server may be operational, but a webpage may not load properly.
- Errors that only appear under certain conditions: For example, a payment failure that only takes place when users select a specific currency.
- Difficulty in identifying bottlenecks in critical transactions: Without active simulations, it is hard to pinpoint which part of the process affects conversion or user satisfaction.
Differences Between UX and WUX in Pandora FMS
Pandora FMS allows for the implementation of synthetic monitoring in two specialized environments:
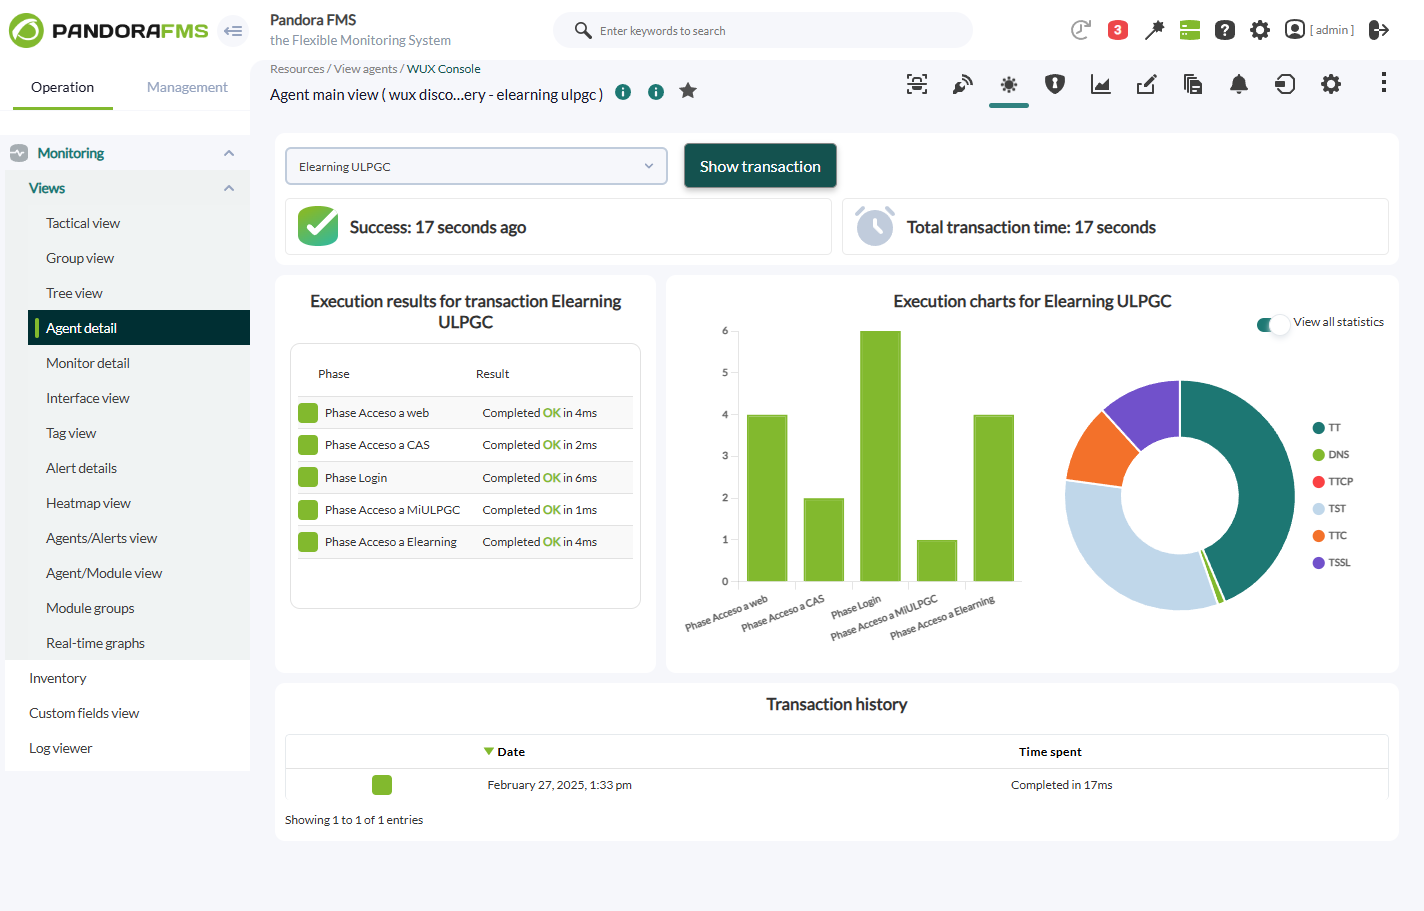
- WUX (Web User Experience): It simulates web transactions using Selenium, allowing for the evaluation of load times, availability, and errors across different browsers.
- UX (User Experience): It simulates interactions in Windows desktop applications, validating execution times, stability, and potential failures.
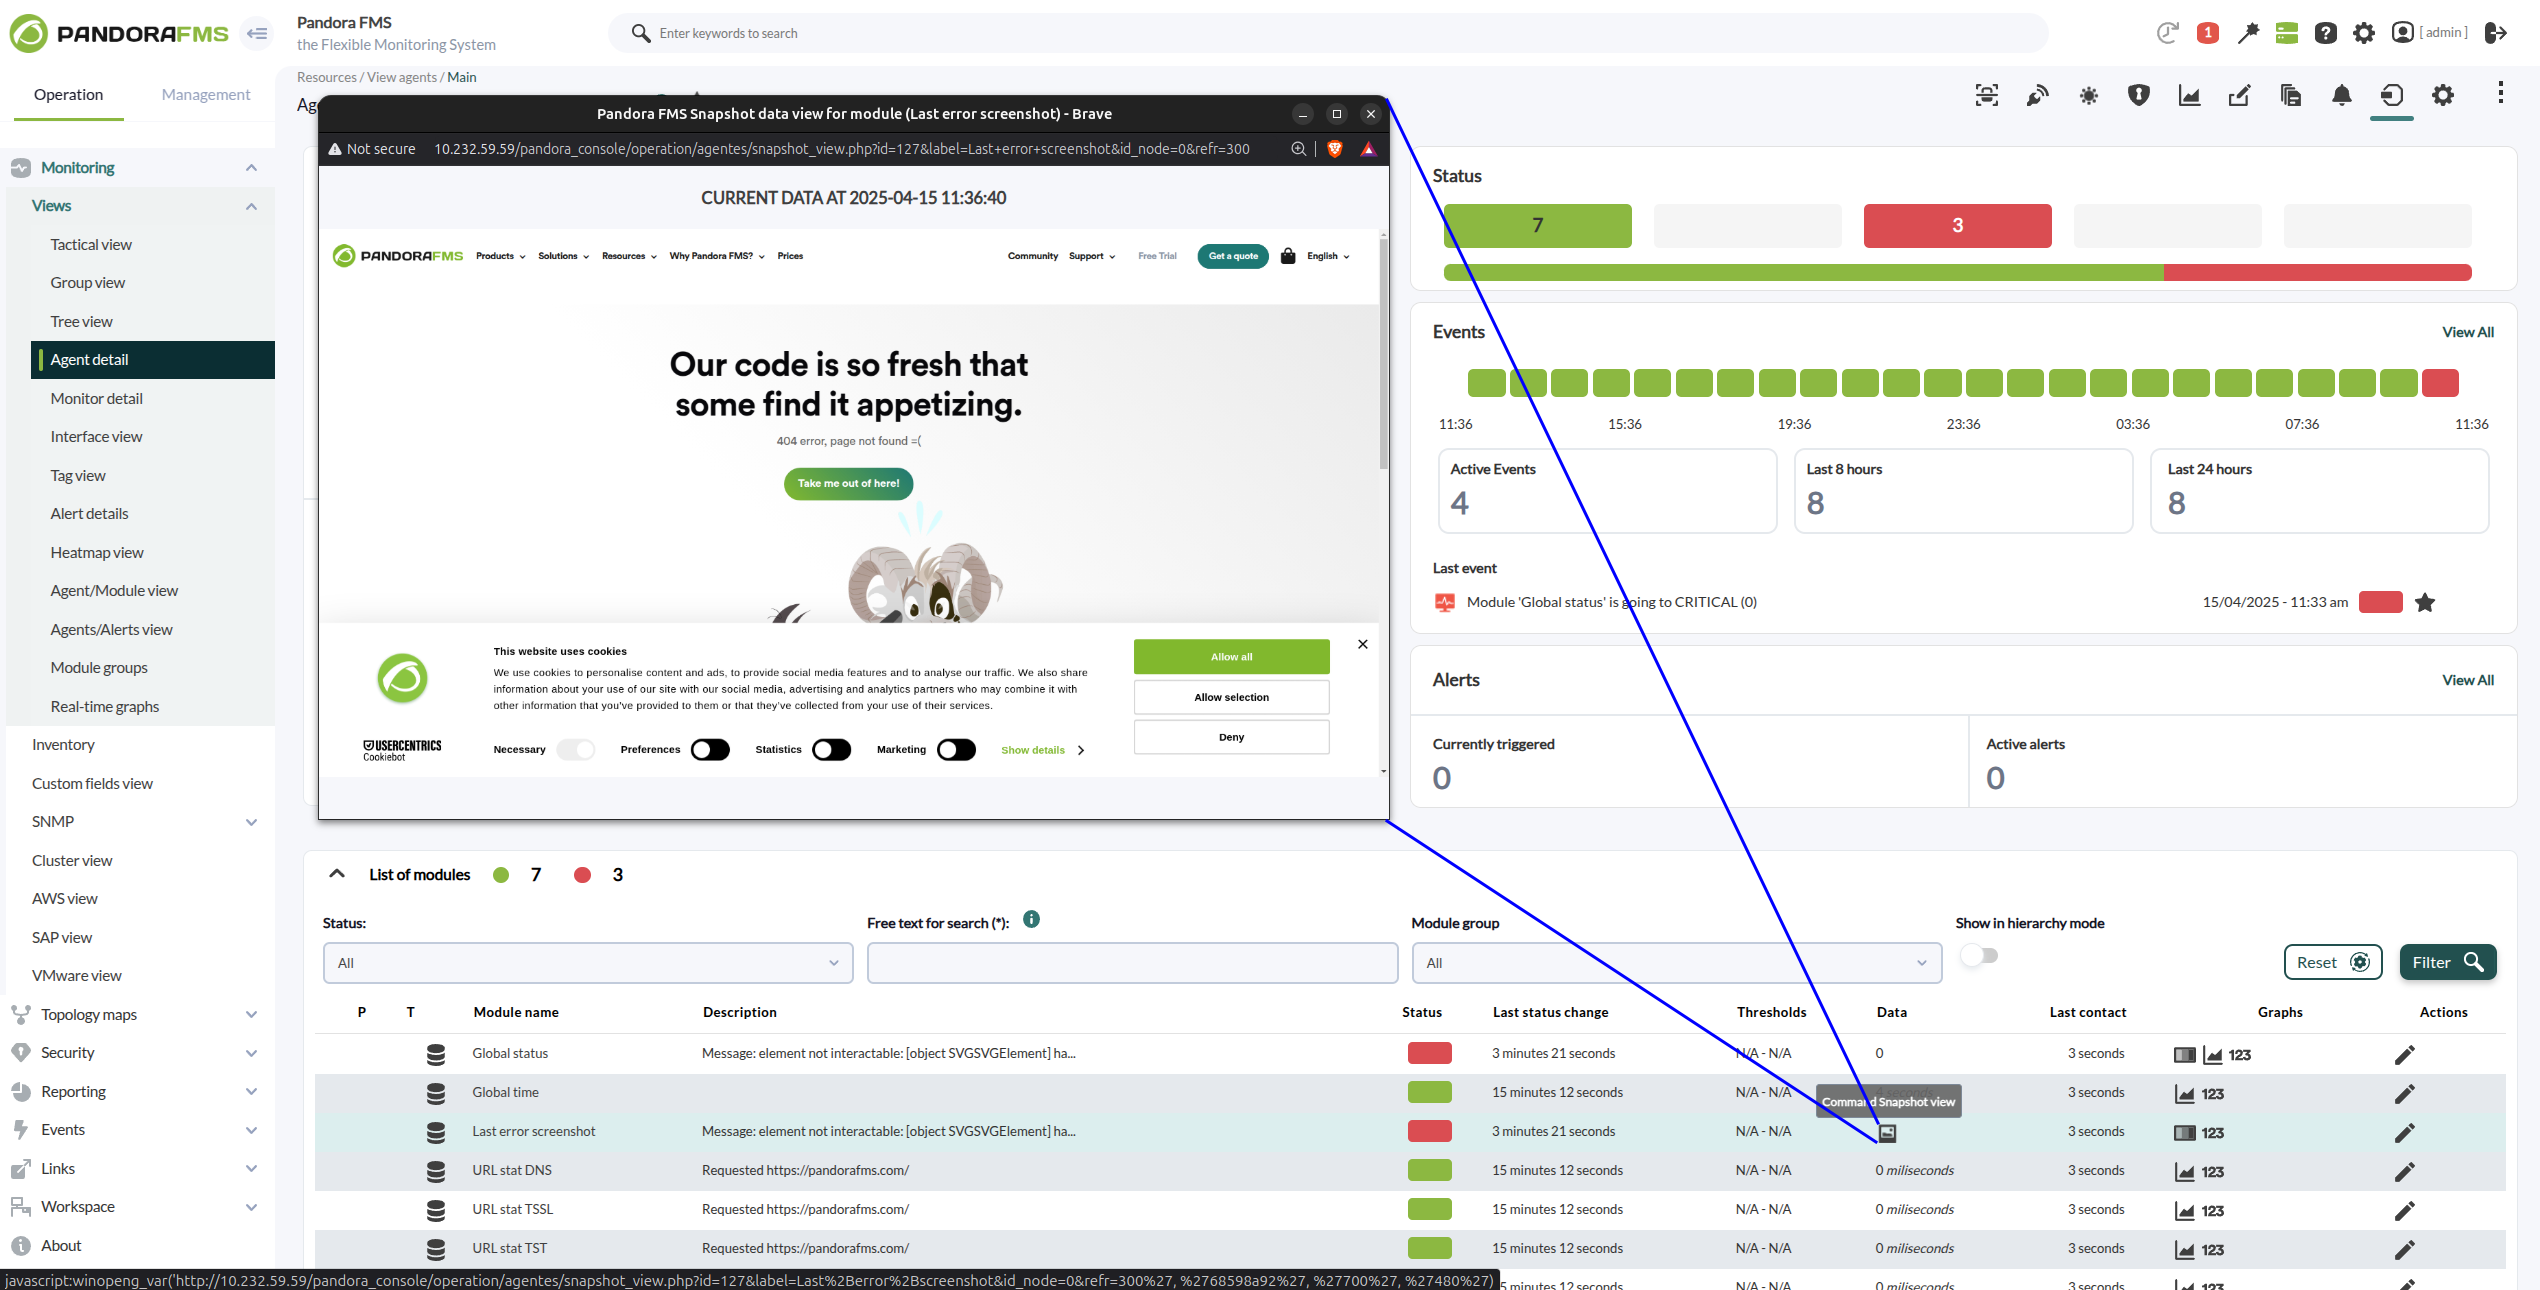
Both solutions generate detailed reports, real-time alerts, and screenshots in the event of failures, providing a comprehensive view of the performance of digital services.
Key Advantages of Synthetic Monitoring
Implementing a synthetic monitoring strategy offers multiple advantages:
- Early detection of failures: It identifies issues before they impact end users.
- Performance optimization: It improves the digital experience and reduces load times.
- Automation of regression testing: It ensures that new software versions do not add failures.
- Reduced support costs: By detecting errors before users report them, incidents are minimized.
- Evaluation under different conditions: It allows testing scenarios with varying traffic loads and geographic locations.
- Integration with observability: It complements traditional monitoring tools, providing a more comprehensive view.
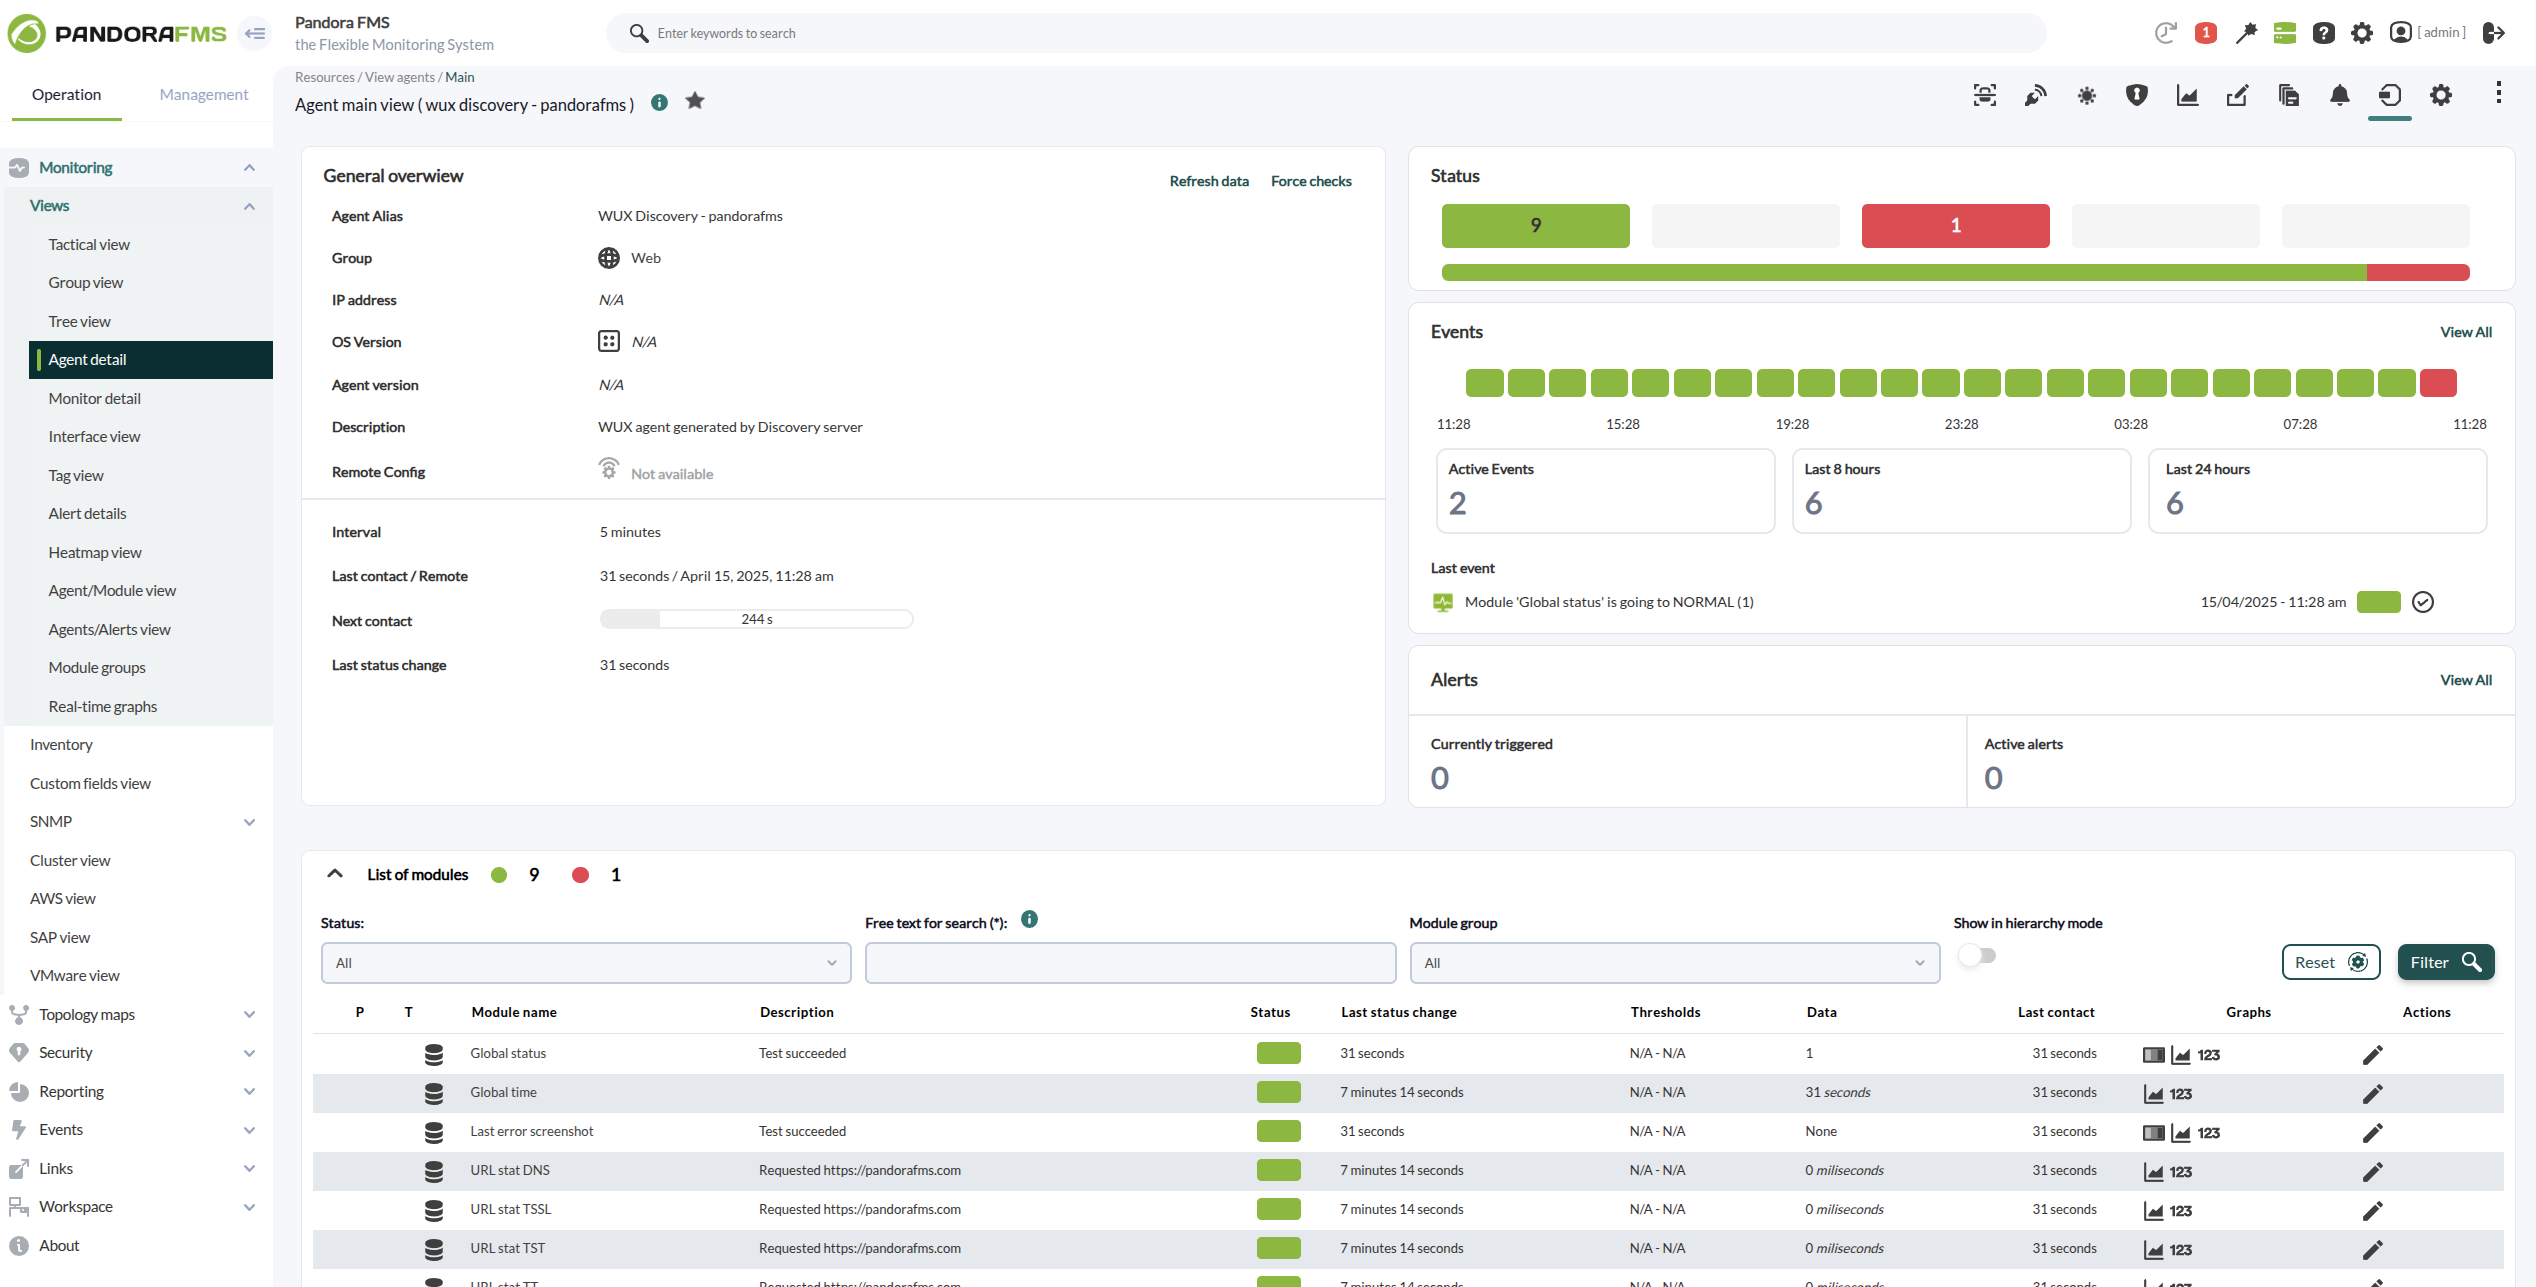
How Synthetic Monitoring Works in Pandora FMS?
Pandora FMS allows you to configure a synthetic monitoring environment with the following steps:
- Transaction Recording: The user’s navigation or interaction is recorded using Selenium IDE, capturing every step of the process.
- Configuration in Pandora FMS: The recording is integrated into WUX or UX, setting up the monitoring criteria.
- Automated Execution: Transactions are executed periodically to detect potential failures.
- Result Analysis: Detailed reports are generated with performance metrics, response times, and detected errors.
- Real-time Alerts: If a failure is detected in a critical transaction, Pandora FMS immediately notifies to make intervention possible.

Advanced Synthetic Monitoring with Pandora FMS
Pandora FMS offers a set of advanced tools for synthetic monitoring, enabling proactive supervision of the performance and availability of digital services.
- Web and Desktop Monitoring: Support for web transactions with WUX and execution of tests on desktop applications with UX.
- Automation with Selenium 4: Integration with Selenium for simulating scenarios across multiple browsers.
- Distributed Execution with Docker: Ability to deploy scalable testing environments through containers.
- Transaction Segmentation: It allows analyzing the performance of each stage of a transaction individually.
- Testing from Multiple Locations: Simulate traffic from different regions to evaluate global latency and availability.
- Smart Alerts: Real-time notifications for incidents within a transaction flow.
- Advanced Analysis and Reporting: Capture of key performance metrics, visual dashboards, and export of detailed reports.
Thanks to these capabilities, Pandora FMS enables businesses to maintain full control over the digital experience, reducing the impact of potential failures and optimizing operational efficiency.
Conclusion
Transactional synthetic monitoring is a key tool for ensuring a high-quality digital experience. With Pandora FMS, businesses can anticipate issues, improve the performance of their applications, and optimize user satisfaction.
Want to try synthetic monitoring in your infrastructure?
Discover how Pandora FMS can help. Start for free now.

Project Manager at Pandora FMS. More than 15 years of experience in the IT world. Lover of technology and open source, DevOps culture. Fan and promoter of automation, containerization and container orchestration. Project manager in Pandora FMS. More than 15 years of experience in the IT world. Technology and open source lover, DevOps culture. Fan and promoter of the automation, containment and orchestration of containers.