How to monitor MongoDB
Monitor MongoDB for 99,99% uptime
Loyalty takes time and effort. The Internet gives us a wide range of options. So if something fails there are many other websites waiting for our users to come, just one click away. That is why we have to provide our users with a satisfying user experience what means that we have to make sure that our database works properly. If MongoDB goes wrong, all your apps will fail. So monitoring the main variables and configuration parameters of your database is the best option to make sure that your values are right and your users are happy.
What is MongoDB?
MongoDB is an open-source, document-oriented database designed for easing the development of the internet apps and the scalability of your infrastructure. MongoDB stores structured data with dynamic schemas, making the integration of data in certain types of applications easier and faster. Its main features are mentioned below.
- Document-oriented
- High performance
- High availability
- Easy scalability
- Rich query language
How to collect data
The MongoDB distribution includes utilities that return statistics about performance and activity instances quickly. These are typically used for diagnosing issues and assessing normal operations: Mongotop and Mongostat.
Mongotop tracks and reports the current reading and writing activity of a MongoDB instance, providing per-collection visibility into use. Mongotop verifies that activity and uses match expectations.
Mongostat captures and returns counters of database operations. It reports operations on a per-type (e.g. insert, query, update, delete, etc.) basis. This format makes it easy to understand the distribution of load on the server. Mongostat helps us understand the distribution of operation types and inform capacity planning. Mongostat provides more metrics to collect data. That is why it is recommended by MongoDB to collect data.
Below, there is a list of metrics where we can obtain information from:
- _MongoDB_OpenConns_: DB Open connections for this instance.
- _MongoDB_ActiveClientsReading_: DB Active reading clients for this instance.
- _MongoDB_ActiveClientsWriting_: DB Active writing clients for this instance.
- _MongoDB_Inserts_: DB Inserts per second for this instance.
- _MongoDB_Queries_: DB Queries per second for this instance.
- _MongoDB_Updates_: DB Updates per second for this instance.
- _MongoDB_Deletes_: DB Deletes per second for this instance.
- _MongoDB_IdxMiss_: DB bttree page missed percentage for this instance.
The most interesting are mentioned above. Although there are more interesting metrics available:
- _MongoDB_Getmores_: DB Getmores per second for this instance.
- _MongoDB_Commands_: DB Commands per second for this instance.
- _MongoDB_Flushes_: DB Fsync flushes per second for this instance.
- _MongoDB_PageFaults_: DB Page faults per second for this instance.
- _MongoDB_ClientReadQueueLength_: DB Client read queue length for this instance.
- _MongoDB_ClientWriteQueueLength_: DB Client write queue length for this instance.
- _MongoDB_NetworkTrafficInBits_: DB Network traffic in bits for this instance.
- _MongoDB_NetworkTrafficOutBits_: DB Network traffic out bits for this instance.
Most of these metrics are useful to discover performance problems such as server instances with a load they cannot handle, timeout problems, bad tendencies discovering and capacity planning.
Do you want to know more about application monitoring?
Pandora FMS Enterprise is capable of monitoring the most popular applications and databases. Click here and find out…
DB Statistics
The Mongo shell provides a number of commands that return statistics about the state of the MongoDB instance. These data may provide finer granularity than the tools above regarding to the state of the MongoDB instance.
Consider using their output in scripts and programs to develop custom alerts, or modifying the behavior of your application in response to the activity of your instance.
Logfile
The Mongo logfile is absolutely necessary when you have a real problem: logfiles are not always present in monitoring performance, but you will need it when you fight against an unknown issue. Keep it in mind! It is at /var/log/mongodb/mongodb.log
MongoD is a process that executes MongoDB server. If this process does not work properly, you are dead. So you better be loving and caring when you have monitor it.
Monitoring the main variables and configuration parameters of your database is the best option to make sure that your values are right and your users are happy
How to monitor MongoDB
To explain how to monitor Mongo DB, we are going to use Pandora FMS Open Source. It is an Open Source monitoring tool that works by first managing servers, applications and communications, and then notifying users of problems and failures before they occur. It also includes a configurable report system that evaluates and notifies users on the level of fulfillment and compliance of their systems. You can download this software by clicking here.
If you need some help to install the software, there are some tutorials available in the website. There is also a video on youtube that explains how to monitor mongoDB (embedded at the end of this article).
After installing Pandora FMS, you can download the MongoDB plugin so as, Pandora FMS can execute checks and display all the statistics information in agent monitors.
This plugin recurs to mongostat internally in order to gather some basic statistic information. Most of the values returned by this tool are a must in any performance statistics monitoring system for MongoDB. It has a configuration file which can configure Mongostat commands to pick certain data. It simply executes Mongostat for each instance entry in the .conf. It also parses all of the important values into software agent modules, XML formatted, ready to be sent to Pandora FMS Data Server.
The prebuilt plugin uses mongostat to gather some basic statistic information so you can have a history graph with all the info throughout time
Thus, we can download these prebuilt checks anytime, without having to develop them by ourselves. This is how the mongoDB module looks at Pandora FMS library:

We assume that you have Pandora FMS server installed (if not, try the preconfigured virtual machine with Pandora FMS to do a quick deploy/test). You need to install a Pandora FMS agent in the mongoDB server, and you also need to install (download) the Pandora FMS mongoDB plugin.
After downloading and decompressing the plugin (rar file), you will get a perl script (.pl), a configuration file (.conf) and the documentation for using the plugin (libreoffice .odt). Skip the manual, it is huge.
Edit the mongoDB configuration file. The configuration file has several lines, you only need one. Use the following line that we show as example:
mongodb_stats mongostat;check_dbstats;;localhost;27019
If the plugin, Pandora FMS agent and mongoDB are being executed in the same server, the above line should be enough. Otherwise, you will probably need to change the hostname/port to point where your mongoDB server is running. Remember mongostat must be placed in the same server where the Pandora FMS agent is running the plugin.
Once the mongo plugin configuration file is configured, copy the plugin and the configuration file in the agent plugin directory. Rename both of them to easier names, like “mongo.pl” and “mongo.conf”, and copy them to /etc/pandora/plugins
Now, edit the default Pandora FMS agent configuration file: /etc/pandora/pandora_agent.conf
Use this line:
module_plugin /etc/pandora/plugins/mongo.pl /etc/pandora/plugins/mongo.conf
Restart the pandora agent:
/etc/init.d/pandora_agent_daemon restart
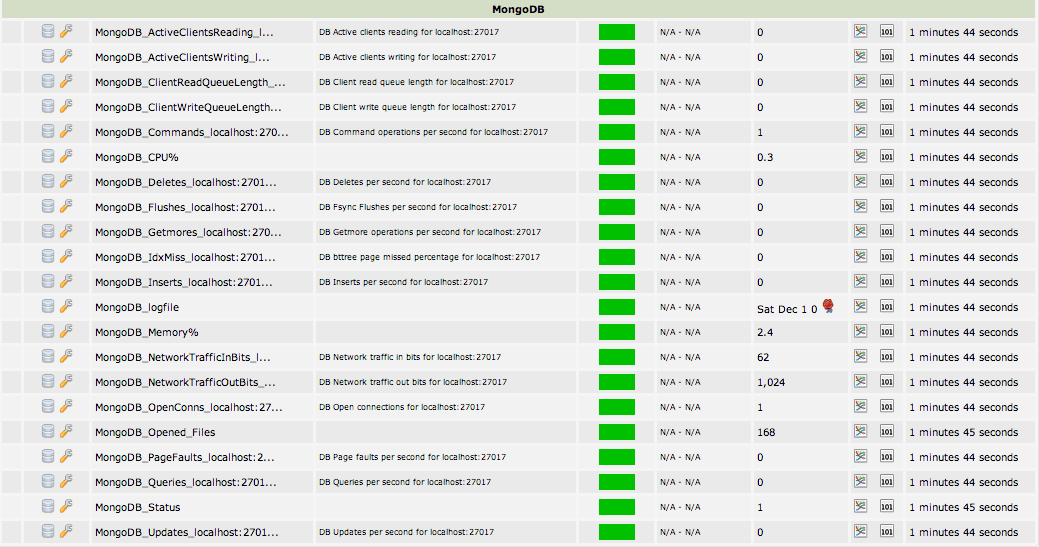
Hold on for 5-10 seconds before searching for the information about mongoDB in the agent you just installed. It should look like this:

All the checks are now executed and all their results are stored in the data history of each module.
There are many things that we can do with all this information. One of them is to display the graphs for each of the modules by using their data history.
If you click on the graph button (at the right side of each module), you will see default graphs for a module on simple window displays.

MongoDB system monitoring
All the previous monitoring metrics are about performance. What happens with the most “basic” and important metrics like “Is my server alive?”, “how much memory is taking my server?” or “what about CPU usage?”. If MongoDB is being monitored properly, it is not a big deal. You also can have your daemon logs monitored. For that purpose, we will use a few “handmade” modules in Pandora.
Edit your /etc/pandora/pandora_agent.conf file and add the information below. Restart the Pandora FMS agent to get the configuration loaded into the agent.
module_begin
module_name MongoDB_Status
module_type generic_proc
module_exec ps aux | grep mongod | grep -v grep | wc -l
module_end
module_begin
module_name MongoDB_Opened_Files
module_type generic_data
module_exec lsof -l | grep mongod | wc -l
module_end
module_begin
module_name MongoDB_Memory%
module_type generic_data
module_exec ps aux | grep mongod | grep -v grep | awk ‘{ print $4 }’
module_end
module_begin
module_name MongoDB_CPU%
module_type generic_data
module_exec ps aux | grep mongod | grep -v grep | awk ‘{ print $3 }’
module_end
module_plugin grep_log /var/log/mongodb/mongodb.log MongoDB_logfile
At this point, you will not probably need more explanations, but here we go!
- _MongoDB_Status_: it reports “1” if it is running and “0” if it is not. It will raise an event if the server is down. In that case, a beautiful red box will appear in your screen.
- _MongoDB_Opened_Files_: It counts the total files opened by mongoDB. It is useful to identify resource bottlenecks and the system overhead.
- _MongoDB_Memory and CPU %_: It shows the system perspective of the total % of CPU/Memory used by mongoDB in the system. They are very useful to control the system impact of MongoDB in your server.
- _MongoDB_logfile_: It sends all logfile information to Pandora FMS. If something happens, you can be sure that you will have all the information available.
After implementing this monitoring, your mongoDB will be fully monitored. Look at the screenshot. Doesn’t it look nice ?

Receive reports, sms and emails with all the info about your mongoDB updated and be warned in real time if something goes wrong
Now, you will be probably thinking about how nice would be to be warned by mail/sms if something goes wrong. Or how nice would be to receive a weekly report with the average load of the server. The good news is that you can have it. You just have to check Pandora FMS manual to learn how to do it! Anyway, by now the most important issue is solved: you got your mongoDB server monitored!
Monitoring MongoDB step by step
http://www.youtube.com/watch?v=J-yrpz5nd5c
Pandora FMS’s editorial team is made up of a group of writers and IT professionals with one thing in common: their passion for computer system monitoring. Pandora FMS’s editorial team is made up of a group of writers and IT professionals with one thing in common: their passion for computer system monitoring.


