Find out what VMWare is and how to include it in monitoring
Before we dive into how to monitor virtualized environments with VMWare, let’s clarify a couple of concepts for those who are less into the subject, starting withWhat is VMWare?.
VMWare is a software product development company, mostly related to virtualization, and more recently to containerization, although this is beyond the scope of this article. Today, we are going to focus on monitoring virtualized environments with VMWare.
To do this, the first step would be to know what virtualization is. A quick summary, and a bit imprecise I must say, but that will give you a general idea. We can claim that virtualization is like dividing the components (CPU, Memory, Disk, etc.) of a physical computer or server (which we will refer to from now on as Bare-Metal) into virtual or emulated components. This will allow us to share the same component between different instances which we will call “virtual machines.” That way, using a single set of hardware, you may have different virtual machines running different versions of operating systems, applications, libraries, etc. simultaneously and separate from each other.
The interesting thing about this is that, for the virtual machine (which we will refer to as VM from now on), the resources that have been assigned to it are only from it and are real elements. This opens a world of possibilities, it allows you to have many services and virtual machines running on a single hardware device with the energy, space and cost savings that this implies. In addition, since it is all at software level, it will allow you to manage the machine as one more file inside the computer, being able to copy it, modify it or even package and distribute it.
The advantages of virtualization are more than proven and today almost any service and infrastructure runs mostly on virtual servers. A very clear example is when you go to your favorite cloud provider and click a button to activate an instance of a database or a server, actually what you’re doing is activating a virtual machine that it already had pre-configured and that can work for you in a matter of seconds, thanks to this technology.
Due to these types of advantages, and because of the massive distribution of virtual machines in most ecosystems, it is so important to have a monitoring tool capable of adapting to this type of environment efficiently.
Now that we know what virtualization is, we will see a new concept. We already said that from a physical machine we can emulate and subdivide its components to create instances of smaller virtual machines, and it is true, although there is a small nuance, we require software devoted to this, we call this software hypervisor.
There are different types, manufacturers and features we are not going to delve into today. If you are interested in this topic and want us to do a more detailed article on virtualization leave it in the comments
vSphere
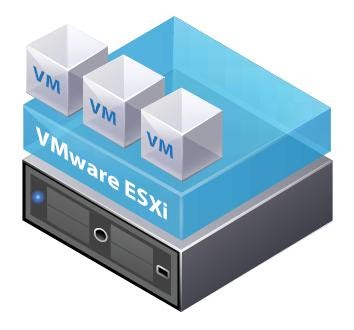
Today we will focus on one of VMWare’s most widespread and well-known products: the vSphere suite which, according to Wikipedia, “is VMware’s core business suite, the cornerstone on which almost all the business products they offer rely on. It consists of the ESXi virtualization software that is installed directly on the servers and the centralized management console vCenter.2020 ”
As we have seen, vSphere is the name of the set of tools that VMWare offers for device virtualization, there is a range of different vSphere environments, from a single ESXi server that works as a hypervisor as well as management.
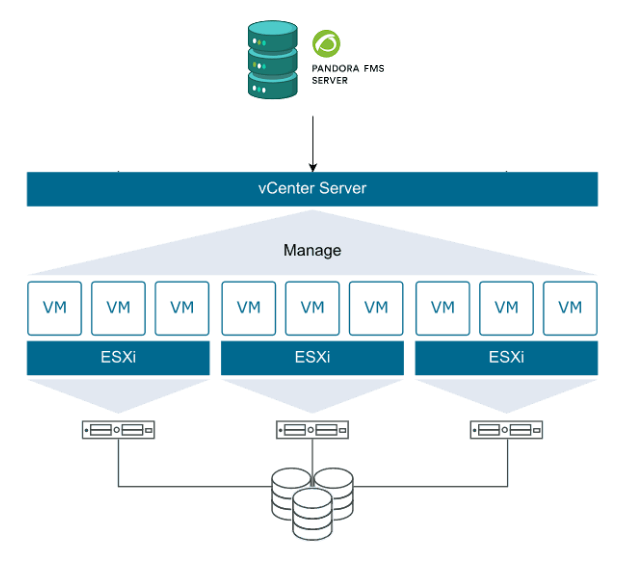
To much more complex environments where several ESXi work in parallel being managed by a centralized administration software called vCenter.
Virtual environment monitoring
To monitor virtual environments, whether it is from VMWare or not, there are two main ways.
The first is to treat each virtual machine as an independent machine, attacking its operating system with standard protocols or using some monitoring agent.
This approach does not require for the tool have a special or devoted management, since it will deal with each VM as any other machine. Along this approach, we can say that we will interrogate the operating system, therefore, in heterogeneous environments, we must define metric captures for each system.
The second way is more general and allows deploying monitoring very quickly and efficiently. In this case we will integrate the hypervisor, since it has information on all the machines it contains and we can interrogate it directly. For each manufacturer the protocol, the responses and the format with which we will interrogate the hypervisor may vary, but in most cases they have an interface to communicate with it. Along this approach, it is the monitoring tool that must be adapted and have a connector to communicate with the supervisor in a centralized way.
Of course, Pandora FMS has both types of monitoring, being able to combine them if necessary if deep and detailed monitoring is required.
In today’s case, we will see the monitoring integrated in Pandora FMS Enterprise Discovery tool. That will allow us, in a very simple way, to connect well, either with a standalone ESX or with a vcenter, through the vmware SDK.
vSphere Monitoring with Pandora FMS
Starting from the fact that we have a Pandora FMS Enterprise instance, the steps are very simple: by default Pandora FMS has the necessary libraries to connect to a VMWare environment, you only need a user account with reading permissions and connectivity with the ESX or vCenter as the case may be.
Once you fill in the simple form with the data from our VMWare environment:


You will see a window to configure some monitoring data, such as the scan interval for new machines, the execution threads that you will devote to this task, if you want to activate network monitoring and (only for vcenter), if you want to capture the environment events.
You will also have a field for extra configurations that will allow you to add advanced configurations related to the task (you can see the possible configurations:
https://pandorafms.com/manual/en/documentation/03_monitoring/05_virtual_environment_monitoring?s[]=vmware#vmware 1 plugin ocnfiguration ).

Once finished, you will be able to see that a task has been added to Pandora FMS task list, where you will be able to see its last execution, enable it, disable it or force task execution manually.

The default task will give you information about all the ESXs (in the case of vcenter), virtual machines and datastores available in the vmware environment that you configured, returning the following metrics:
Default monitoring for Datacenter:
- Ping
- Check 443 port
Default monitoring for Datastore:
- Capacity
- Free Space
- Disk Overallocation
- Free Space Bytes
Default monitoring for ESXi:
- CPU Usage
- Memory Usage
- Received data
- Transmitted data
- Disk Read Latency
- Disk Write Latency
- Host Alive
- Disk Rate
- Net Usage
Default monitoring for virtual machines:
- CPU Usage
- Memory Usage
- Tools Running Status
- Host Alive
- Disk Free
- Disk Read Latency
- Disk Write Latency
- Received data
- Transmitted data
- Net Usage
In addition to the metrics described, you will also have a specific view for monitoring vSphere environments that has compilation information on the general state of the environment and each monitored ESX and even a map of the monitored infrastructure.


As you can see, it is very easy to start monitoring a vSphere environment with Pandora FMS, just follow a few steps and you will have your VMWare monitoring integrated quickly and easily.
If you are interested in knowing in more detail how synthetic transactions are configured and executed with Pandora FMS, do not hesitate to visit our YouTube channel, where you may find different contents such as tutorials, workshops and a lot of other resources devoted to this and many other topics related to monitoring.

Project Manager at Pandora FMS. More than 15 years of experience in the IT world. Lover of technology and open source, DevOps culture. Fan and promoter of automation, containerization and container orchestration. Project manager in Pandora FMS. More than 15 years of experience in the IT world. Technology and open source lover, DevOps culture. Fan and promoter of the automation, containment and orchestration of containers.