Pandora FMS SNMP trap monitoring
As network technology evolves, the SNMP world evolves with it. They create new network hardware that contains more and more OIDs to be able to stay updated on the status of more details of the product. This entails the need to automate the way to control every detail, doing it through the use of SNMP trap monitoring.
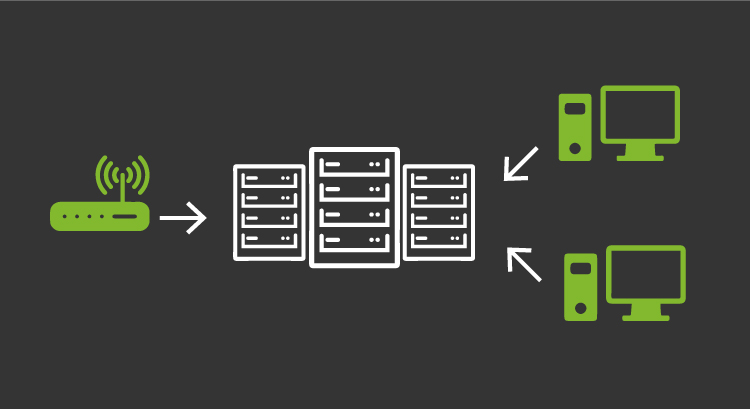
An SNMP trap is a message sent by an SNMP device to a configurable IP address when there’s a change or an event on the device. This message is sent asynchronously, that is, it is sent at the same time the change or event took place, without waiting for a minimum set of time and without having to send any type of information if there are no changes or events.
In order to properly monitor SNMP traps, several factors must be taken into account:
- You will have to have the manufacturer’s MIBs to be able to convert the OIDs sent by the traps and thus have a description of the element that is failing.
- You will have to know the “normal” values returned by certain OIDs, such as information input traffic through one of the Ethernet ports of a network device.
- It will be necessary to know the critical points of the device that you wish to monitor.
Once these factors are clear and you have such information at our disposal, Pandora FMS has an SNMP trap monitoring system.
Like any other monitoring done by Pandora FMS, the server will have to be configured so that it can receive and treat the traps that it receives from the different SNMP devices.
Pandora FMS uses the snmptrapd daemon, whose parameters will have to be configured as needed to be able to collect information from all the received traps. Within this configuration, it is worth highlighting the importance of knowing the levels of traps that will be received, as well as the community of each one of them in order to obtain the information received.
Once you have everything assembled and the correct server configuration to be able to see the data that arrive to Pandora FMS SNMP console, you can start monitoring SNMP traps.
SNMP Console
In the first place, we will talk about trap display within Pandora FMS. Inside the SNMP console, you can see the most relevant fields of a trap:
- Trap status: It can be either validated or not validated.
- Agent: In this case there are two possibilities. The first is that it is an IP that Pandora FMS has not yet monitored, so only the IP will appear; the second is that there is an agent within Pandora FMS with that IP, so the agent’s alias will appear.
- Enterprise String: You can see the OID of the sent trap or, if you have the corresponding MIB, its translation.
- Value: You can see the value returned by the trap.
- Date: You can see the trap’s arrival date to Pandora FMS server.
- Alert: If there are alerts configured within Pandora FMS, if a trap matches it and triggers the alert, it will be visible.
With this you can see the traps that come to Pandora FMS, but what’s the most important thing? How can we carry out SNMP trap very own monitoring actions?
SNMP alerts
In order to automate as much as possible, Pandora FMS includes SNMP alerts.
Pandora FMS SNMP alerts are very flexible and allow for customized SNMP trap monitoring. When configuring an SNMP alert, you have to choose the degree of detail you want in order to cover more or less cases within the same alert.
The fields that you have to configure would be the following:
- Entreprise String: Where to place the OID that you want to monitor. The more general the OID, the more cases it will apply to.
- Agent: Where to place the IP associated with the trap. This field, unlike the previous one, is more restrictive, you’re allowed to only choose one IP.
- Trap type: Less restrictive field, which will tell you what the event that marked the trap is.
Once you have the matchable part of the alert, choose the action to perform, as well as enter the necessary parameters for the required actions.
Let’s take an example of real SNMP trap monitoring. Suppose you want to monitor your network device. In particular, you know that there is something wrong with the flow of information of one of its Ethernet ports, which gets disconnected. In this case, since we have properly configured the device to send us the information to Pandora FMS, we will see what a trap for the failure of OID X coming from IP Y looks like.
Since we have been farsighted, we already had an alert, in this case specific, with these parameters. The alert in this case had two associated actions: one that was sending an email to the systems manager to check the issue, and another that we manually configured to activate the port remotely and automatically from Pandora FMS.
So far we have seen what SNMP trap monitoring is and how to do it with Pandora FMS. Would you like to find out more about what Pandora FMS can offer you? Find out clicking here .
If you have to monitor more than 100 devices, you can also enjoy a FREE 30-day Pandora FMS Enterprise DEMO . Get it here .
Finally, remember that if you have a reduced number of devices to monitor, you can use the Pandora FMS OpenSource version. Find more information here .

Traductora a francés e inglés. Me encantan las lenguas. Amante de la ropa oversize, la tarta de queso y el chocolate caliente en invierno. Me gusta leer, escuchar música, viajar y explorar cosas nuevas. Mi frase más temida por aquellos que me conocen es “he estado pensando…”
Translator into French and English. I love languages. Lover of oversized clothes, cheesecake and hot chocolate in winter. I like reading, listening to music, travelling and exploring new things. My most feared phrase by those who know me is “I’ve been thinking…”


