


What is Pandora FMS Open Source?
Pandora FMS Open Source is not a freemium software, it is not bloatware nor shareware (wink for those born before the 80s). Pandora FMS is published under GNU GPL 2.0 and the first line of code was written by the company’s current CEO in 2004. At that time, free software was in full swing and MySQL was still an independent company, as was SUN Microsystems. There are currently several thousand open source users downloading updates through our update system and using it on a daily basis. We do not know more because we respect privacy and because we have neither their name nor the company where you work.
Pandora FMS is a real free software. The project has been active in Sourceforge since 2004 and we have all the awards granted by this entity dean of Open Source. All the code is available on Github in real time, but the most important thing is the documentation we have, available in five languages (Spanish, English, French, Japanese and Russian) and with a level of depth that allows you to get the most out of it without having to pay for certifications, training or consulting. Printed, the manual has more than 1000 pages (per language) and is maintained by our professional development team, Q&A, translators and professional documentalists. We also have a public forum available where we solve questions, with more than 15,000 messages. We believe that freedom consists in offering users options, not just giving them part of the pieces of a puzzle without instructions.
Pandora FMS One
However, Pandora FMS has another version, different from the OpenSource version that is aimed at the business world. It is not only that it extends features regarding the OpenSource version, it is conceived for another type of user. The code of this version is not public, although there is a free version, limited to 50 agents, called Pandora FMS Free at no economic cost, but with all the features of Pandora FMS ONE. Pandora ONE features are oriented to demanding professional environments that require some automation and more specific tools already created to use them in operation and with professional support so that if something fails they may ask and get a patch if necessary. It is for these types of environments that we designed Pandora FMS ONE. If you want to use Pandora FMS OpenSource and have doubts about whether it will work for your organization: do not hesitate, it is not a question of size, we have users of the Open version with thousands of agents and who have been using it for years. One of the big differences between the OpenSource version and the ONE version is the time you will have to spend getting a system up and running and maintaining it over time, this is especially relevant regarding updates and patches. In the OpenSource version you will have to update yourself from code (Github) while in the One version everything is a click away with our Warp Update system. It is nothing special about Pandora, it happens in all OpenSource projects, but in monitoring, where you always have to be up to date, this time can be very relevant. In addition to updates and access to a support team to support you at all times, there are many other functional differences that can be key to optimize your day-to-day management and save you a lot of time. Below we describe some of the differential features of the ONE version compared to the OpenSource version. Should you wish to try them out yourself, you may try a 30-day trial version, but let us show you at an online meeting and you’ll save yourself the trouble. Your time is valuable and while our documentation is extensive, PFMS has plenty of features.Features
- Services
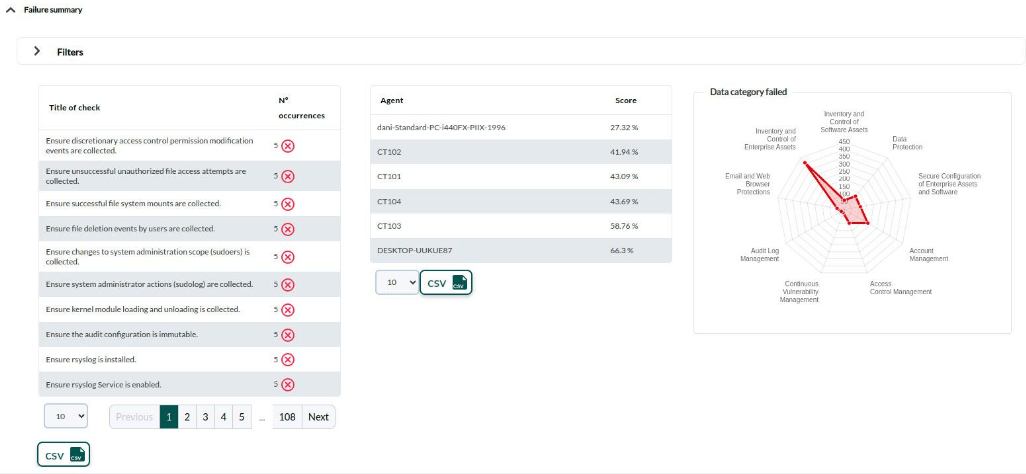
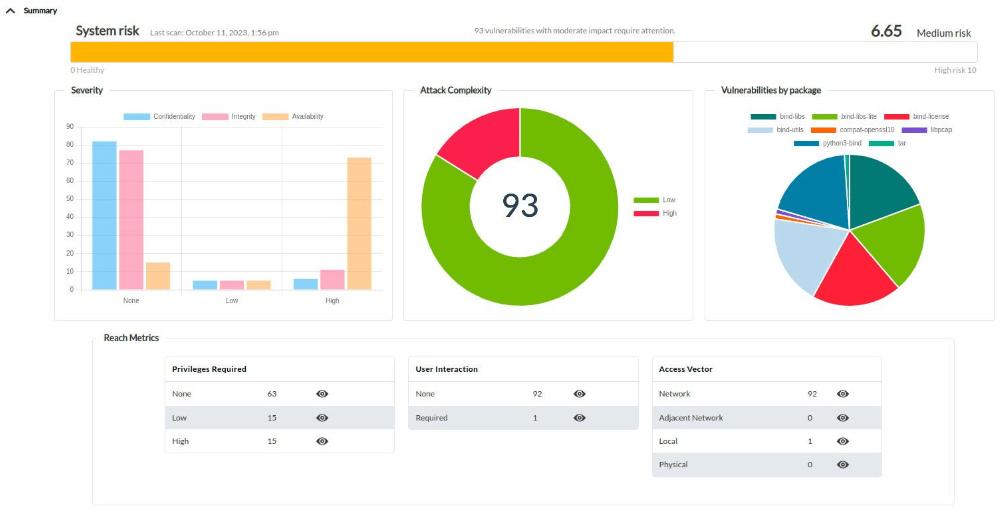
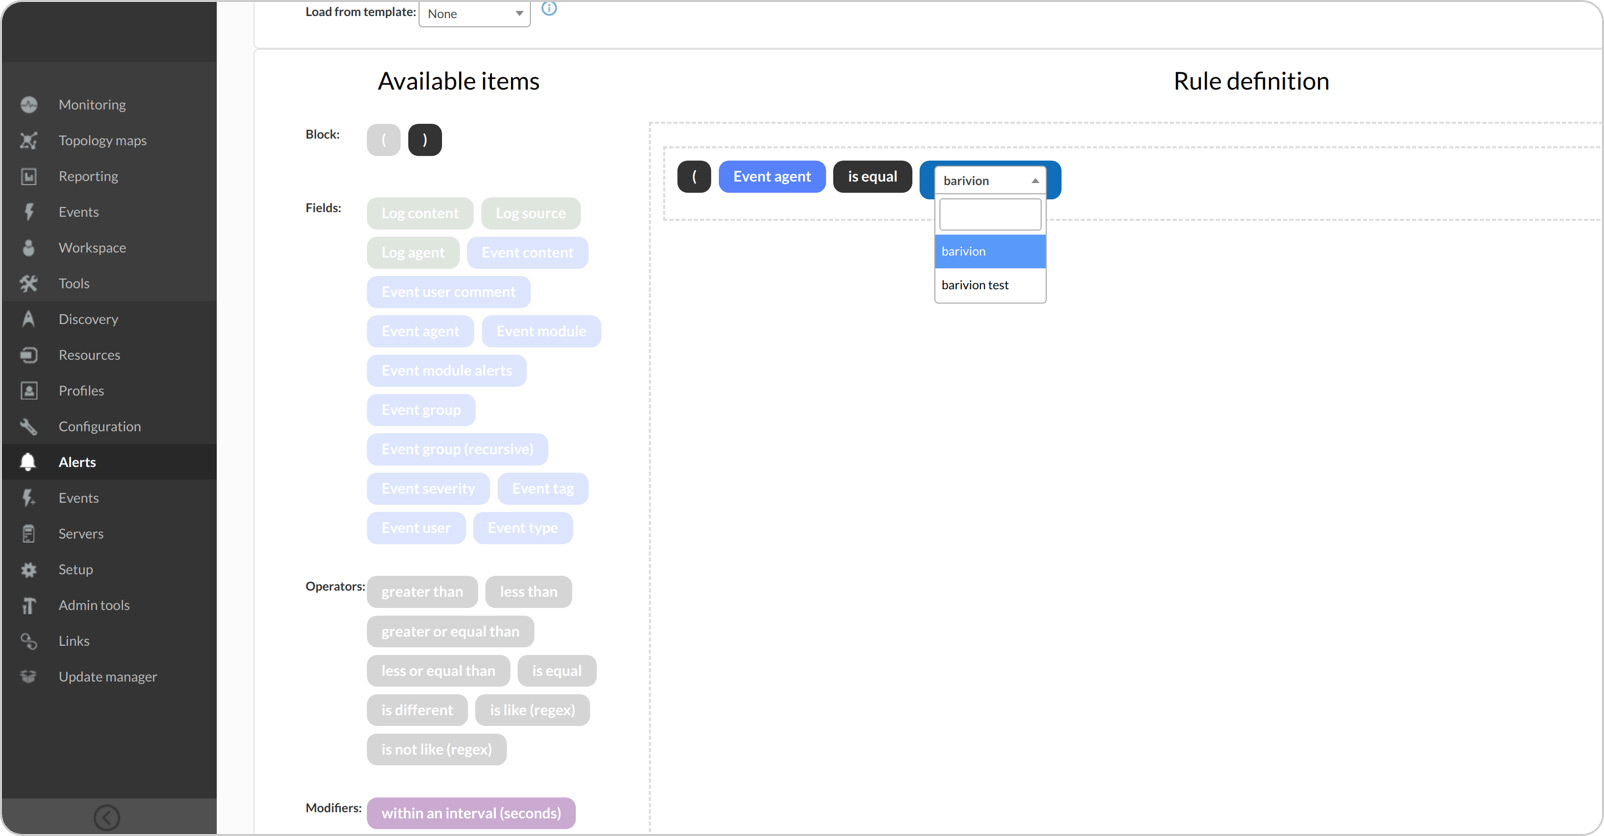
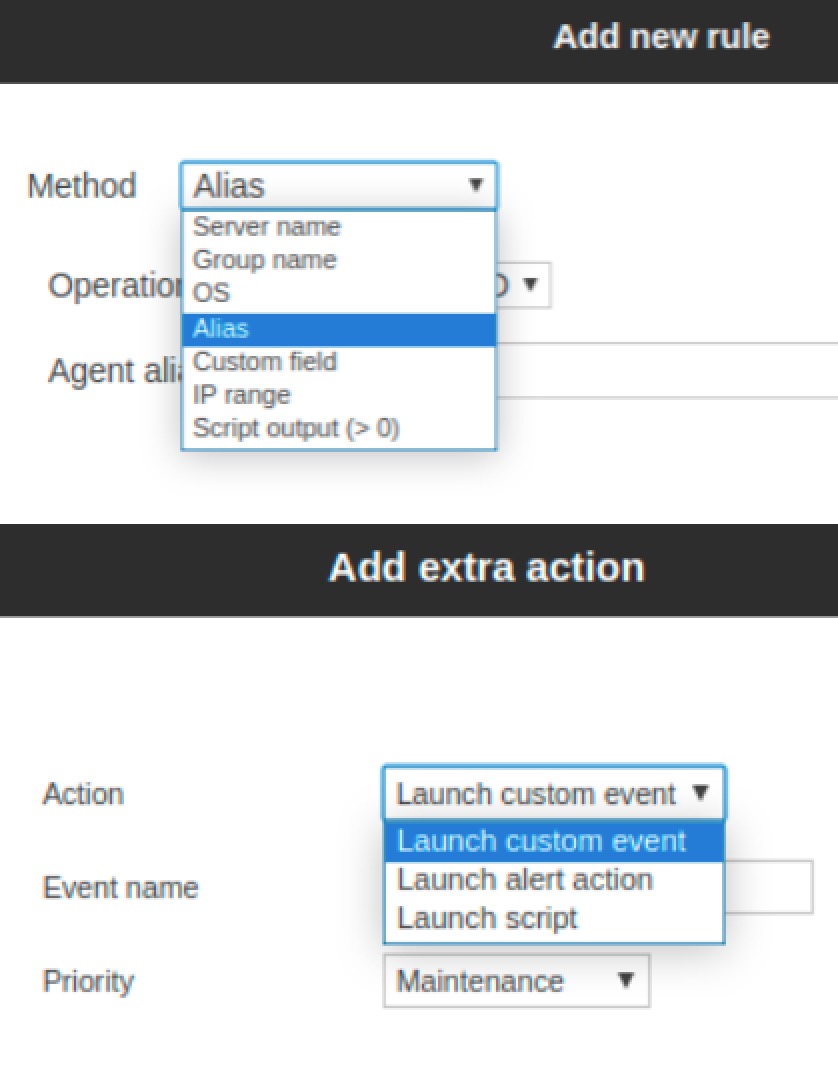
- Security monitoring
- Policies
- Customization and OEM
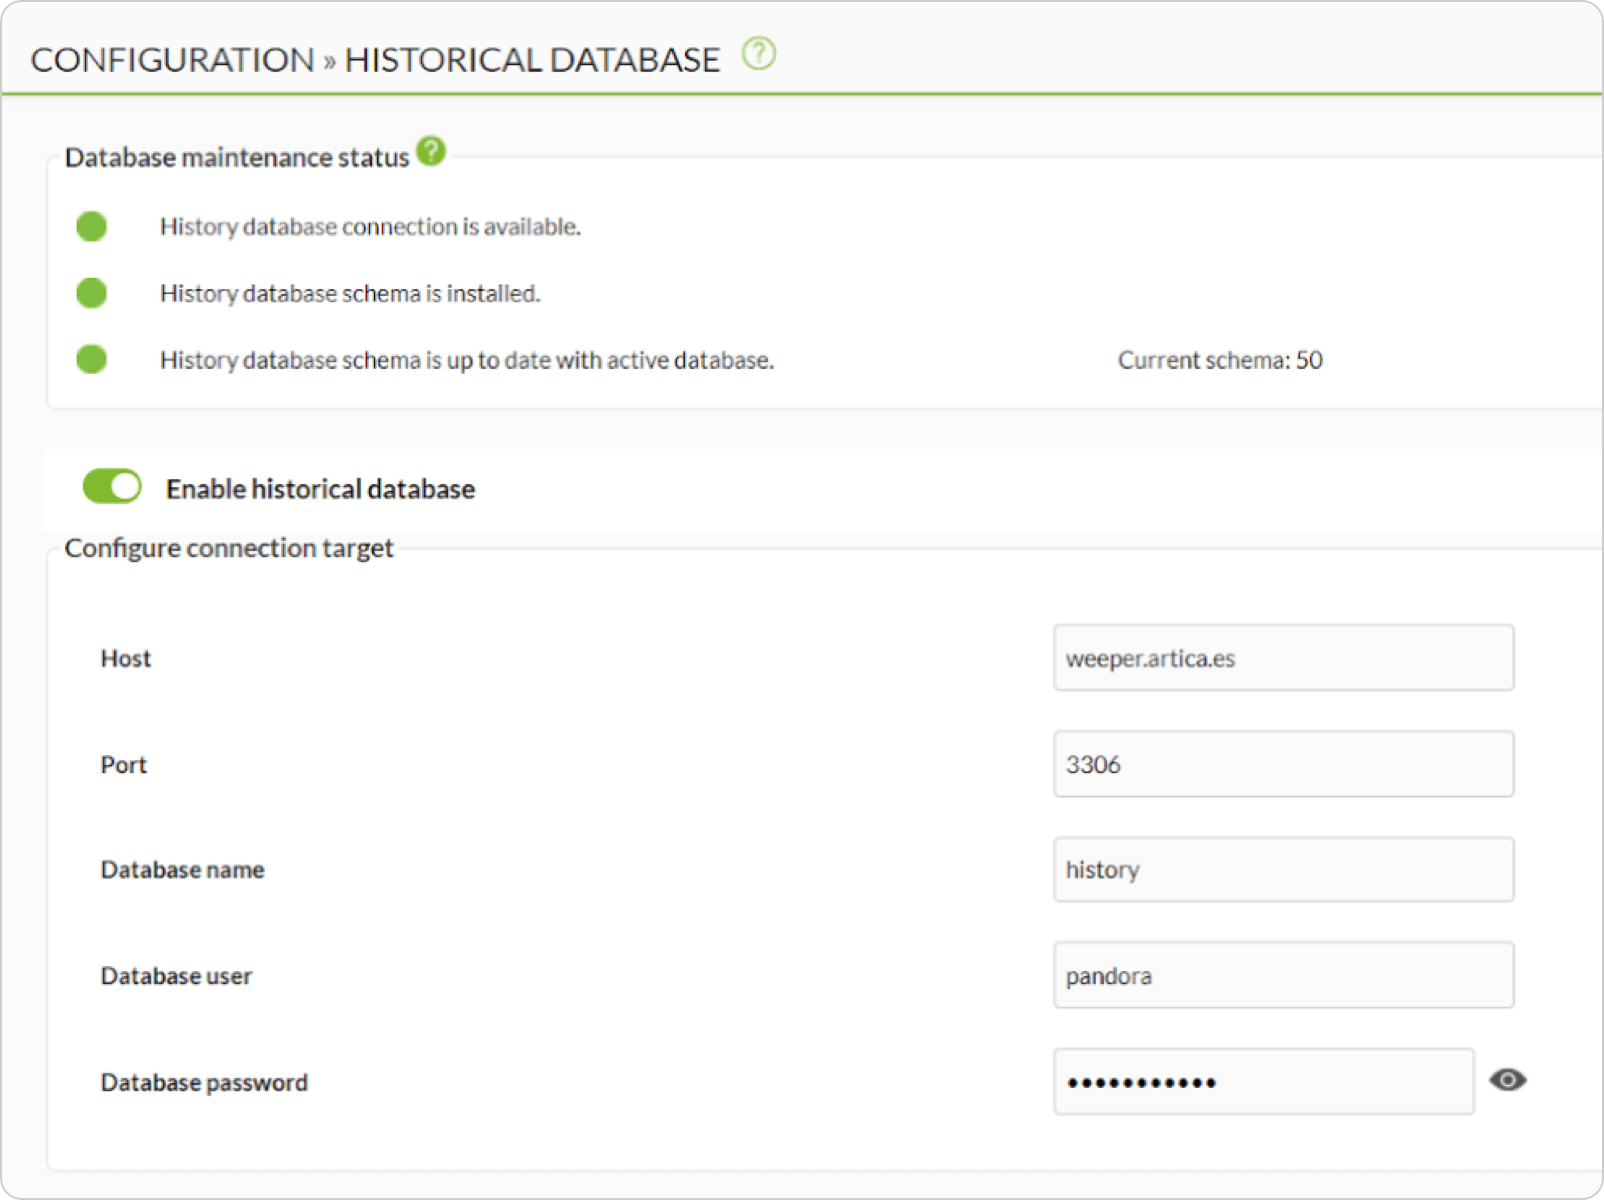
- History DB
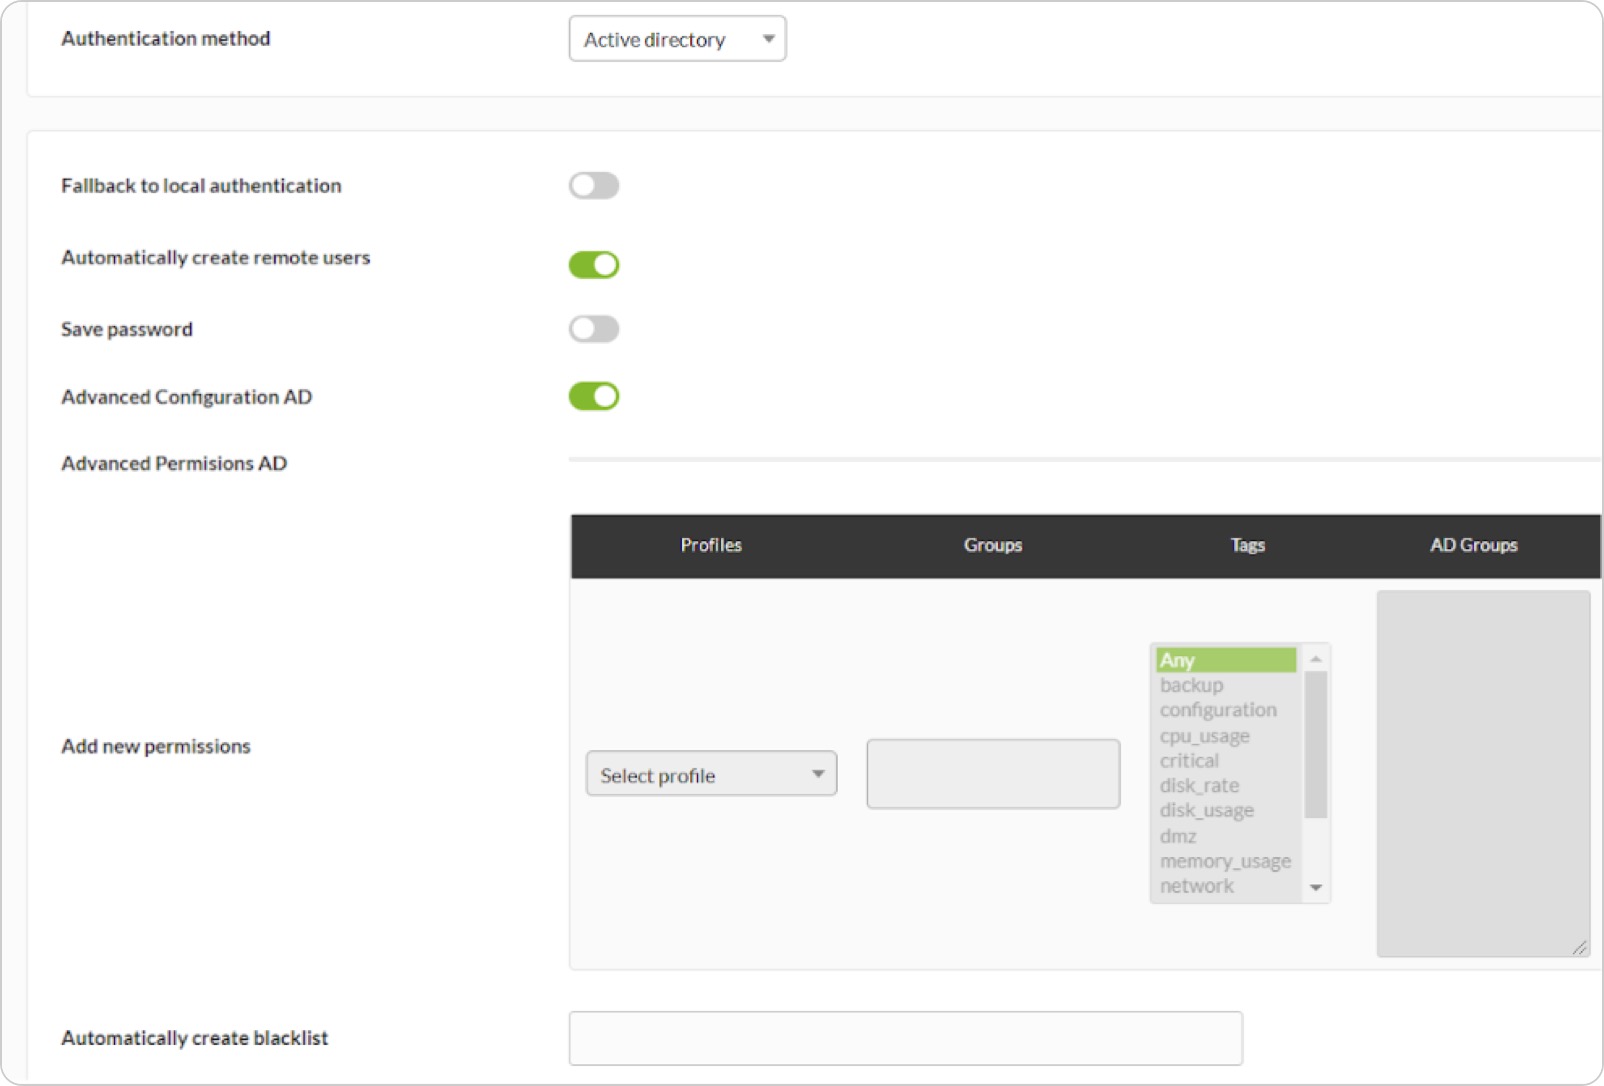
- Delegated authentication in Active Directory
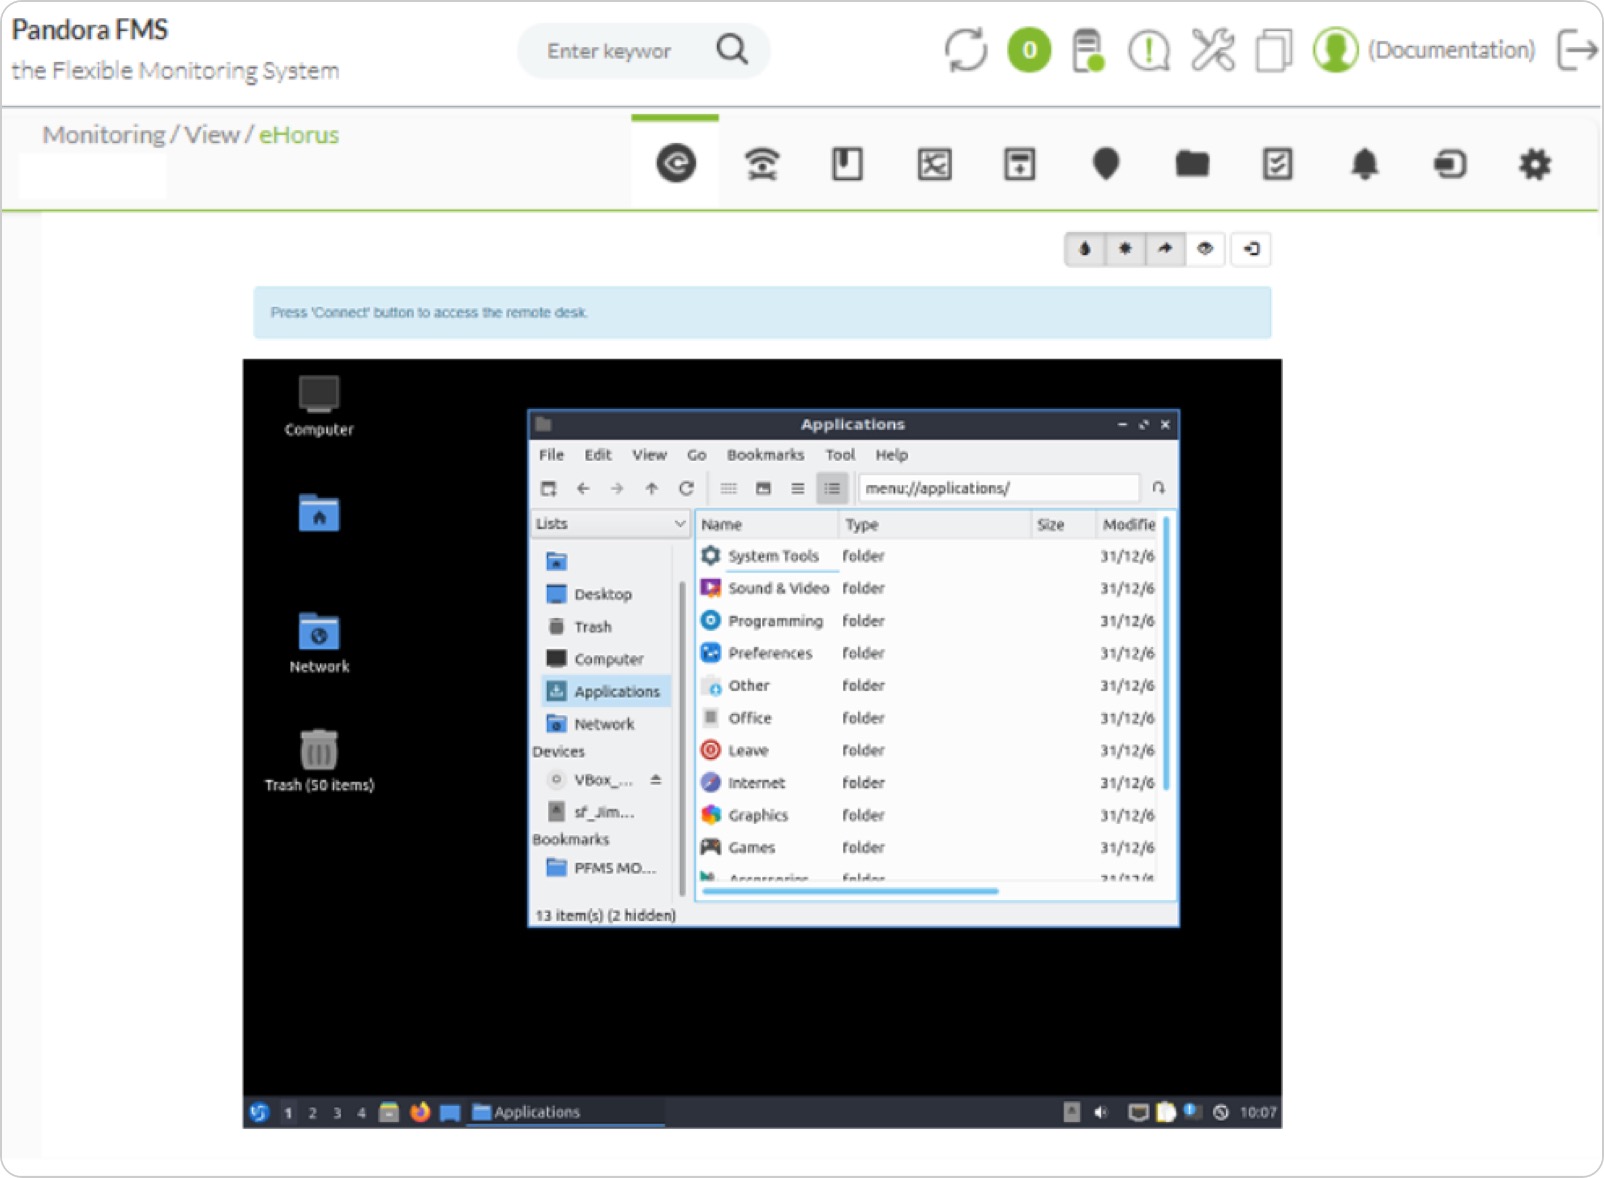
- Remote control
- Satellite servers
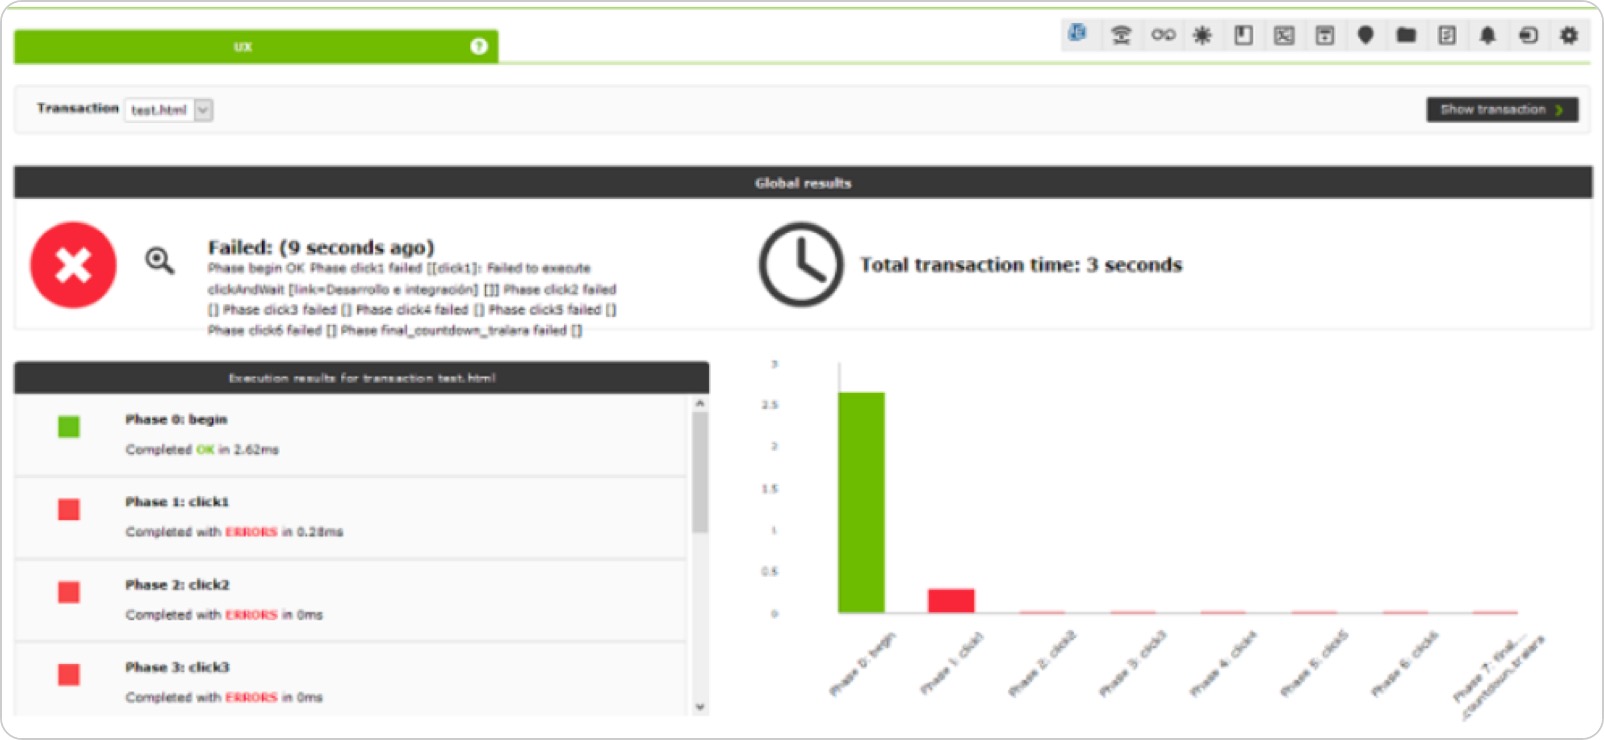
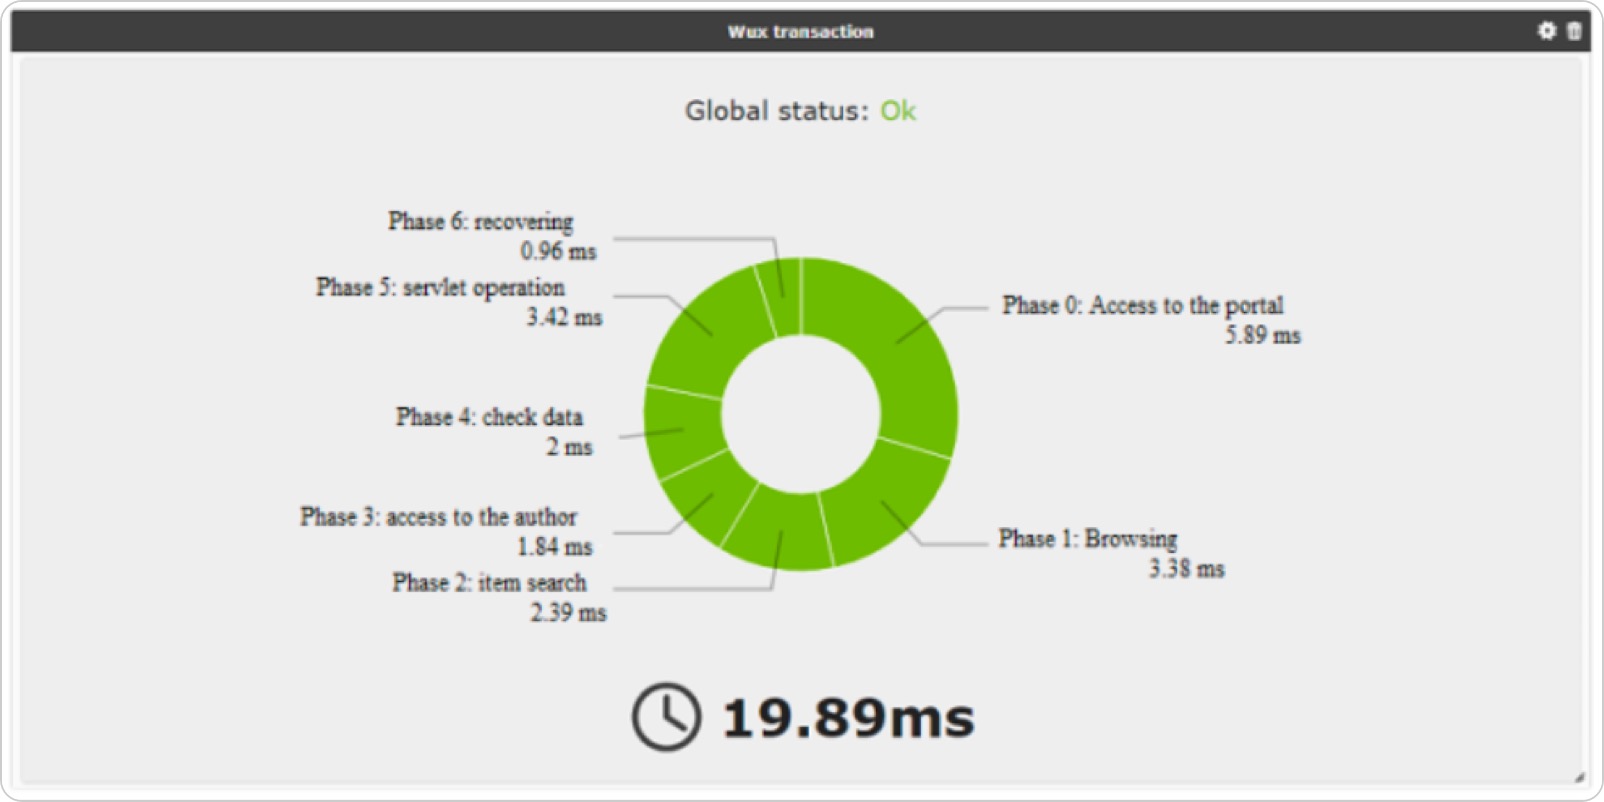
- User experience monitoring (UX)
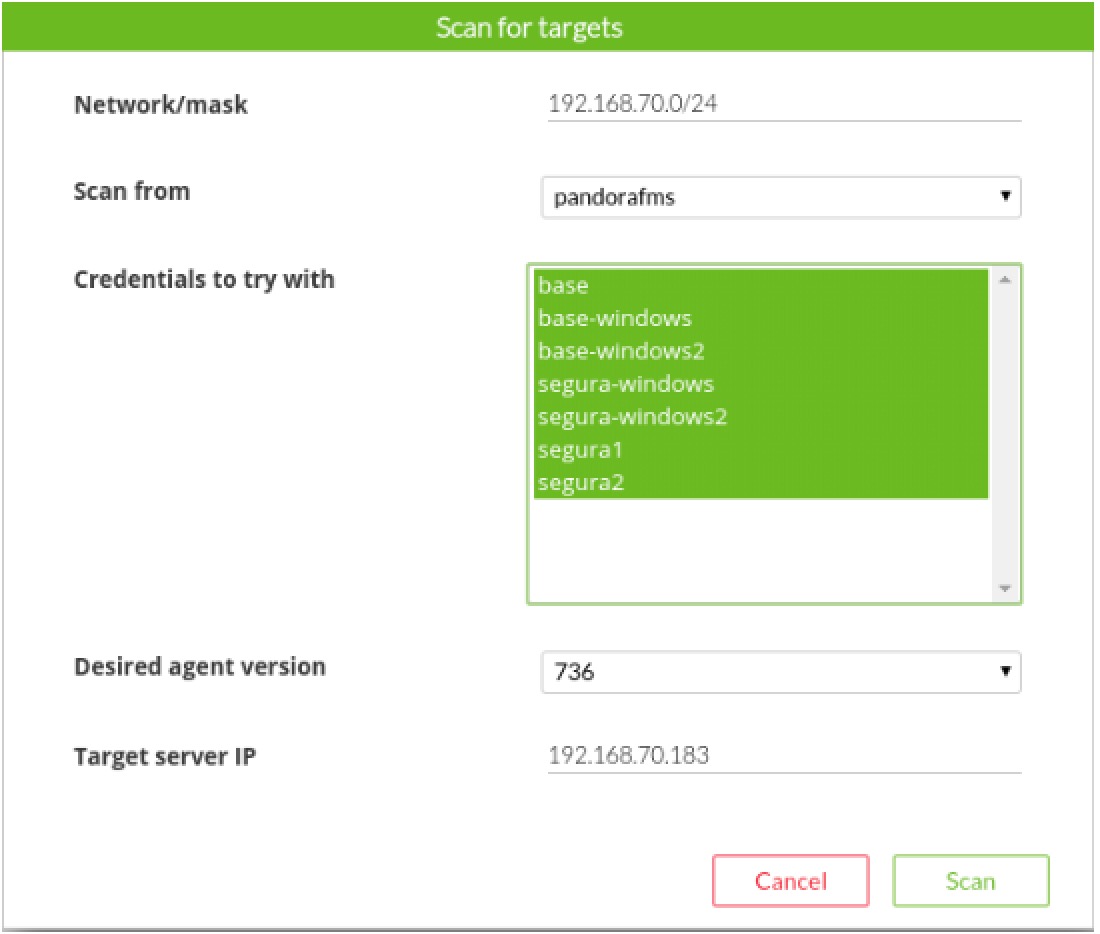
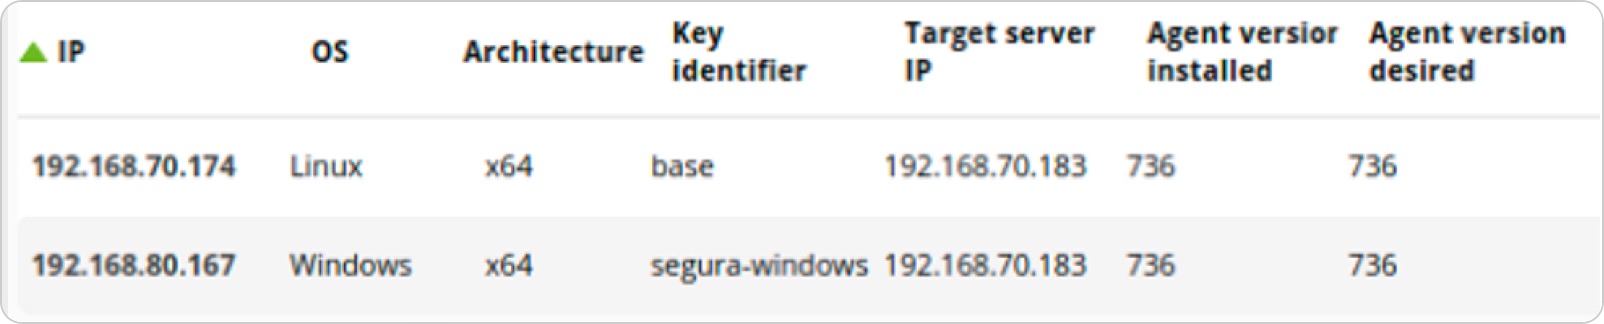
- Remote agent deployment
- RMM
- Auto provisioning and automatic agent configuration
- Collections
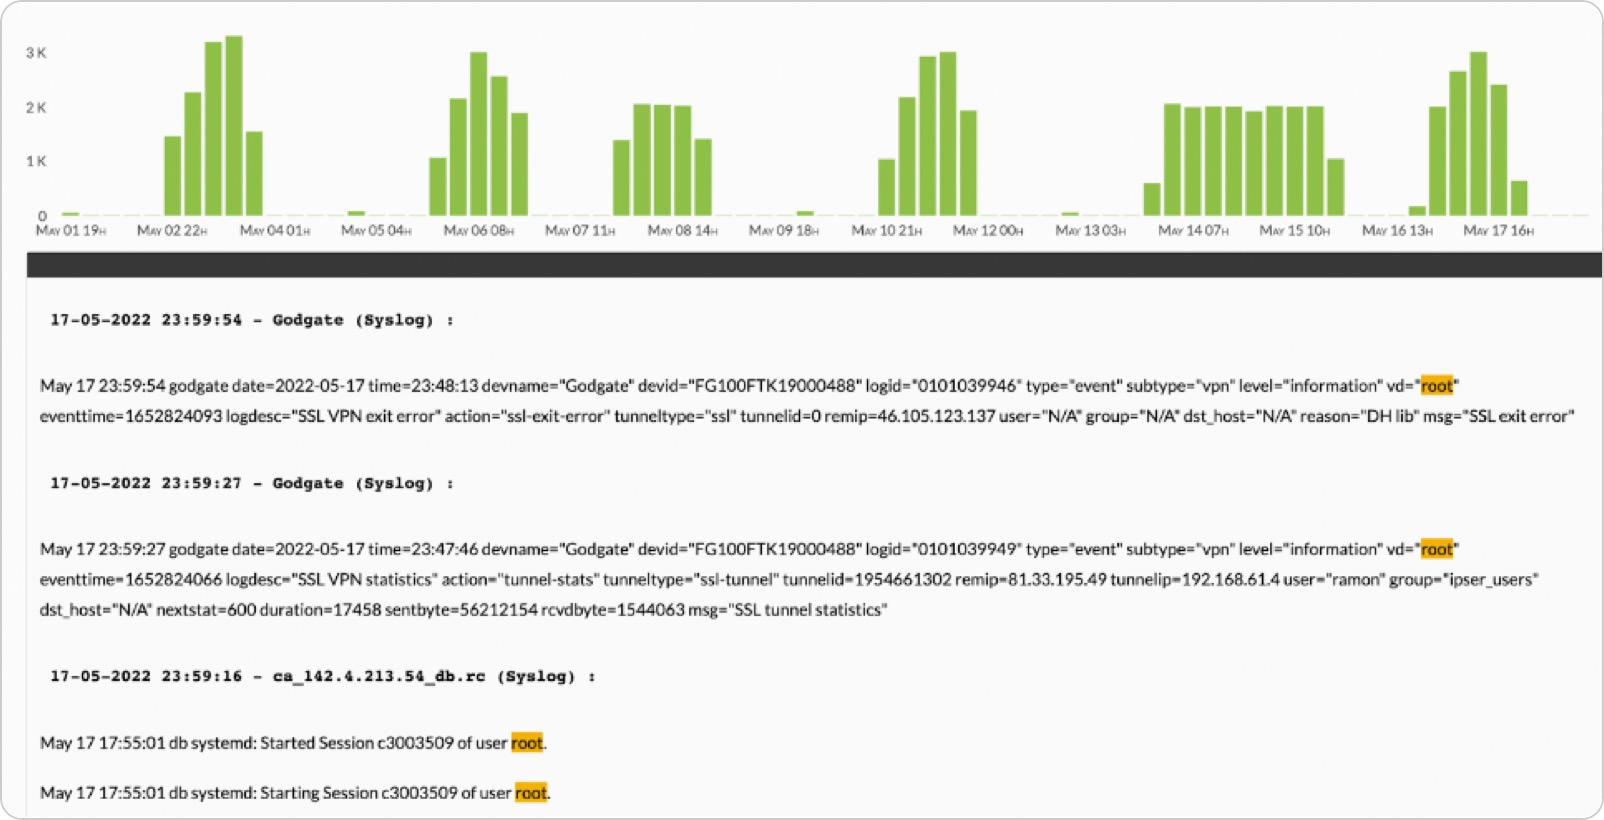
- Log collection
- Inventory alerts
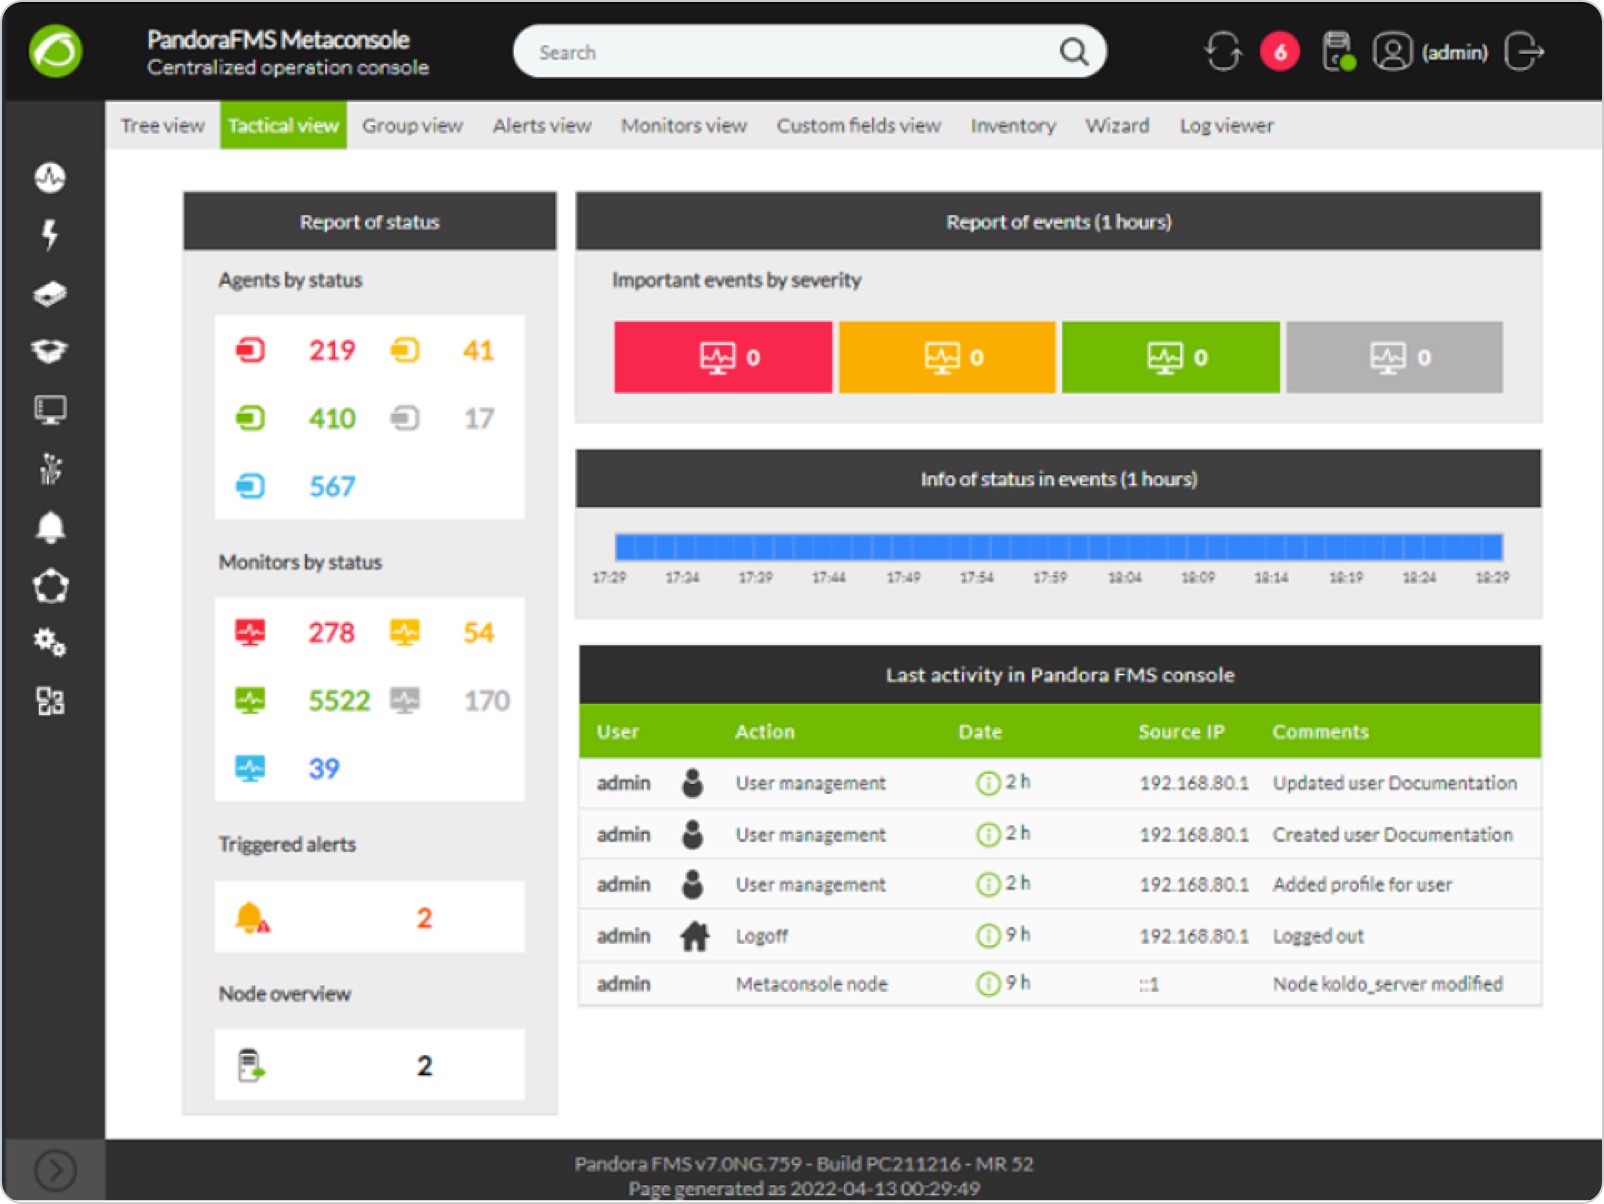
- Command Center
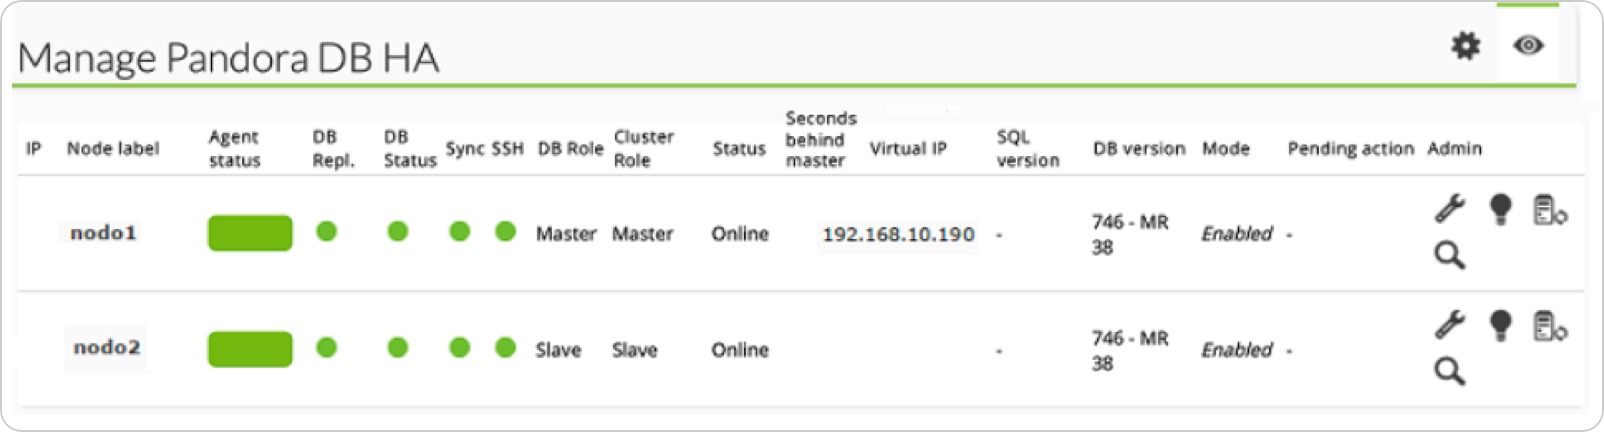
- High Availability (HA)
- Discovery Cloud
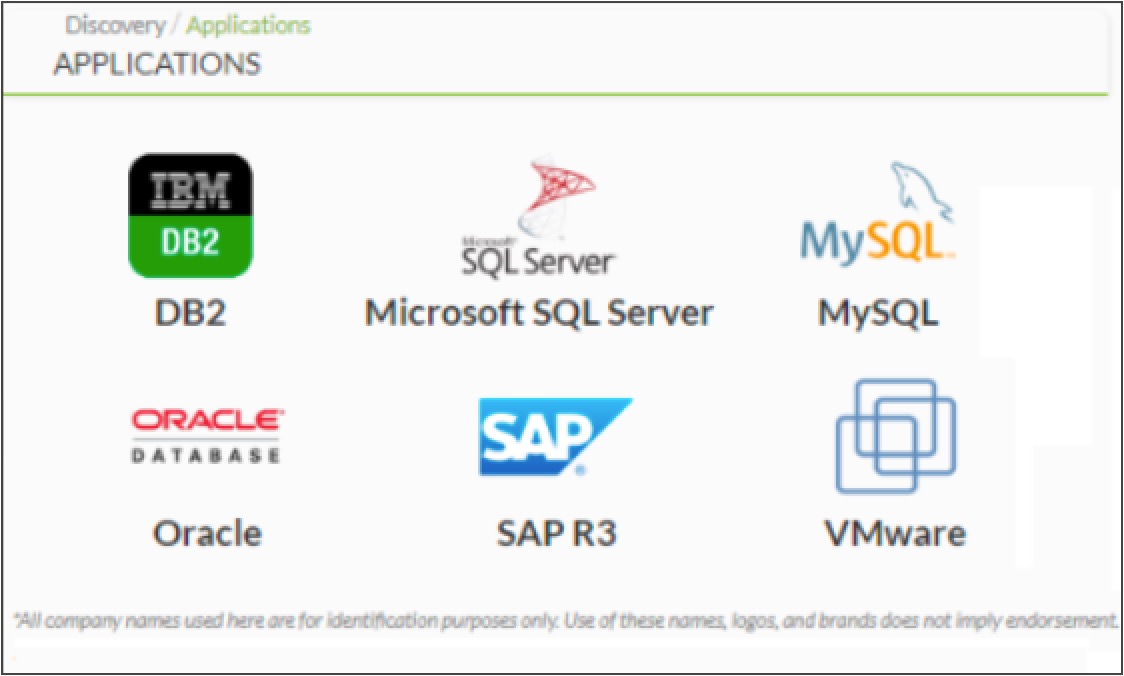
- Discovery Applications
- Enterprise ACL’s
- Comparison table Open Source vs ONE
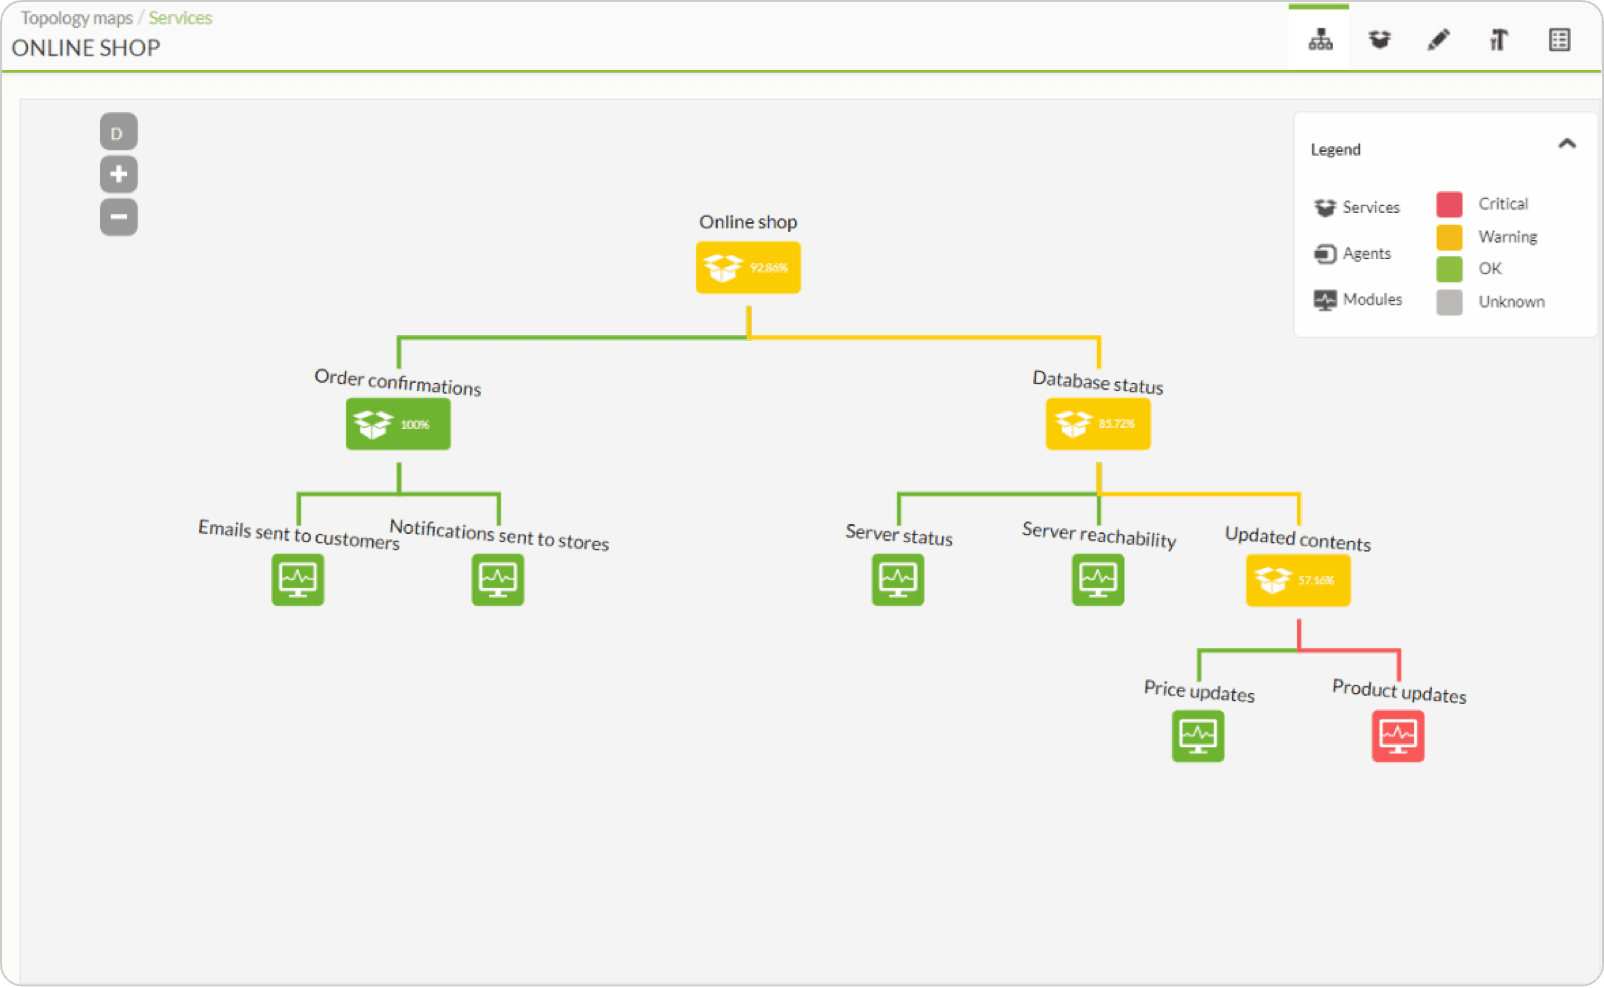 Services complement the existing display options in Pandora FMS and allow system managers to define weight rules that have the their systems’ redundancy to alert only in case of need, not when something unimportant fails.

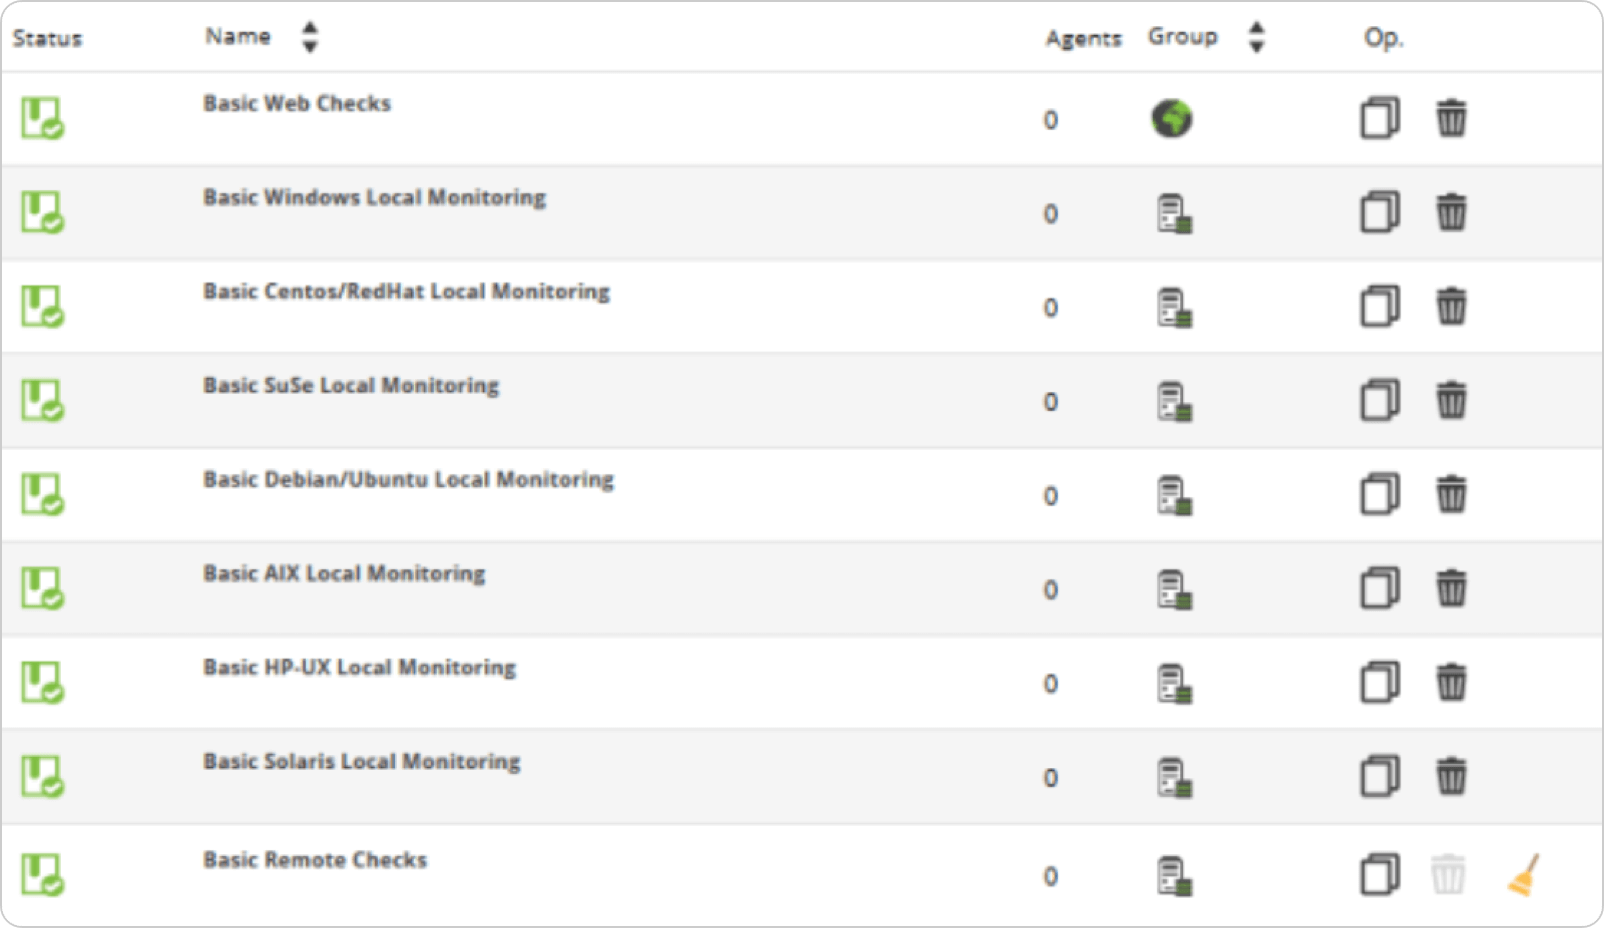
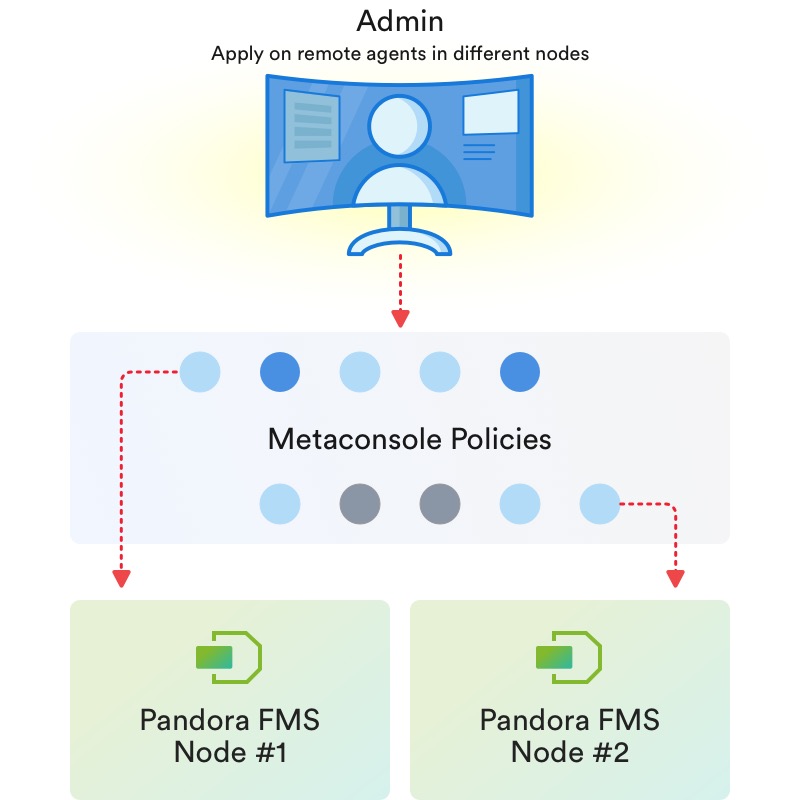 Thanks to the policies, it is possible to homogenize monitoring and to deploy a standard monitoring by technologies.
Thus a system can have different policies applied (e.g. base operating system, database, application X, network performance, etc.) and for every time you modify the policy, it can get “synchronized” with those systems that are subscribed to said policy, in a totally automatic way.
Of course, exceptions can always be made to policies at individual level, and each system can have unlimited policies in addition to custom monitoring. Using policy monitoring can save system administrators a huge amount of time.
Thanks to the policies, it is possible to homogenize monitoring and to deploy a standard monitoring by technologies.
Thus a system can have different policies applied (e.g. base operating system, database, application X, network performance, etc.) and for every time you modify the policy, it can get “synchronized” with those systems that are subscribed to said policy, in a totally automatic way.
Of course, exceptions can always be made to policies at individual level, and each system can have unlimited policies in addition to custom monitoring. Using policy monitoring can save system administrators a huge amount of time.
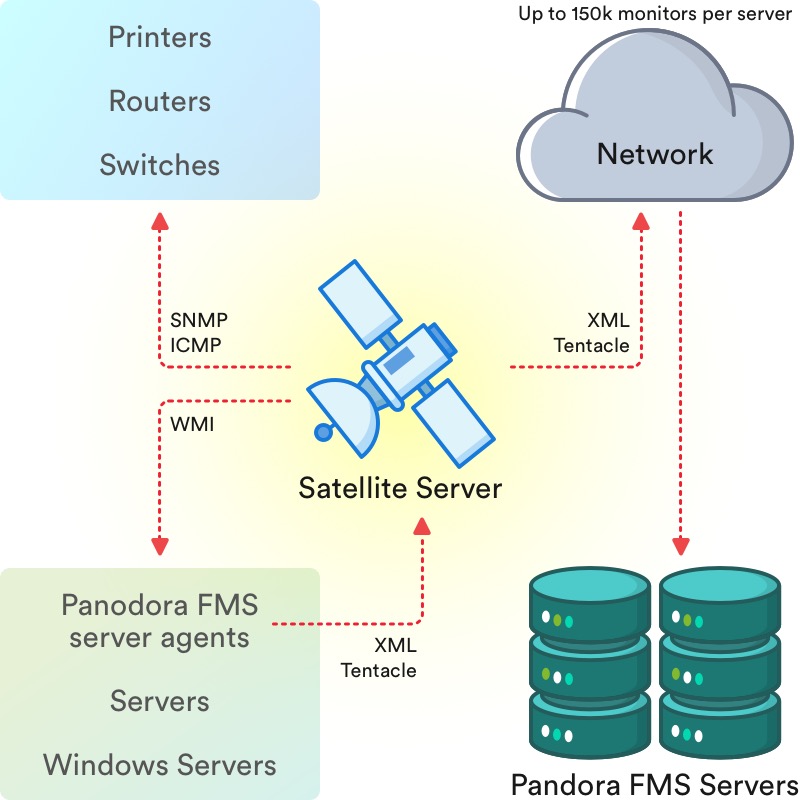
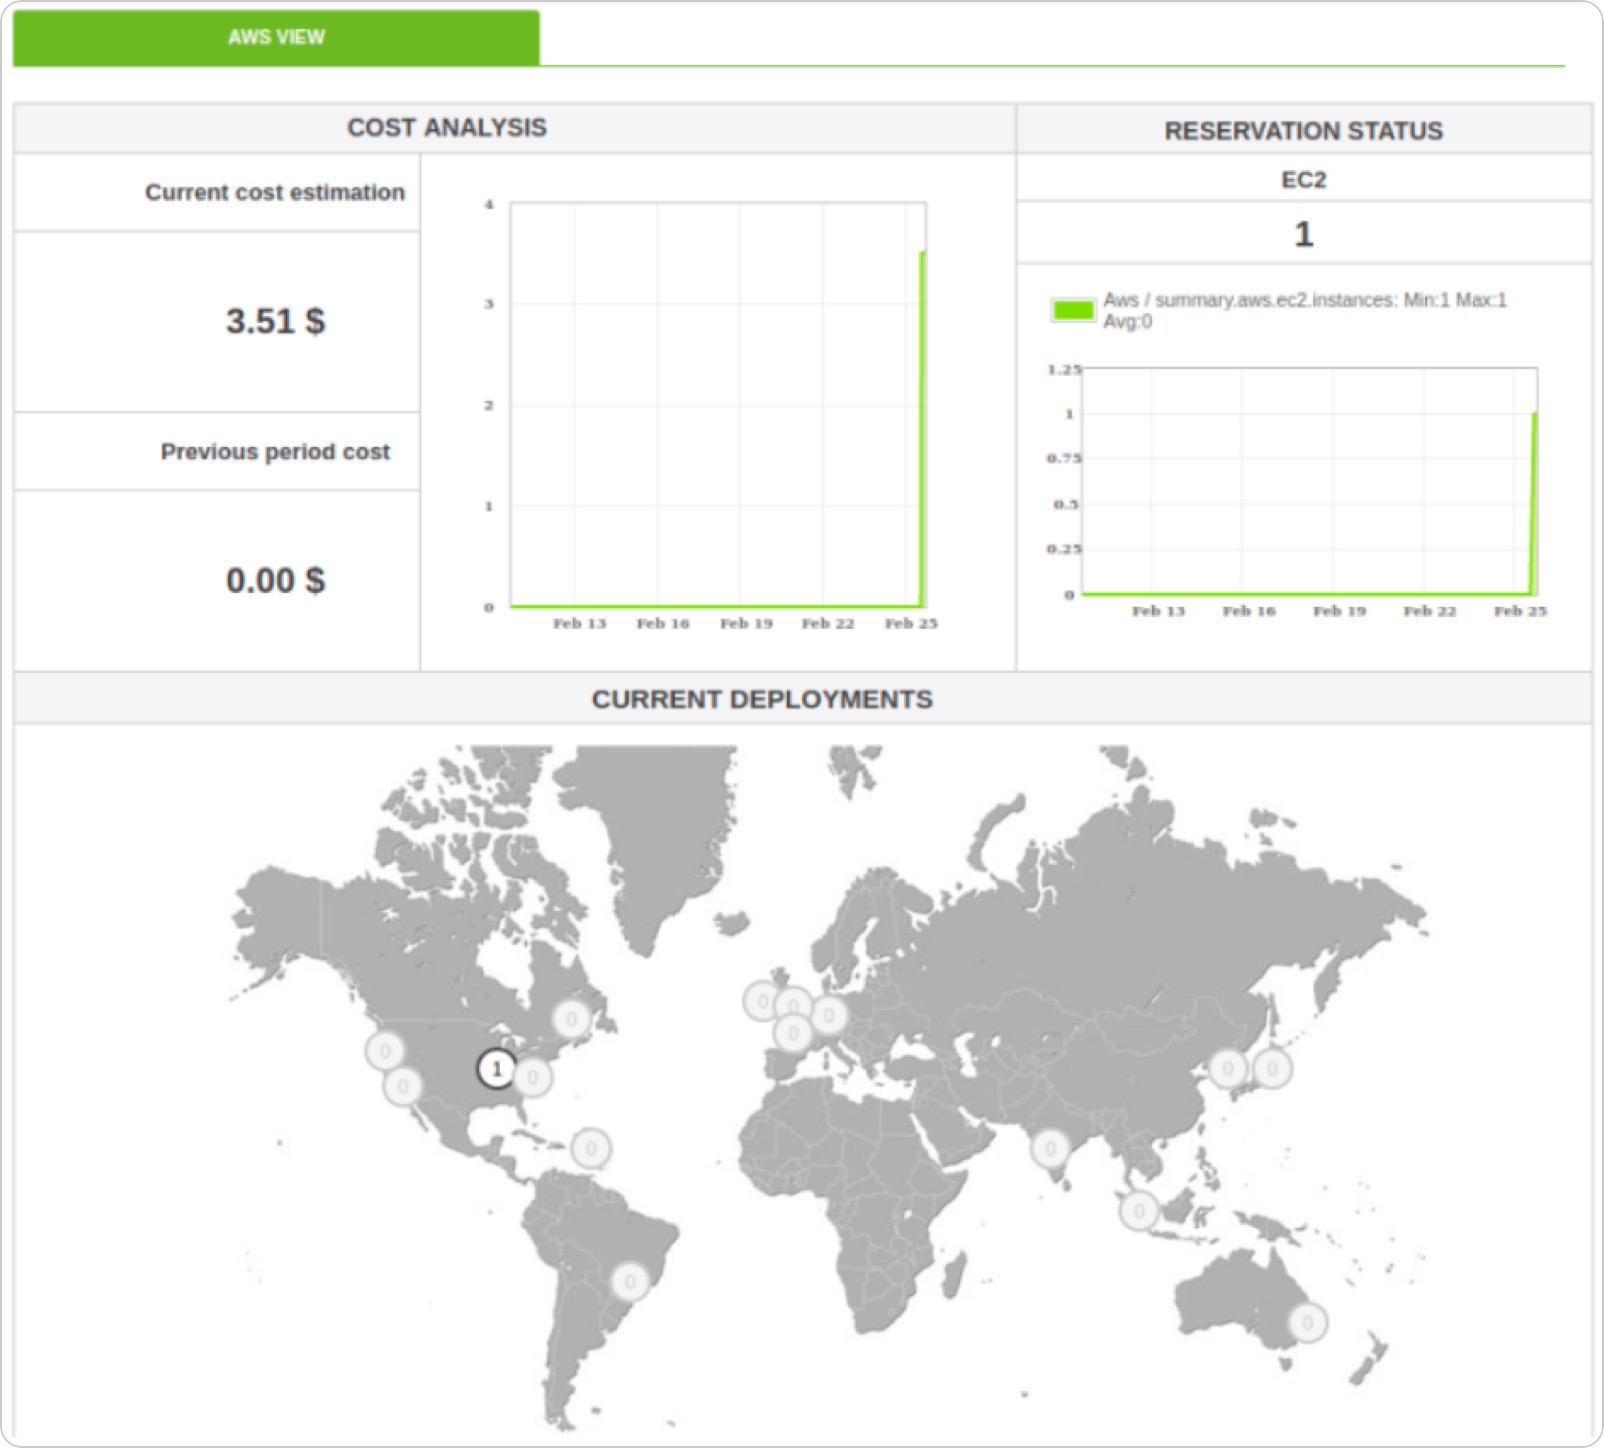
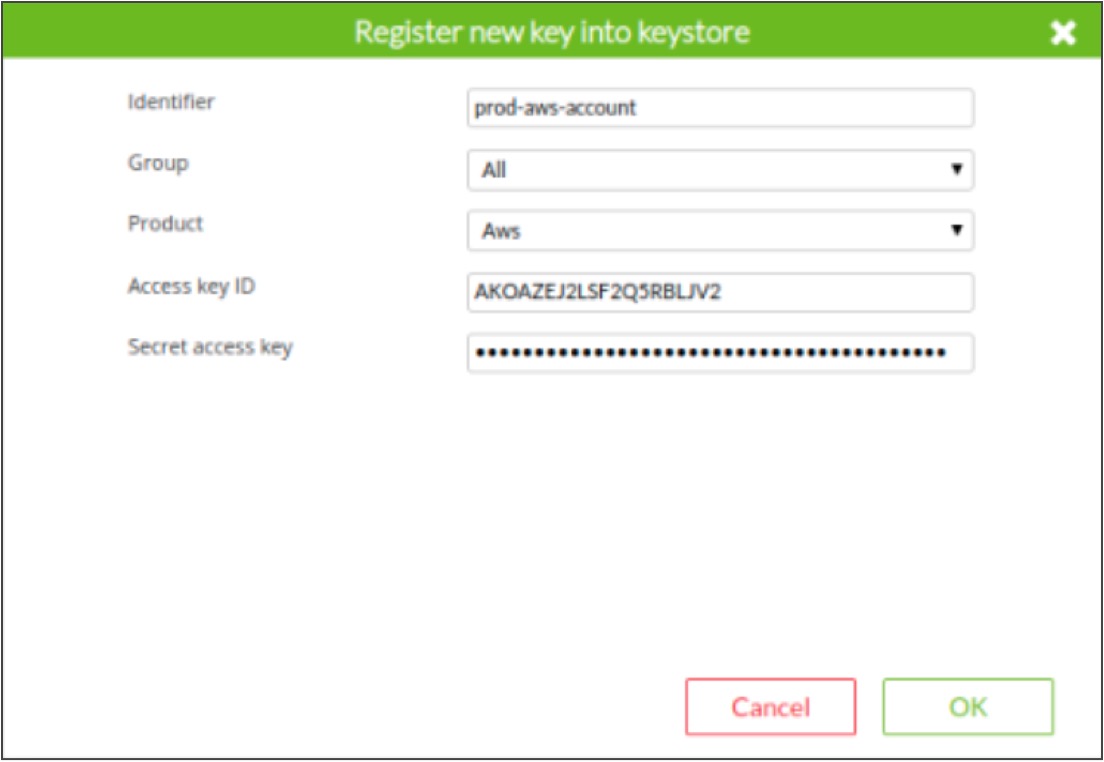
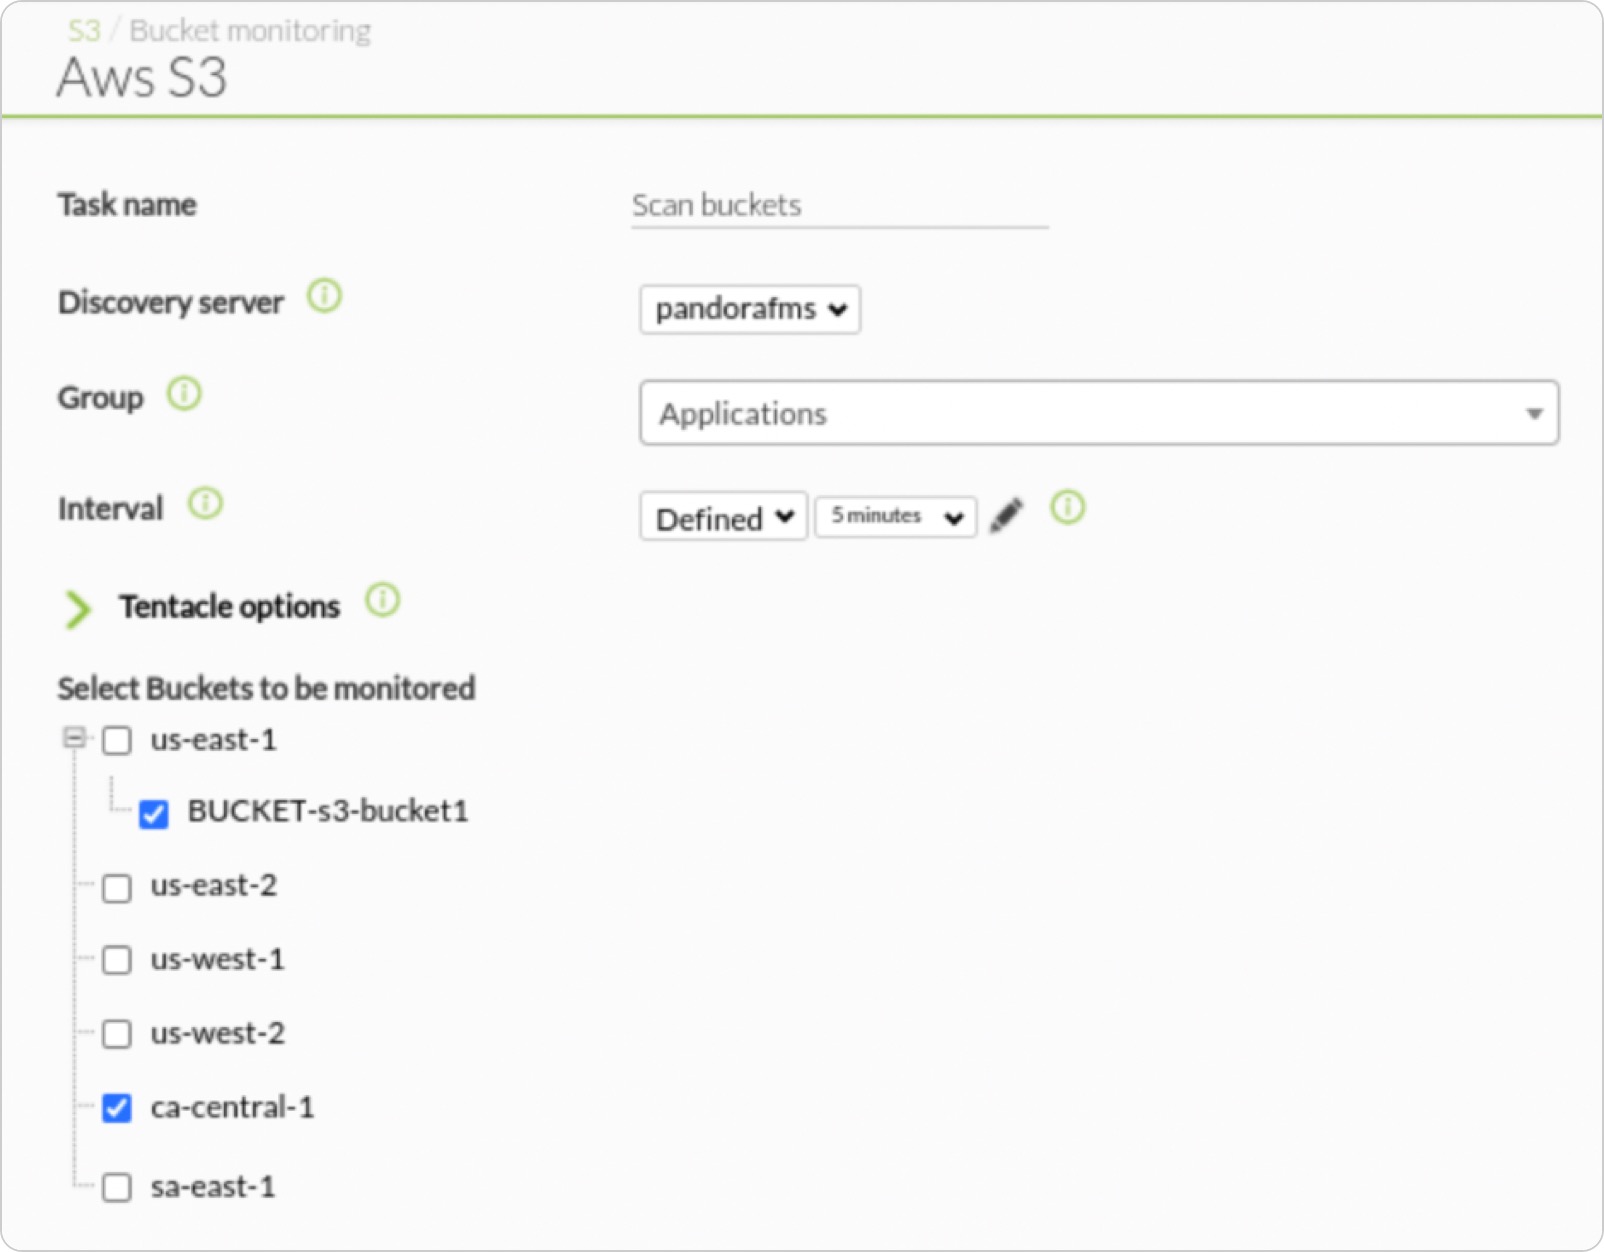 The advantage of this system is that you may get information about the services dynamically, without installing agents. In addition, if you later install agents, you may add both monitoring approaches. Through the credential container system you may even monitor different Amazon instances, for example.
 In the case of Amazon, you will also be able to find out the cost of active services.