
In a business world increasingly oriented towards efficiency and mobility, network management becomes a critical factor for success. Cisco Meraki stands as an undisputed leader thanks to its ability to offer a fully cloud-based technology, allowing companies of any size to manage their network devices remotely and centrally. This platform not only ensures the security and scalability required in enterprise environments, but also optimizes network performance by adapting the available bandwidth to the demands of the devices. However, to take full advantage of Cisco Meraki and ensure optimal infrastructure performance, proper monitoring becomes essential. In this context, Pandora FMS emerges as an end-to-end solution that allows adding a customized monitoring layer to the Cisco Meraki platform, facilitating early problem detection, performance analysis and scalability planning. Next, we will explore in detail why the combination of Cisco Meraki and Pandora FMS is the ideal choice for companies looking for efficient and proactive management of their network.
The great advantage of Cisco Meraki, which has made it stand out as a leader in its sector, is that it allows companies, regardless of the size of their network infrastructure, to offer 100% cloud-based technology. Of course, this allows you to manage devices from multiple locations remotely through a centralized tool, which has an API through which you may query through Pandora FMS, to add the whole monitoring of the environment in an easily and quickly, through plugins already designed for this function.
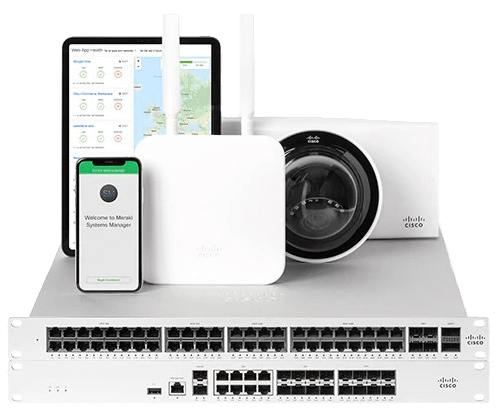
Why to Choose Cisco Meraki?
It is worth mentioning that the great advantage of Cisco Meraki is the technology of its cloud-based platform, which is widespread among companies of all sizes, and which includes the following advantages:
- Security: It offers malware protection, state-of-the-art firewalls, and data encryption. The standards comply with PCI level 1 regulations.
- Scalability: Cisco Meraki integration can be done both for one site and for thousands of devices distributed at different points. In addition, once deployed from the beginning, tools are offered to make the growth of the environment as efficient as possible.
- Performance: It provides network administrators with optimal performance by adapting the available bandwidth to the devices available.
Why monitor Cisco Meraki?
- Network Troubleshooting: It includes equipment malfunction or network overflow through traffic analysis tools.
- Environment Performance Analysis: Equipment that appears to be working properly but is actually flapping at its ports or a network interface whose speed is not enough to meet bandwidth needs can be as disruptive to your infrastructure as a device that is downright down.
- Infrastructure Scalability Scheduling: Are you sure that your devices are enough to meet the needs of your network? Monitoring the environment is key both to find out if it is necessary to add more devices, and to know whether there are lots of them for your real traffic.
Why choose Pandora FMS to monitor Cisco Meraki?
Let’s face it, Meraki’s own Cloud already includes infrastructure monitoring tools such as dashboards. So why should you worry about monitoring your Cloud devices with external software like Pandora FMS?
Here are just a few of the advantages you would enjoy by adding Cloud devices to Pandora FMS:
- Fully Custom Alerting Settings: Defining an alert when a problem is detected in a sensor (module) in Pandora FMS goes beyond notifying you by email or other notification tools, such as SMS or Telegram, the number of times and in the period of time you need. This section also includes the possibility of performing custom actions, such as trying to reboot a device automatically, writing on log files, opening an incident ticket on a ticketing platform…
- Custom Infrastructure Definition: Differentiating between groups of agents, agents and modules is fully definable depending on how you want to define computer division in your infrastructure.
- Stored Event History: Any status change and alert triggering from your sensors generates an event that is stored in a history that can be checked to perform a problem analysis in your network.
- Creating custom services, reports and visual consoles: Pandora FMS services allow you to assign importance to the different computers through a weighting system, visual consoles allow you to build your whole network infrastructure through icons that may change color according to device status in real time. Reports can be configured to prepare a summary of availability of a equipment or a network interface in an estimated time… these are just some examples of the analysis that you may get by storing your device data in Pandora FMS.
- Ease of integration between platforms: We have a plugin with which to add the devices within the Meraki Cloud with a simple execution. It is also possible to customize the modules you wish to add if you have direct access to the equipment using the SNMP protocol.
Pandora FMS Modules for Cisco Meraki
A Pandora FMS module is an information entity that stores data from a numeric or alphanumeric individual check (CPU. RAM, traffic, etc.). That is, if in a switch you wish to monitor its general CPU, and the operating state and input and output traffic of two of its interfaces, you will need to create 7 modules: one for the general CPU, two for the operating state of the two interfaces, two for the input traffic of the two interfaces and two for the output traffic of the two interfaces.
Modules are stored in dummy entities called agents. Generally, each agent represents a different device.
Finally, an agent always belongs to a group. Groups are sets that contain agents and are used to filter and control visibility and permissions.
By knowing these terms, we can get to know the structure of devices and checks that are automatically created in Pandora FMS with the execution of the “pandora_meraki” plugin that we have to add to our monitoring the information that can be retrieved from the cloud.
Meraki device agents and modules created using plugins
We have an official PandoraFMS plugin that will hugely improve the task of adding devices from the Meraki Cloud to your monitoring.
The plugin documentation can be found at the following link.
It is a server plugin (it must be located on the machine where PandoraFMS server is located), which must be indicated through parameters the URL of your Cloud, the organization ID of the company and the name of the group to add the agents that will be created through the plugin. With a simple execution, agents will be created for each appliance, switch and wireless device within a Network that matches the name of the group indicated by the parameter.
The modules created will be the following:

- For each appliance device:
- Device status
- Operational status of its interfaces
- Performance percentage
- For each switch device:
- Device status
- Operational status of its enabled interfaces
- Inbound traffic from its enabled interfaces
- Outbound traffic from its enabled interfaces
- For each wireless device:
- Device status


Meraki device agents and modules created through SNMP checks
If it is necessary to add an extra module to those created by the plugin and there is connectivity between Pandora FMS server and the Meraki network devices, it is also possible to add monitoring through SNMP check polling network modules.
SNMP version 1, 2 or 3 protocol must be activated in the configuration of the Meraki devices and a network server module must be created for each check that is needed, as in any other network device.
This video explains how to create these types of modules.
Conclusions
Delving into more extensive monitoring than that offered by Meraki’s own Cloud-native systems is necessary to detect medium/long-term problems such as network saturation and perform a performance and scalability analysis. And it is downright essential for the configuration of a custom and immediate alert and the automation of tasks such as ticket creation.
To delve into it, it is necessary to have a system specifically oriented to monitoring and that offers the integration of this system with the devices added to the Cloud.
Pandora FMS allows, not only all this ease of integration and analysis tools for the Meraki Cloud, but also in the same environment it is possible to add the whole monitoring of the rest of the company’s areas and devices, such as servers, or the addition of metrics from other manufacturers.

Pandora FMS’s editorial team is made up of a group of writers and IT professionals with one thing in common: their passion for computer system monitoring. Pandora FMS’s editorial team is made up of a group of writers and IT professionals with one thing in common: their passion for computer system monitoring.