In this brave new world of big data, a database technology called “Bigtable”, for example Apache Hbase, would seem to be worth considering — particularly if that technology is the creation of engineers at Google, a company that should know a thing or two about managing large quantities of data. Now with Pandora FMS you can monitor Apache HBase’s performance settings.
What is Hbase?
 HBase is an open source, non-relational, distributed database modeled after Google’s BigTable and written in Java. It is developed as part of Apache Software Foundation’s Apache Hadoop project and runs on top of HDFS (Hadoop Distributed Filesystem), providing BigTable-like capabilities for Hadoop. That is, it provides a fault-tolerant way of storing large quantities of sparse data. For more information on Apache Hbase visit the official Apache Hbase webpage: http://hbase.apache.org/
How to collect data
Pandora FMS uses an agent installed on the machine where Hbase is installed to execute local tests and send the results over to the server in XML format.
The Hbase plugin returns 18 modules. All of them display valuable status information. You can fix
thresholds manually to determine whether something is in a warning/critical or operative condition.
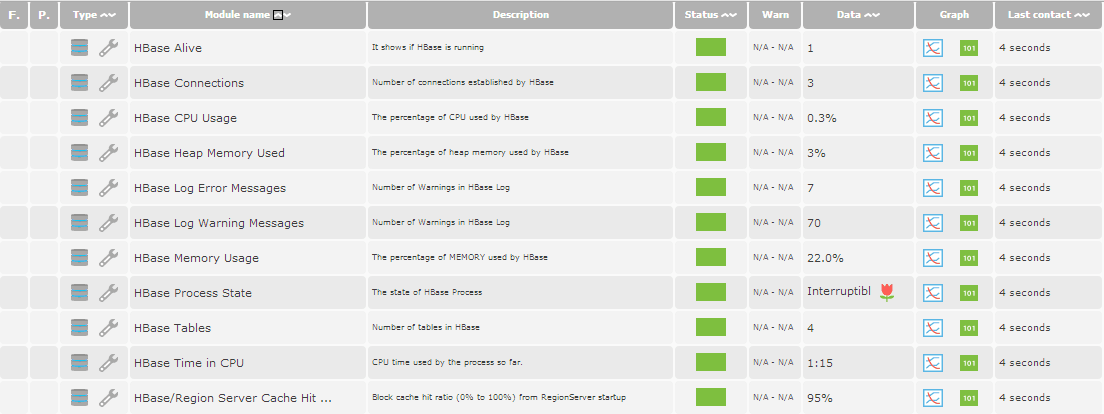
- Hbase Alive: It shows if Hbase is running. If this goes critical then the rest of the modules won’t be created.
- Hbase Connections: Display the amout of network connections in database.
- Hbase CPU Usage: The percentage of CPU used by HBase.
- Hbase Memory Usage: The percentage of Memory used by Hbase.
- Hbase Heap Memory Used: The percentage of heap memory used by Hbase.
- Hbase Process State: The state of Hbase process.
- Hbase Tables: Number of tables in Hbase.
- Hbase Time in CPU: It’s the CPU time used by the process of Hbase so far.
- Hbase/Region Servers Online: Number of Region Servers Online right now.
- Hbase/Region Server Request per second: Request per second of the RegionServer of Hbase.
- Hbase Log Warning Messages: Number of warning messages in Hbase Log.
- Hbase Log Errors: Number of error messages in Hbase log.
- Hbase/Region Server Cache Hit Ratio: Block cache hit ratio (0 to 100%) from RegionServer
- Hbase/Region Server Flush Queue Size: Point in time number of enqueued regions in the MemSotre awaiting flush.
- Hbase/Region Server Compaction time: Point in time length of the compaction queue. This is the number of Stores in the RegionServer that have been targeted for compaction.
- Hbase/Region Server Memstore Size: Point in time sum of all the memstore sizes in the RegionServer.
- Hbase/Region Server Read Request: Number of read requests for RegionServer.
- Hbase/Region Server Write Request: Number of write request for RegionServer
- Hbase/Region Server Number of Online Regions: Nomber of regions served by the RegionServer
How to configure the plugin
In order to configure correctly this plugin there are a few steps that should be followed:
Move the hbase_plugin.sh file from the default download directory to the /etc/pandora/plugins/ directory:
Assign necessary permitions to hbase.pl script:
chmod +x hbase_plugin.pl
At the end of the pandora_agent.conf file add the following line:
module_plugin /etc/pandora/plugins/hbase_plugin.pl
Restart the pandora agent process writing:
sudo /etc/init.d/pandora_agent_daemon restart.
This plugin also needs a specific configuration for Hbase to be able to retrieve the right information throught the information server of Hbase.
First of all, Hbase must be unpacked in /etc. The folder must be called “hbase” all the files which will be used by Hbase will be in that folder.
Before starting Hbase we should modify the configuration file of Hbase located in /etc/hbase/conf depending on our needs.
We have to edit/add the following lines in hbase-site.xml, between the “configuration” tags (<configuration> and </configuration>):
<property>
<name>hbase.master.info.port</name>
<value>16010</value>
</property>
<property>
<name>hbase.master.info.bindAddress</name>
<value>127.0.0.1</value>
</property>
Extracted Information
General view of the modules in the Pandora Console:
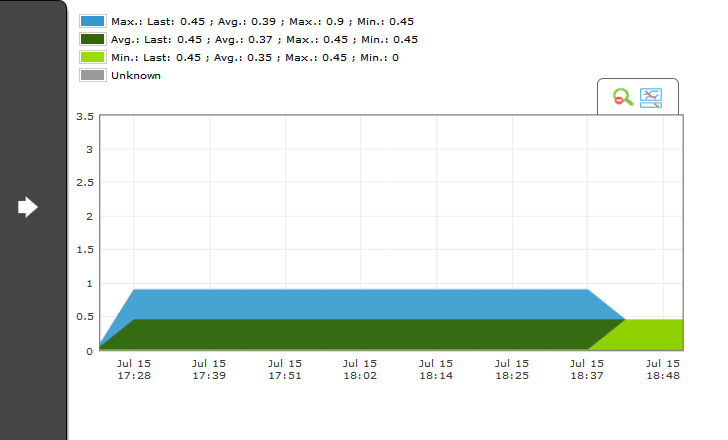
Below we can see a graph with the gathered information by a module:
 |
|
| Do you want to know more about Pandora FMS? |
Do you want to get this plugin? |
El equipo de redacción de Pandora FMS está formado por un conjunto de escritores y profesionales de las TI con una cosa en común: su pasión por la monitorización de sistemas informáticos. Pandora FMS’s editorial team is made up of a group of writers and IT professionals with one thing in common: their passion for computer system monitoring.


