Docker, Kubernetes and Helm to be monitored with Prometheus and Grafana
Helm was born during the Pycon conference in 2013. Well, it wasn’t exactly Helm, it was Docker. It took Mr. Solomon Hykes a little over five minutes to completely change computing history. Ok, I admit that not everyone knows about -and uses- Docker and/or Kubernetes, but there is one fact that is undeniable: Helm in November 2019 had a million downloads and that is something important. We will see why.
Think of herds, not pets
In order to introduce Helm, it is necessary, in a quick but extended way, to describe what a virtual machine is and its environment. If you are a computer expert, you probably know what comes next. If so, you may skip this section. I included several links to our blog, so pay attention if you want more information about some of the points, a new tab will open, read and come back please.
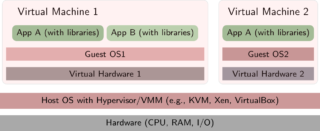
A virtual machine runs as just another program on a real machine and hosts a full operating system, which ignores that its components (memory, disk, etc.) are made-up. The virtual one is called guest OS and the real one host OS and the program that runs the guest OS is called hypervisor. The use of hypervisors is so widespread that your computer, on its motherboard, probably has some chips specially devoted to improve hardware performance.

My favorite hypervisor is VirtualBox®, for its simplicity and variety of platforms. In fact, for programmers who need an immutable infrastructure, you may use Vagrant to have your development environments virtually with scripts that you may reuse and modify using version control. Other popular hypervisors are:VMWare,Xen, hyperv and kvm.
Similarly, network administrators can – and should – make powerful real machines with their hypervisors already installed available to us through Administration of Server Configuration or ASC. Then with Vagrant, within the virtual devices, install Puppet, Ansible, etc., to provide the rest of the virtual software.
Here I introduce a concept: think that you work with “herds” of machines, not with your home computer which is a beloved – unique and irreplaceable – “pet”. With programs like Vagrant, Chef, Puppet, Ansible and more you can reproduce, over and over again and in an automated way, each and every one of your servers (as long as you create and treasure the files with instructions for it).
Pandora FMS has experience in monitoring a variety of virtualized solutions, and it even has a separate chapter in its user manual (Amazon EC2®, VMware®, RHEV®, Nutanix®, XenServer®, OpenNebula®, IBM HMC®, HPVM®).
So far so good, but this system consumes many resources, so you will be quite limited when running several virtual OS at the same time with your real hardware.
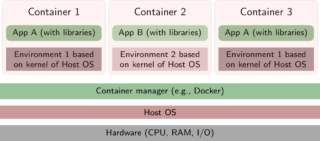
For decades GNU/Linux® has reigned in servers and supercomputers, and since virtual machines are quite old actually (IBM is from the 1960s), the OS of the little penguin is not alien to its use. But here comes the geniusness of container development: reusing the Linux kernel to host more virtual machines at the same time. That way you can divide the use of the components (through lxc and cgroups and other Linux kernel components) and even test several distributions: you could run a container with CentOS in Ubuntu, for example. Well, for this Docker® was born in 2013, as I told you at the beginning, to make your daily work easier!

If saving on hardware resources seemed little, there is more: What if you set that CentOS you downloaded as an immovable foundation and you “build” virtualized applications on it? Well, let’s get to the practical part: Pandora FMS can be run that way and with multi-stage builds you can keep the image sizes to a minimum.
Docker® and its universe
Solomon Hykes founded the company dotcloud in 2010 and his great success was developing Docker in 2013. Docker, as a product, grew so much that today it is a company as such. Dotcloud – its technology and name – was sold to another company called cloudControl, who declared bankruptcy in 2016.
It’s a rare case called a “unicorn company”: Docker as software is the crown jewel and has been widely adopted by individuals and businesses. Once installed by a root user(user with administration permissions) Docker allows all other users without administration rights to run their containers without any more limitation than that imposed by the capacity of the real hardware.
In our case, in the monitoring field, it generated new challenges and successes for Pandora FMS.
In the field of security, Docker Bench was presented, since, to new problems, new solutions.
The line of commands fascinates me and Docker is so slow in it that frequently, when we pass environment variables for our applications, it becomes long and burdensome. For that reason we will use Dockerfile for it. Beware that also your applications must be programmed taking this into account, thus you will be able to deploy many containers with different features according to those variables.

We can also – or rather should – use Docker-compose in YAML format for more complex and structured instructions, for its better human understanding, and that machines can also read and interpret.
Soon later Docker was over exceeded in its use and demand, and the need arose to organize large groups of containers. For this they developed Docker Swarm, predecessor – as I think – of Kubernetes.
Attention!
Container data are volatile. When finishing or restarting your real computer, you will lose the databases, files, etc., you added. To avoid that, Docker offers persistence methods (local volumes or connection to remote volumes). In the case of databases, you may also host them on real machines and allow Docker to connect to them.
Kubernetes

What could be more revolutionary than Docker? Well, getting rid of Docker itself! Put simply: Kubernetes (developed by Google) takes Docker out of the game and communicates directly with containerd 1.1, from binary to binary and with a powerful API that makes administration easier and automates it. The “cost” is that it needs administrator rights, and you already know they say something like: “With great power comes great responsibility”. The new alternative that also seeks to replace Docker is Podman.
The fundamental unit of Kubernetes is the kubelet, which is responsible for grouping and managing several containers in a pod in thousands of clusters that can be organized more easily by ourselves.
My advice to every company is to get started with Docker and get your hands dirty by replacing services one by one, saving all our progress with version control. And then move on to Minikube, which may well use Docker (among others) and VirtualBox (among others) to locally virtualize a Kubernete. Minikube has many advantages, but I emphasize: we use exactly the latest version of Kubernetes with all its features and with a fast learning curve based on trial and error.

Let us never forget that when we go big, we must always have a team of well-communicated people, who check our scripts and deployments (scientific method, small-scale simulate results, “proofs of concept“) and document and organize everything to achieve a stable version; then the cycle repeats again.
Kubernetes has configuration maps or configmaps that contain instructions to dynamically create volumes and namespaces. It is always important to name, or rather label(set and apply tags) your configuration maps, as Grafana will make use of them. Remember the environment variables? With the configuration maps, you can also do the same as in Docker and, in addition, at any time during the life of the containers. With Kubernetes Secrets, we will do the same with user names, passwords, etc., in an encrypted and secure way, also dynamically to all the nodes that we have deployed.
Once we are skilled in this, we can go on to use Helm, heading to our final destination: Prometheus and Grafana.
Helm

“Helm” is the abbreviation (in disuse) of helmet. Currently it means helm and its name is relevant because it is used to search and manage packages in Kubernetes, whose logo is also a helm (all this comes from the concept of containers or for maritime transport through ports or docks…yes, the geek world is a bit weird).
Helm was born in the KubeCon of 2015. It was actually called Helm Classic and they had no qualms about being inspired by Homebrew, the popular package driver in the MacOS operating system.
I stop here briefly: homebrew is the process of making your own beer at home and denotes a purely artisanal method but with a high level of quality. MacOS users – rather fanatics – are distinguished by having everything in order and just as they want and/or need: when they replace a computer or mobile phone in a very short time they have everything ready again and they resume their work and production .
In 2016, Helm 2 became a formal part of Kubernetes and was evolving and merging with other projects, such as Monocular, Helm Chart Repo, Chart Museum, to later reach Helm Hub in 2018. Currently we have Helm 3 since November 2019 with some important modifications that brought it closer to its beginnings, Helm Classic.
Now fully delving into Helm, the key concept is the use of job letters or Charts that cover a workload within Kubernetes (install a web server, a database, etc., as it can also be a service). Although it sounds simple… you see the whole way to get here!
From the concept of charts, let’s add:
- Charts have the necessary information to install -the term used is display, more appropriate- your services and applications.
- Do you remember the configmaps and Kubernetes Secrets? Helm needs a config with those data and customizations to merge into one or more charts and then deploy in Kubernetes clusters.
- A release is a chart and a config running on Kubernetes. Helm will take care of his birth, life and death for us. We will indicate if while it lives it should be modified, without stopping its operation, and that these changes are stored for the following “births of our herds”.
What do you think? Simply incredible! Working with Helm and Kubernetes is like having farmers and farms at our disposal who take care of all aspects but following very neatly and in detail each of our ideas and instructions.
Prometheus and Grafana
Prometheus appeared in 2012 with the company SoundCloud® that needed a very special monitoring software (pity, they did not know Pandora FMS). By 2015, the version was ready to work and the following year the Cloud Native Computing Foundation®, a project of the Linux® Foundation, added Kubernetes® 1.0 (its project, which also debuted in 2015) for monitoring tasks. From that moment on, Prometheus was oriented towards virtualization, although it is still part of other software such as Percona PMM.
Grafana, on the other hand, is the graphic and native muscle of Prometheus, in addition to having a large number of electronic boards or whiteboards preconfigured (dashboards) to formally display the values. Prometheus Alert Software is AlertManager.
Kubernetes Monitoring
After knowing all of this, install Helm and clone with git the repository that contains the chart fora Prometheus and the chart for Grafana with default values, necessary tags included to be able to monitor Kubernetes. And then the most important point:
helm install stable/prometheus

helm install stable/grafana
If you add the parameter- – name =
To customize your values, modify the Prometheus YAML: pay attention to the Role Based Access Control(RBC); persistent volumes and persistent databases, exposed ports, load balancing, etc., and redeploy with Helm to see how changes dynamically adapt. In the Grafana community, there are many more dashboards available, eventually you will be able to modify or even create your own, and share them!
With this you can thus start your learning process in order to apply them to Pandora FMS, either:
- Create and deploy your Pandora FMS servers and consoles.
- Create and deploy Pandora FMS satellite servers.
- Install Pandora FMS software agents in one or more Kubernetes clusters set by third parties that hired you for it.
Note: Nothing that I say and explain here is the official position of Pandora FMS or its development team, all this is purely conceptual. In this link you can read the official Pandora FMS roadmap.
Before finishing, remember Pandora FMS is a flexible monitoring software, capable of monitoring devices, infrastructures, applications, services and business processes.
Would you like to find out more about what Pandora FMS can offer you? Find out by going here .
If you have to monitor more than 100 devices, you can also enjoy a FREE 30-day Pandora FMS Enterprise DEMO . Get it here .
Finally, remember that if you have a reduced number of devices to monitor, you can use the Pandora FMS OpenSource version. Find more information here .
Do not hesitate to send us your questions. Pandora FMS team will be happy to help you!

Traductora a francés e inglés. Me encantan las lenguas. Amante de la ropa oversize, la tarta de queso y el chocolate caliente en invierno. Me gusta leer, escuchar música, viajar y explorar cosas nuevas. Mi frase más temida por aquellos que me conocen es “he estado pensando…”
Translator into French and English. I love languages. Lover of oversized clothes, cheesecake and hot chocolate in winter. I like reading, listening to music, travelling and exploring new things. My most feared phrase by those who know me is “I’ve been thinking…”


