Data Guard monitoring: find out all about it in order to monitor it
What is Oracle Data Guard?
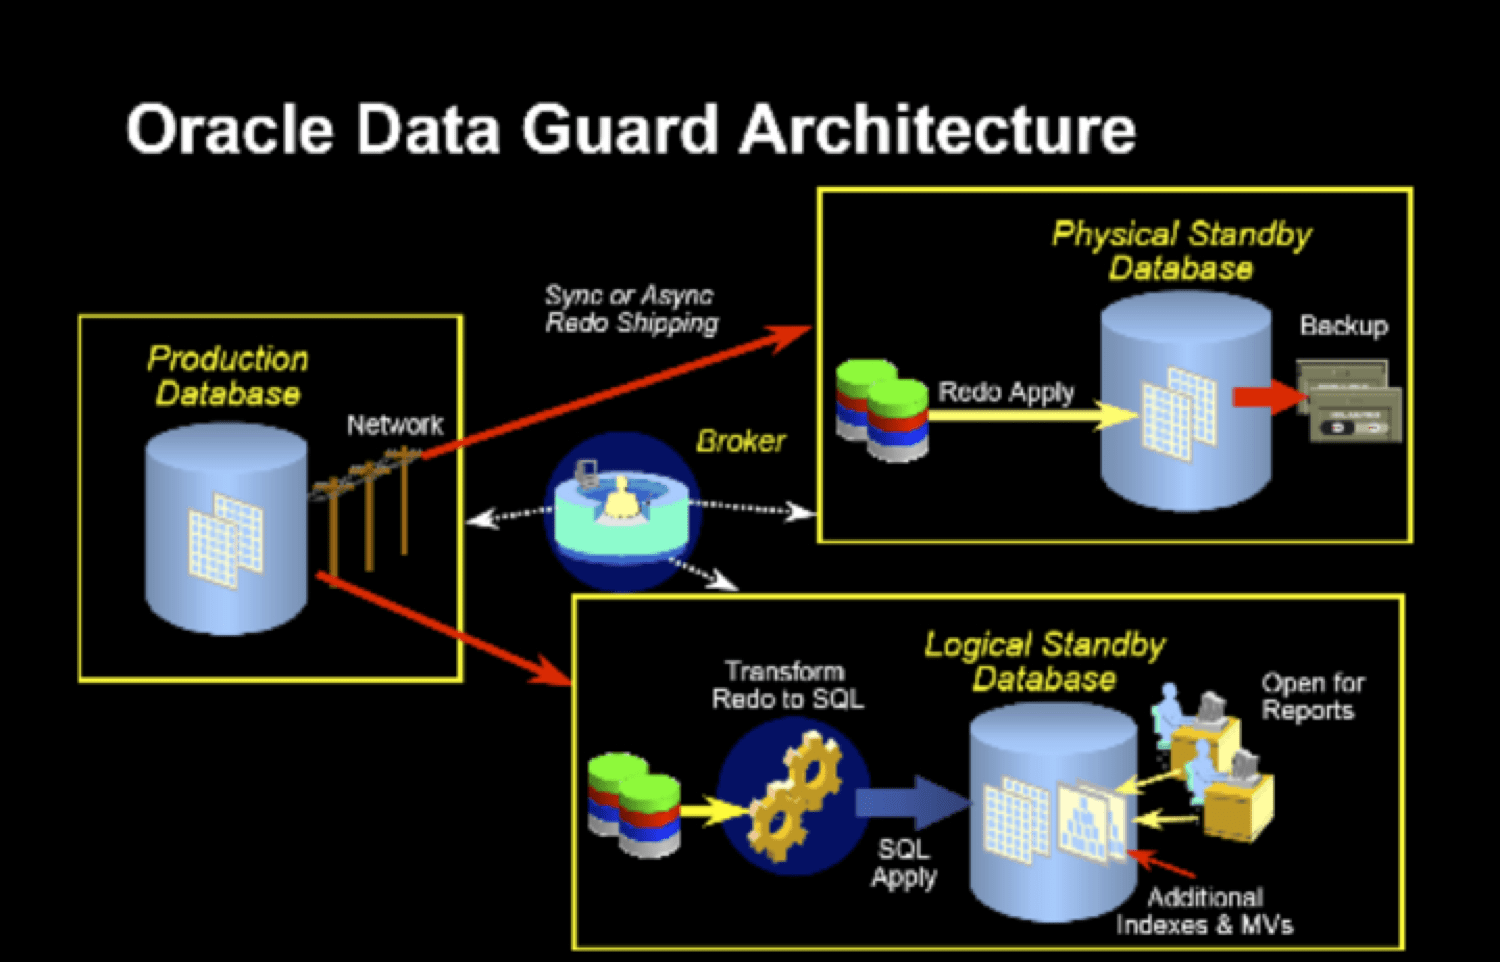
Before getting started with the tutorial for Data Guard Monitoring from Pandora FMS, first, we need to understand what Oracle Data Guard is. In order to understand this, we need to know what the protection modes of Oracle Data Guard are and how these are configured. It’s fair to say that your configuration always runs in one of these three data protection modes: Maximum protection, Maximum performance (default operation mode) and Maximum availability.
- a) Maximum protection
This protection mode guarantees that no data will be lost if the main database fails. In order to provide this level of protection, the “redo” data which is necessary to retrieve each transaction, must be written both in the “redo” log on the local line, and in a “redo” record on standby and at least , a database on standby before the transaction is carried out. To ensure that no data loss is generated, the primary database will be closed in case a failure prevents it from writing its “redo” sequence in a synchronized database on standby.
In this data protection mode, we prioritize the protection of data over the primary database. In this context, Oracle itself recommends administrators to use at least two standby databases in order to protect a primary database, which runs in a maximum protection mode. - b) Maximum performance
This protection mode provides the highest level of data protection without affecting the performance of the primary database. This is achieved by allowing a transaction to be confirmed as soon as the “redo” data necessary to recover that transaction is written in the local “redo” record. Then, the “redo” data sequence of the primary database will also be written in at least one waiting database. But, that “redo” sequence will be written asynchronously, regarding the transactions that create the “redo” data.
When using network links, with enough bandwidth and latency, this mode of protection provides a level of data protection that is quite similar to the maximum availability mode and, with a minimum impact on the performance of the primary database. - c) Maximum availability
This protection mode, in turn, provides the highest level of data protection, without affecting the availability of the primary database. It’s exactly what happens with the maximum protection mode, in this case the transactions are not compromised, until all the “redo” data which is necessary to recover those specific transactions, have been written in the “redo” online record and at least, in a synchronized database. We must also say that, unlike the maximum protection mode, if an error prevents you from writing your “redo” sequence in a standby database which is synchronized, then the primary database will not shut down.
On the other hand, the primary database will operate in re-synchronization mode, until the fault is corrected and also until all the registration spaces have been resolved. When these spaces have been resolved (all of them), then the primary database will automatically resume its operation in maximum availability mode. This mode guarantees that if the main database fails, no data will be lost. However, we must bear in mind that this will happen only if a second eventual error does not prevent a complete set of “redo” data from being sent from the primary database to at least one standby database.
What are the prerequisites for these three protection modes?
Before getting into the different ways of Data Guard Monitoring, we need to analyse these requirements. So let’s have a look at this:
- For maximum protection, we have to:
-
- Redo the file process: LGWR.
- Network transmission mode: SYNC.
- ‘‘write to disk’’ option: AFFIRM.
- Redo standby records: YES.
- 1.1.2 For maximum availability, we have to:
- Redo the file process: LGWR.
- Data transmission mode: SYNC.
- ‘’Write to disk’’ option: AFFIRM
- Redo standby records: YES.
- 1.1.3 For maximum performance, we have to:
- Redo the file process: LGWR or ARCH.
- Network transmission mode: ASYNC, only when LGWR is used.
- ‘’Write to disk’’ option: NOAFFIRM.
- Redo standby records: No, but it is recommended and necessary for real time.

Do you want to know more about application monitoring?
Pandora FMS Enterprise is capable of monitoring the most popular applications and databases. Click here and find out…
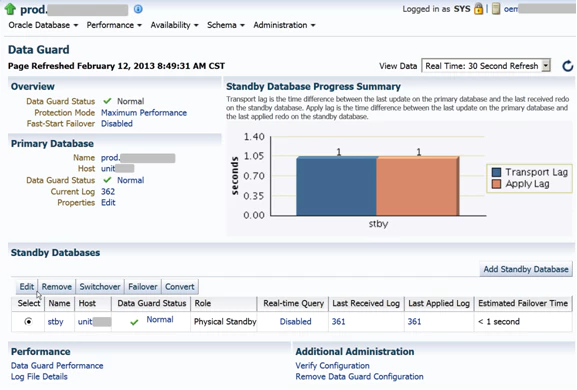
2. So how do we carry out Data Guard Monitoring?
First, you must configure a standby instance for monitoring. In order to be more clear about this, we have to say that a back-up instance in the data protection feature of Oracle, guarantees high data protection, high availability and a very good chance of recovery, after disasters in business data. Let’s see, then, what we should do before Data Guard monitoring. For this purpose, we must configure an Oracle instance. Then, after installing BMC PATROL for Oracle, we must load the Knowledge Module (KM) in BMC PATROL Console, and then configure the product, this way, we can obtain parameter data from BMC PATROL for Oracle.
We recommend readers to visit this link, where they can analyse each task related to the configuration of a standby instance for Data Guard Monitoring. On the other hand, you must have SYSDBA privileges in the database, in addition to the respective access permissions, which are needed. And also, the correct user credentials in order to configure a standby instance.
We must bear in mind that the PATROL account must have read access to the tnsnames.ora file. Then, we must confirm that ORACLE DATAGUATD.kml is loaded in our system. In order to load a knowledge module, we must do this from the PATROL console:
In the tab called “Common Tasks”, located in the Task Panel of the Central Operator, we must click on the icon “Load Knowledge Modules”. Then, in order to start the wizard, we click on “Next”. Then, we select the check boxes for the managed systems, where we want to load knowledge modules. Then, we click on “Next”. Afterwards, we select the check box for each Knowledge Module or KML that we want to load. We click on “Next”.
Next, we must look for the Individual Knowledge Modules. KML, in turn, can be found in the tab “Lists of Knowledge Modules”. Finally, we click on “Finish”.2.1. A standby instance for Data Guard Monitoring in the Central PATROL console
In this case, the standby instance type is the logical or physical standby mode. Then, in order to configure the standby instance, we must click on this video to learn how to configure an Oracle Data Guard instance, to monitor a PATROL environment. Let’s say that it is necessary to verify that the user of the PATROL console has the privilege of executing SQL*Plus commands. From the ORACLE_DATAGUARD application, we must click with the right button to select: Knowledge module commands> install DataGuard instance.
Then, we select the main instance of the “Configure DataGuard Instance” dialog box, and then click on “Apply” and “Exit”, in order to close this dialog box. In the “DataGuard Instance Configuration” dialog, we must enter the data that we will show down below (details of standby instance) and then click on “Apply”.
When it comes to the field “TNS entry waiting”, we must use the name of the TNS service entry, which we will use to connect to the standby instance. And in the “Username and Password”, we must write, the username and password that we will use to connect to the standby instance. We need to keep in mind that we should not write “as sysdba” in the password.2.2 The display of the ORACLE_DATAGUARD instance, in the PATROL Central interface
After configuring the standby instance, the hierarchy of the data implementation in the PATROL Central interface goes like this:
- The ORACLE_DATAGUARD application represents the data protection instance monitoring (Data Guard monitoring) feature.
- Primary instance database name.
- DGCollectors application with parameters that collect the data for the standby instance, CollDataGuardia and CollTimeDataGuard.
- DGPARAMS application, with data delay parameters and with time for each standby instance (configured). Such as: ApplyLag, LogTranferGap, LogApplyGap and TransportLag.
- DGConfigurationStatus: it shows us the configuration status of DATAGUARD.
- StandbyStatus parameter: this one checks the configured standby database, and runs in a data protection environment.
2.3 A standby instance for monitoring in the TrueSight console
The user has the chance to configure a standby instance, for Data Guard monitoring, in the TrueSight console to apply the instance in a PATROL agent. But, before configuring a standby instance, the user must have a configured instance of ORACLE DATABASE.
In order to carry out the configuration of the standby instance, we must:- Determine a monitoring policy (monitoring) in TrueSightConsole to select the parameters: We must click on “Add”, then select “Monitoring Solution”, and establish the Oracle database. Regarding the “Version”, we must choose 9.7.10. Then, regarding the “Monitor Profile”, we need to establish OracleStandby DataGuard. On the “Monitor Type”, we have to choose OracleStandby DataGuard.
- We must enter the name of the main instance and then click on “Add” in order to enter the details of the standby instance.
- Then we enter the Standby instance information and click “OK”. With this, we must clarify that, in the field “TNS standby entry “, we must write the name of the TNS service entry, which we will use to connect to the standby instance. Then, we must write the username and password, we have to keep in mind that we should not add “as sysdba” in the password.
- We must click on “Accept”, in order to save this monitoring configuration of the standby instance. Let’s clarify that after creating this standby instance, the implementation hierarchy for the application has an important similarity to the PATROL Central view.
2.4 Preparation of standby instances, for monitoring with batch configuration
From Pandora FMS, we recommend readers to resort to these instructions, so we prefer to talk about the manual configuration of a file, in batches, for the standby instance. So, to configure a batch configuration file, we can use the
DG_batch_conf_sample.wrifile as a template. Then, from a command prompt, we do the following:
We open the file DG_batch_config_sample.wri in the following location, depending on the operating system of each user:- For Data Guard Monitoring, from Pandora FMS we recommend readers that have UNIX operating systems, to locate the file in
$ PATROL_HOME /.../ Oracle / conf . - Windows users can find the file in
% PATROL_HOME% / Oracle / conf .
Once the file is found, it is necessary to edit the Oracle System ID (SID) and edit the values of keywords, in order to reflect the instances that you wish to continue. Then, it is necessary to save the file as
DG_batch_conf .txt, in a text-only format.As soon as we find this file, we must begin to process the file itself, in order to configure the instances in this PATROL agent point. So, when the discovery completes the processing of this file, the name of the file itself will change to
DG_batch_conf .done.In order to successfully complete the batch configuration or to correct any eventual errors, we can verify the following files (which are saved in the same directory location as the file, in DG_batch_conf_sample.wri):
DGBatchConfig .log. and,DataGuardConfig .log.Now, for webmasters and for IT professionals, we recommend Pandora FMS, which is the most flexible monitoring software on the market, this one is able to monitor infrastructures, devices, business processes, applications and services of all kinds. Pandora suits the needs of your business. If you don’t know us, you can get in touch with us in this contact form.
About Pandora FMS
Pandora FMS is a flexible monitoring system, capable of monitoring devices, infrastructures, applications, services and business processes.
Of course, one of the things that Pandora FMS can control is the hard disks of your computers.
Would you like to know more about what Pandora FMS can offer you? Discover it by entering here: https://pandorafms.comOr if you have to monitor more than 100 devices you can also enjoy a 30 days FREE DEMO of Pandora FMS Enterprise. Get it here.
Also, remember that if your monitoring needs are more limited you have at your disposal the OpenSource version of Pandora FMS. Find more information here: https://pandorafms.org
Do not hesitate to send us your queries. The Pandora FMS team will be happy to assist you!


Rodrigo Giraldo, freelance technical writer. Lawyer and astrobiology student, he is passionate about computers, reading and scientific research.