
AWS monitoring with Pandora FMS
In previous articles we talked about the need to move forward to cloud technology, as well as about the incorporation of the monitoring of this technology, describing this need with Microsoft Azure tool.
Now we are going to describe the Amazon AWS tool, its differences regarding Microsoft Azure and we will delve into monitoring AWS with Pandora FMS.
One of the big differences lies in the architecture on which AWS is based, where it is located in 18 different geographical regions and where certain zones are arranged in each of the regions.
- US East Coast: Northern Virginia, Ohio
- US West Coast: Northern California, Oregon
- Asia Pacific: Mumbai, Seoul, Singapore, Sydney, Tokyo
- Canada: Central
- China: Beijing, Ningxia
- Europe: Frankfurt, Ireland, London, Paris
- South America: São Paulo
- AWS GovCloud (US-West)
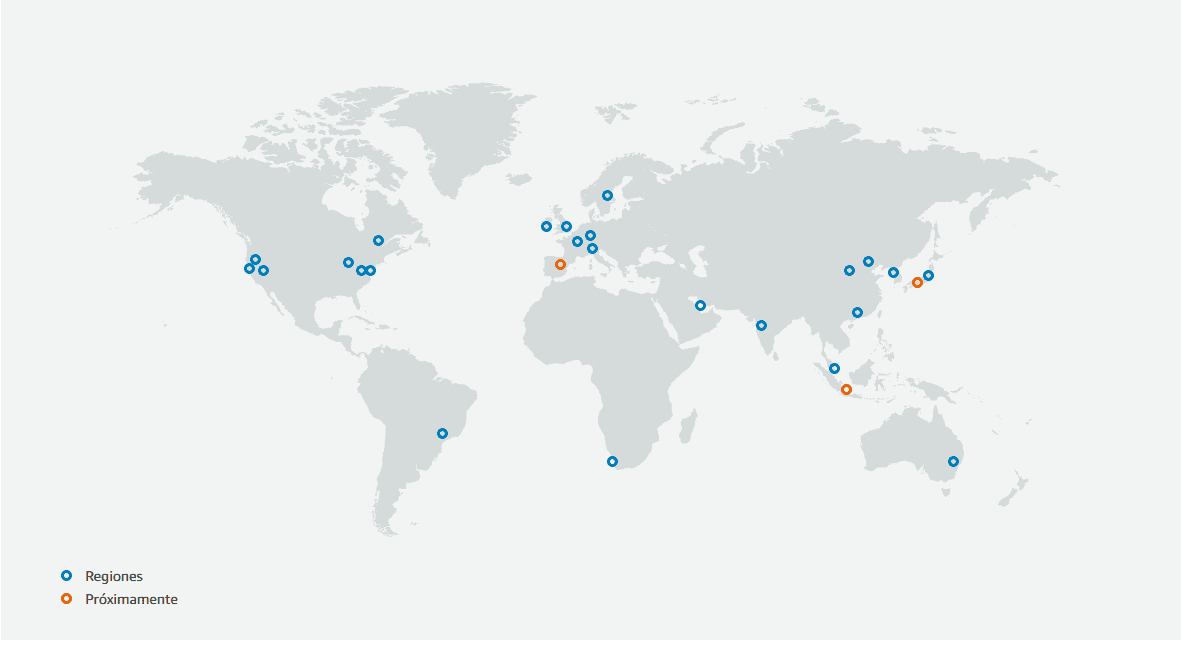
(Source: AWS official page)
Additionally, Amazon is making its cloud technology concept evolve, offering many different products: analytics, application integration, augmented and virtual reality or blockchain. It also offers the possibility of using hybrid cloud technology, making it one of the cloud providers with the largest number of services and features available.
Amazon is one of the pioneers in cloud technology, giving maximum configuration flexibility, letting you choose from the widest variety of databases compatible with the applications to be used. In addition, it has more than 90 security standards and certifications that make it one of the safest solutions on the market.
AWS monitoring: Discovery
Discovery is a feature whose purpose in Pandora FMS is to make the tool simpler, as well as to increase the amount of monitoring to be able to carry out, in simple and easy steps from Pandora FMS console, in a totally centralized way. Within this revolution, the cloud received a lot of importance, as well as AWS monitoring did.
As in the case of Microsoft Azure and other applications monitored by Discovery (Oracle, SAP, DB2 or VMware) the tool’s own API is used to obtain the necessary metrics to carry out the monitoring. That is why, after configuring it in Pandora FMS, a user must be created with the necessary permissions to be able to obtain all the metrics. The necessary permissions are the following:
- Billing (read)
- CloudWatch (list,read)
- Cost Explorer Service (Full access)
- EC2 (full read, limited: list)
Once you have said user, save the ID and credentials in Pandora FMS, which will then be used by the Discovery tool to carry out AWS monitoring.
Discovery currently monitors AWS EC2 and RDS services. You also have specific cost calculating monitors for the entire AWS infrastructure. Below you can see some of the simple steps to perform AWS monitoring.
What metrics can we see?
Regarding EC2, as it was the case with Microsoft Azure, there are three ways to monitor:
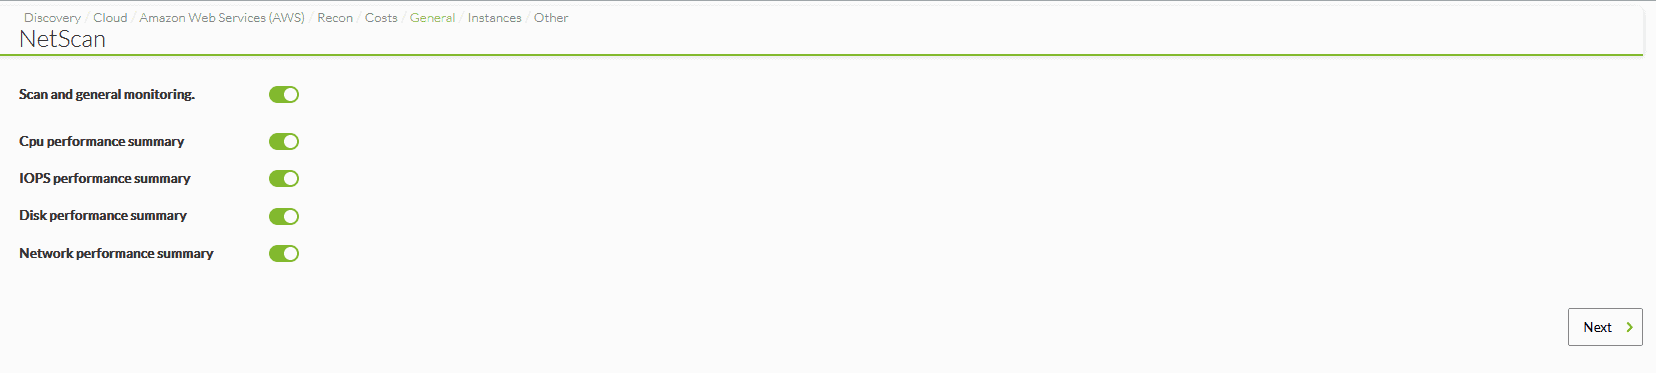
- General AWS monitoring, where you will create an agent which, depending on the permissions and modules to be obtained, will draw a summary of the availability, the global cost and information of the regions and instances.
- Monitoring by region, where you will be able to obtain metrics for the storage size and count, address count, global cost of the monitored region, CPU usage, disk read and written bytes and network packet input and output.
Being able to choose the monitoring to be carried out in a simple way:
- Monitoring by instances, where metrics will be created for status, CPU, disk read and written bytes and network packet input and output.
You can see below a general image of an agent created by the Discovery AWS task, with its corresponding modules:
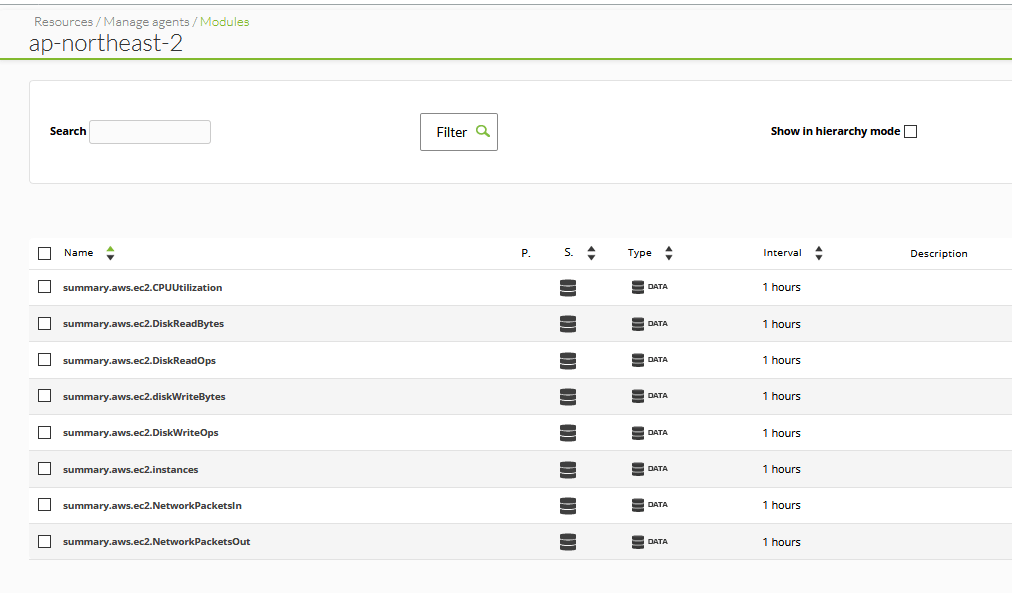
Regarding RDS, an agent will be created with all the information that you give it in the configuration with the status modules, status of the database that you want to monitor with a detailed description of the executions at that time and the accessibility to “publicly”, taking into account the database to be monitored (Mysql, Oracle, MariaDB…).
Once you have all the monitoring possibilities configured, Pandora FMS has a view where you can see globally the metrics, to follow up in “real time” what is happening on all the machines. Additionally, the Pandora FMS dashboard could be configured to be able to share the status with clients publicly and to be able to fill them in automatically.
What are the advantages of monitoring AWS with Pandora FMS?
Speed, automation and simplicity when carrying out any type of monitoring is the trademark of Pandora FMS. Thanks to this, a complete monitoring, both detailed and global, of the entire AWS architecture can be obtained through a few steps with a guided configuration.
One of the greatest advantages that Pandora FMS offers is the possibility of monitoring applications or services, in this case AWS, almost in real time, being able to perform checks in a short time and obtain console metrics in a short time interval, being the hardware the one that sets a usage limit.
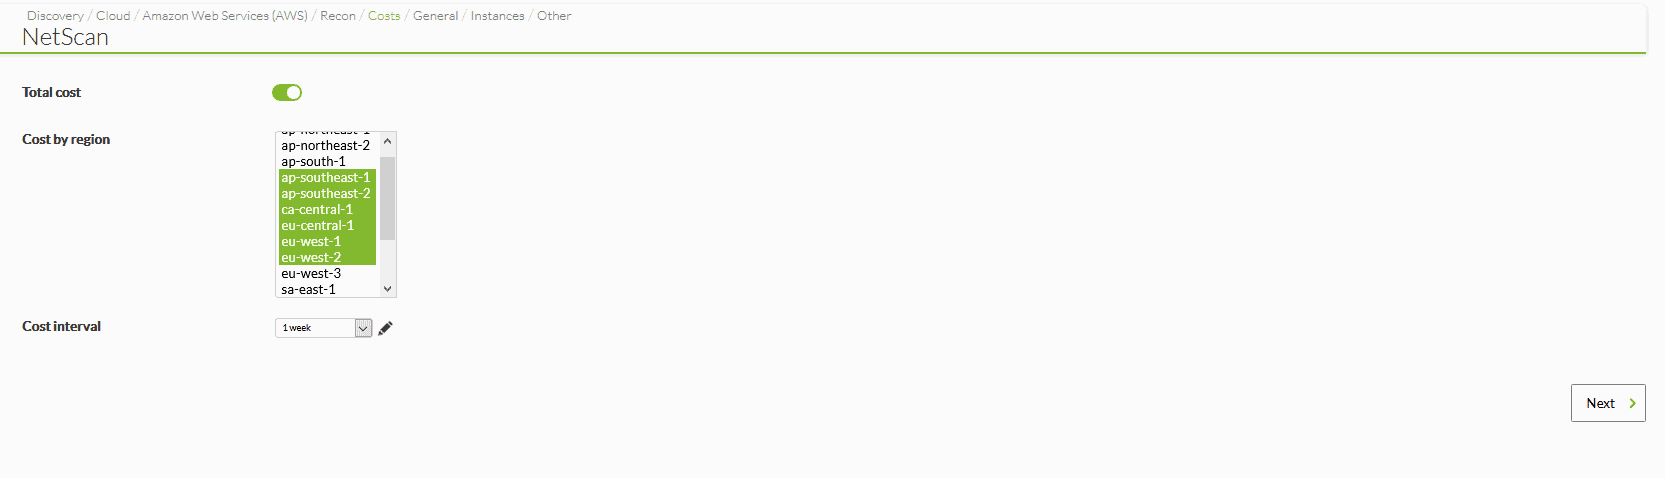
Expense monitoring
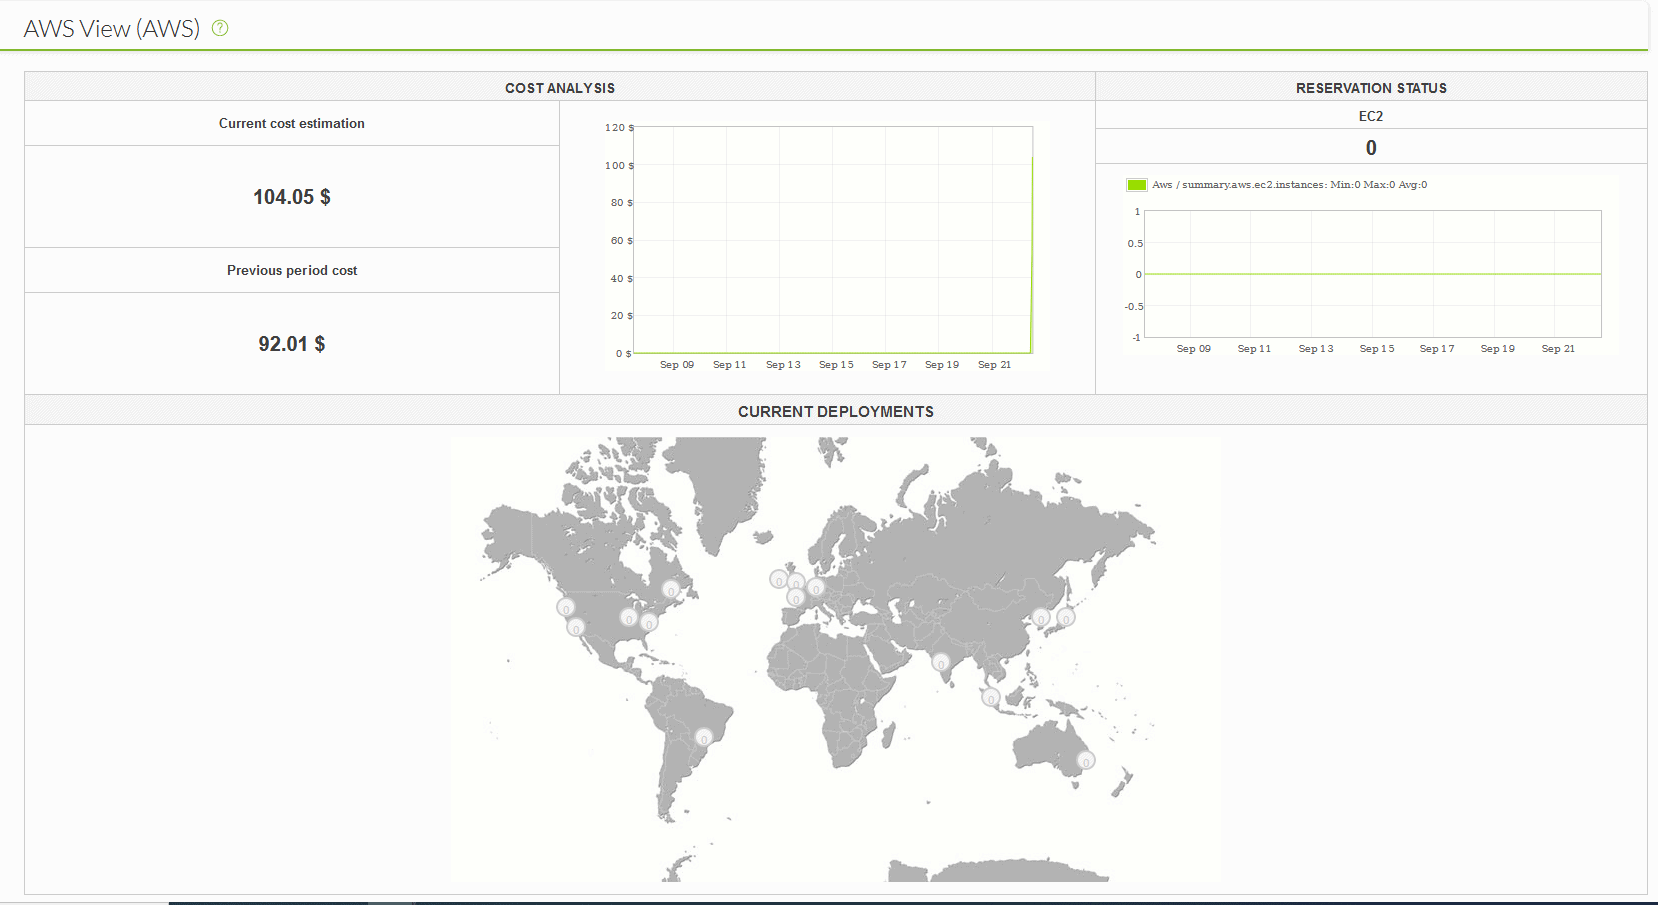
With Discovery, knowing how much is spent on AWS is as simple as activating it and accessing the specific AWS dashboard, which shows in real time:
- Current expenses.
- Previous expenses.
- Expense evolution chart (6 months).
- Reserve/instance evolution chart (1 month).
- Map of regions with the number of instances per region.
Without a doubt, this is one of the most common concerns of our customers: the difficulty of understanding AWS costs and being able to measure them clearly. With Pandora FMS monitoring we can obtain current cost data. Not only will it be data on the AWS-specific dashboard, but data that can be used in a dashboard, visual consoles, set alert thresholds, be used in capacity planning reports and, in short, uses like any other Pandora FMS data.
Management and operation automation
Finally, as in any automation concept with Pandora FMS, if you have a certain knowledge of the AWS API, you can configure different automatic actions to be carried out according to the arrival of metrics to Pandora FMS through simple alerts, being able to generate as many actions as necessary, such as stopping machines at a specific moment or activating others under a specific condition.
To finish off, remember Pandora FMS is a flexible monitoring system, capable of monitoring devices, infrastructures, applications, services and business processes.
If you want to find out about what Pandora FMS can offer you, find out by going here .
Moreover, if you have to monitor more than 100 devices, you may also enjoy a FREE 30-day Pandora FMS Enterprise DEMO . Get it here .
Last but not least, remember that if you have a reduced number of devices to monitor, you can use the Pandora FMS OpenSource version. Find more information here .

I am currently working in computer systems administration. I have been dedicated to it since the beginning of my working life, even in military environments. At some point I would like to write a book of reflections and poetry.