We check out some of the best Pandora FMS news in 2020
Today we are here to make a small compilation of the new Pandora FMS features launched throughout this last year 2020, a general review of all the small advances that we incorporated and that will be useful when you are at the controls of our software.
Mainly we are going to deal with new features but also great improvements in quality of use that we added to Pandora FMS throughout 2020. To begin with, as features, for example, we added an integration with Google cloud, Inventory Alerts, PEN-based module templates…
And as improvements in existing features, we will discuss some of them like: dashboards, visual consoles and remote module wizard improvements and enhancements. We also added a Discovery task result view, improvements in alert correlation, dynamic services… among others.
USER EXPERIENCE
The first thing we are going to look at is the different improvements in user experience. Pandora FMS compatibility with Selenium has been updated. Right now we are using Selenium version 3 (before, we used version 2), and this allows you to carry out much more complex and detailed user experience monitoring. An interesting new thing about this Selenium version and this update is that right now you can do conditional monitoring, that is, if you don’t find something on the corresponding page, you can look for something else and execute another action. You may also use data on screen as process variables, something quite useful.
DASHBOARDS
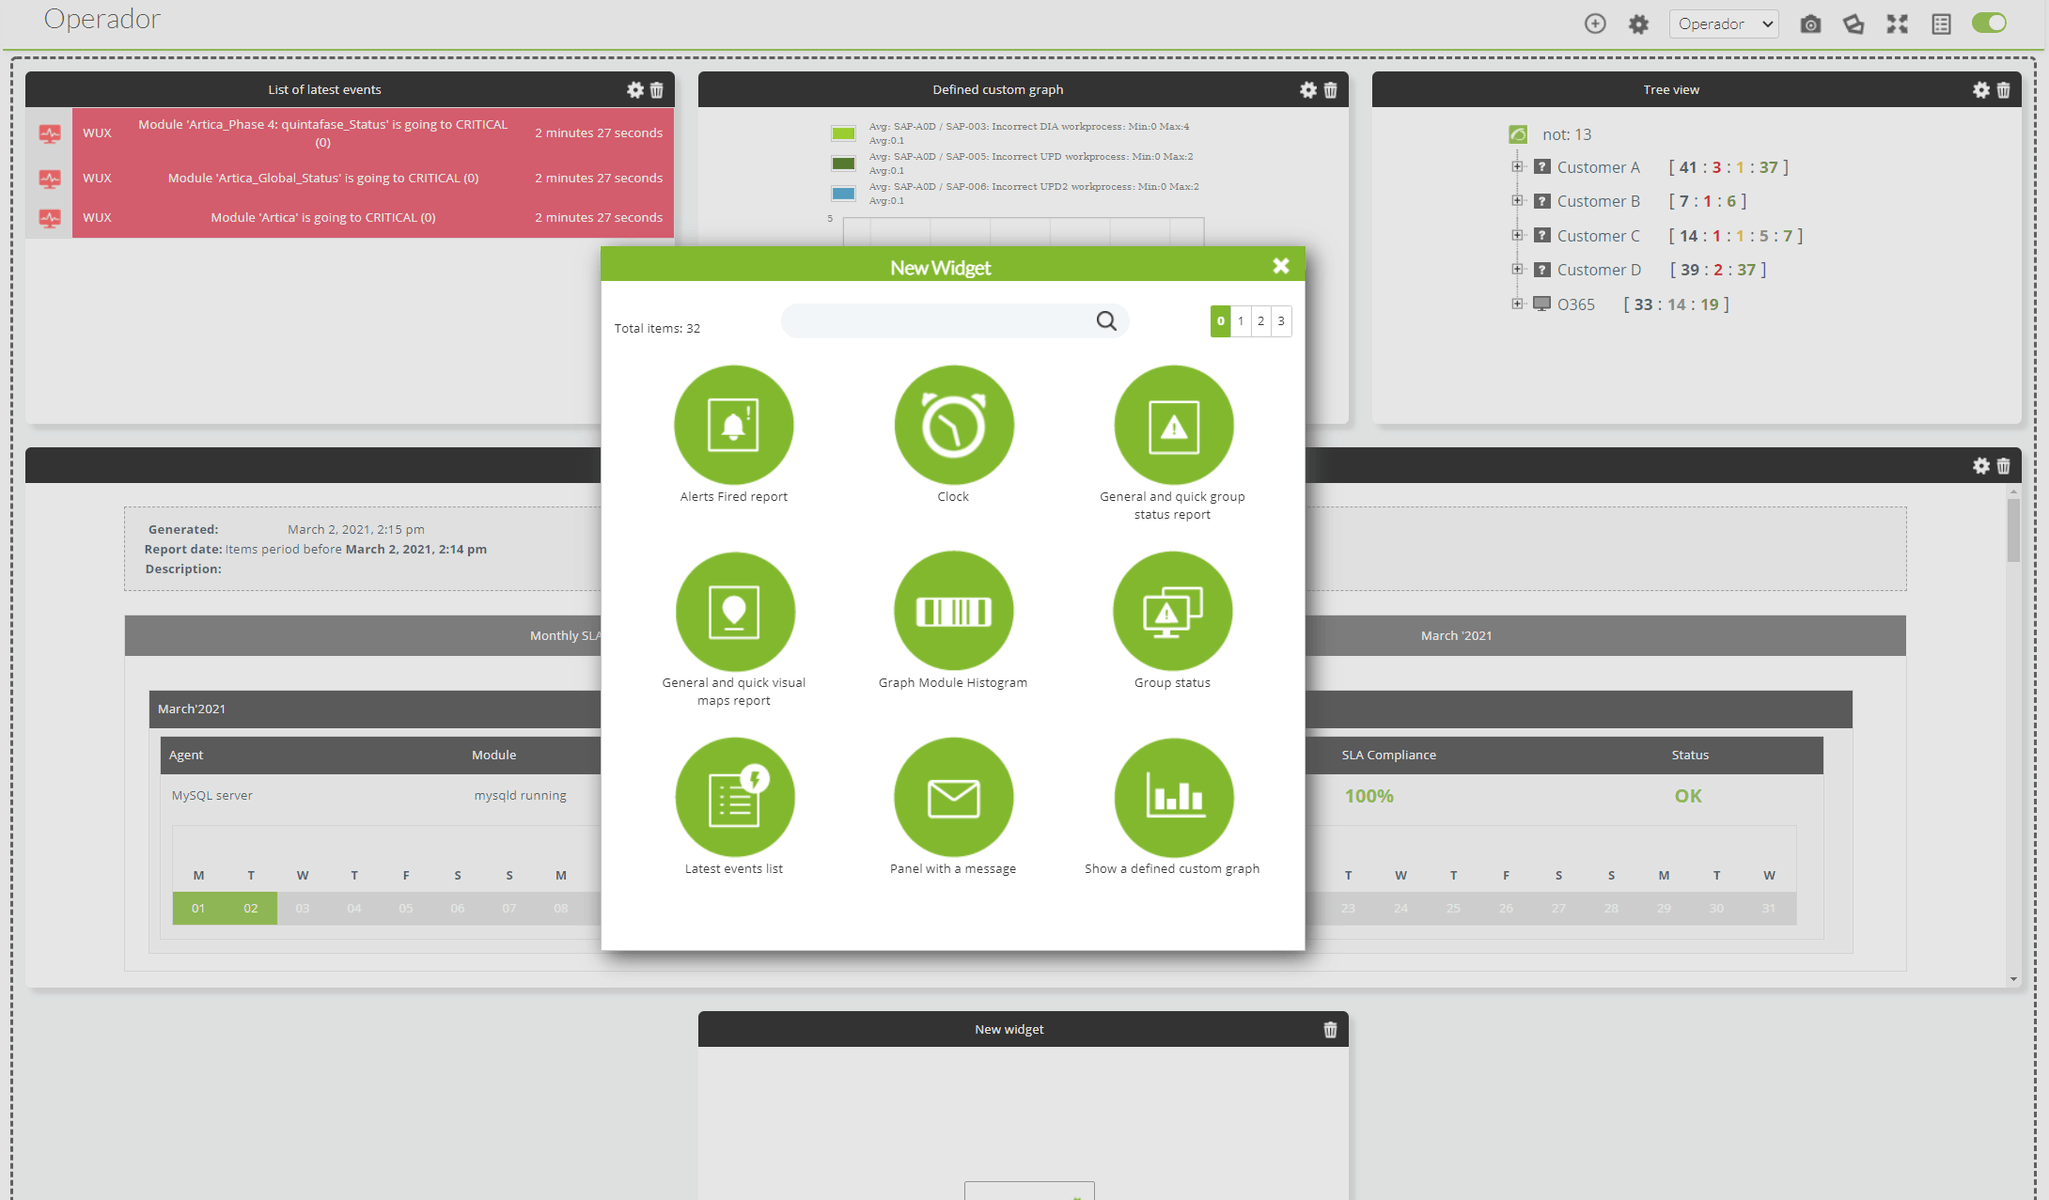
These have been painstakingly improved and now look much better than they did. But they have not only been visually enhanced; the process to configure them has also changed. You no longer have a display view and a modifying view, but now you have a button to switch between read mode and edit mode. We also switched to a much more precise grid adjustment, which now makes it much faster to modify the elements. The option to see new widgets has also been revitalized with the search engine. This is a much better option than going through all the pages looking for what you want.
VISUAL CONSOLES
In a similar way to this dashboard improvement we just mentioned, visual consoles have also been improved. The same format has been followed for them, with a simple button that allows you to access the editing mode. The item view has also been modified. Now it is more dynamic and easier to use. Interesting functions have been added to the map view with new correlations between its maps.
One of these new functions is the element cache, a function that now seems indispensable to us. To give you an example, before, when you entered a dashboard, basically all the information was reset every time the page was refreshed, but now, with this cache, you can prevent elements that you do not want to be refreshed so often (for instance, an icon representing a module that only runs once a day) from doing it. This improves the performance of visual consoles substantially, which is always appreciated of course.
SMART SERVICES
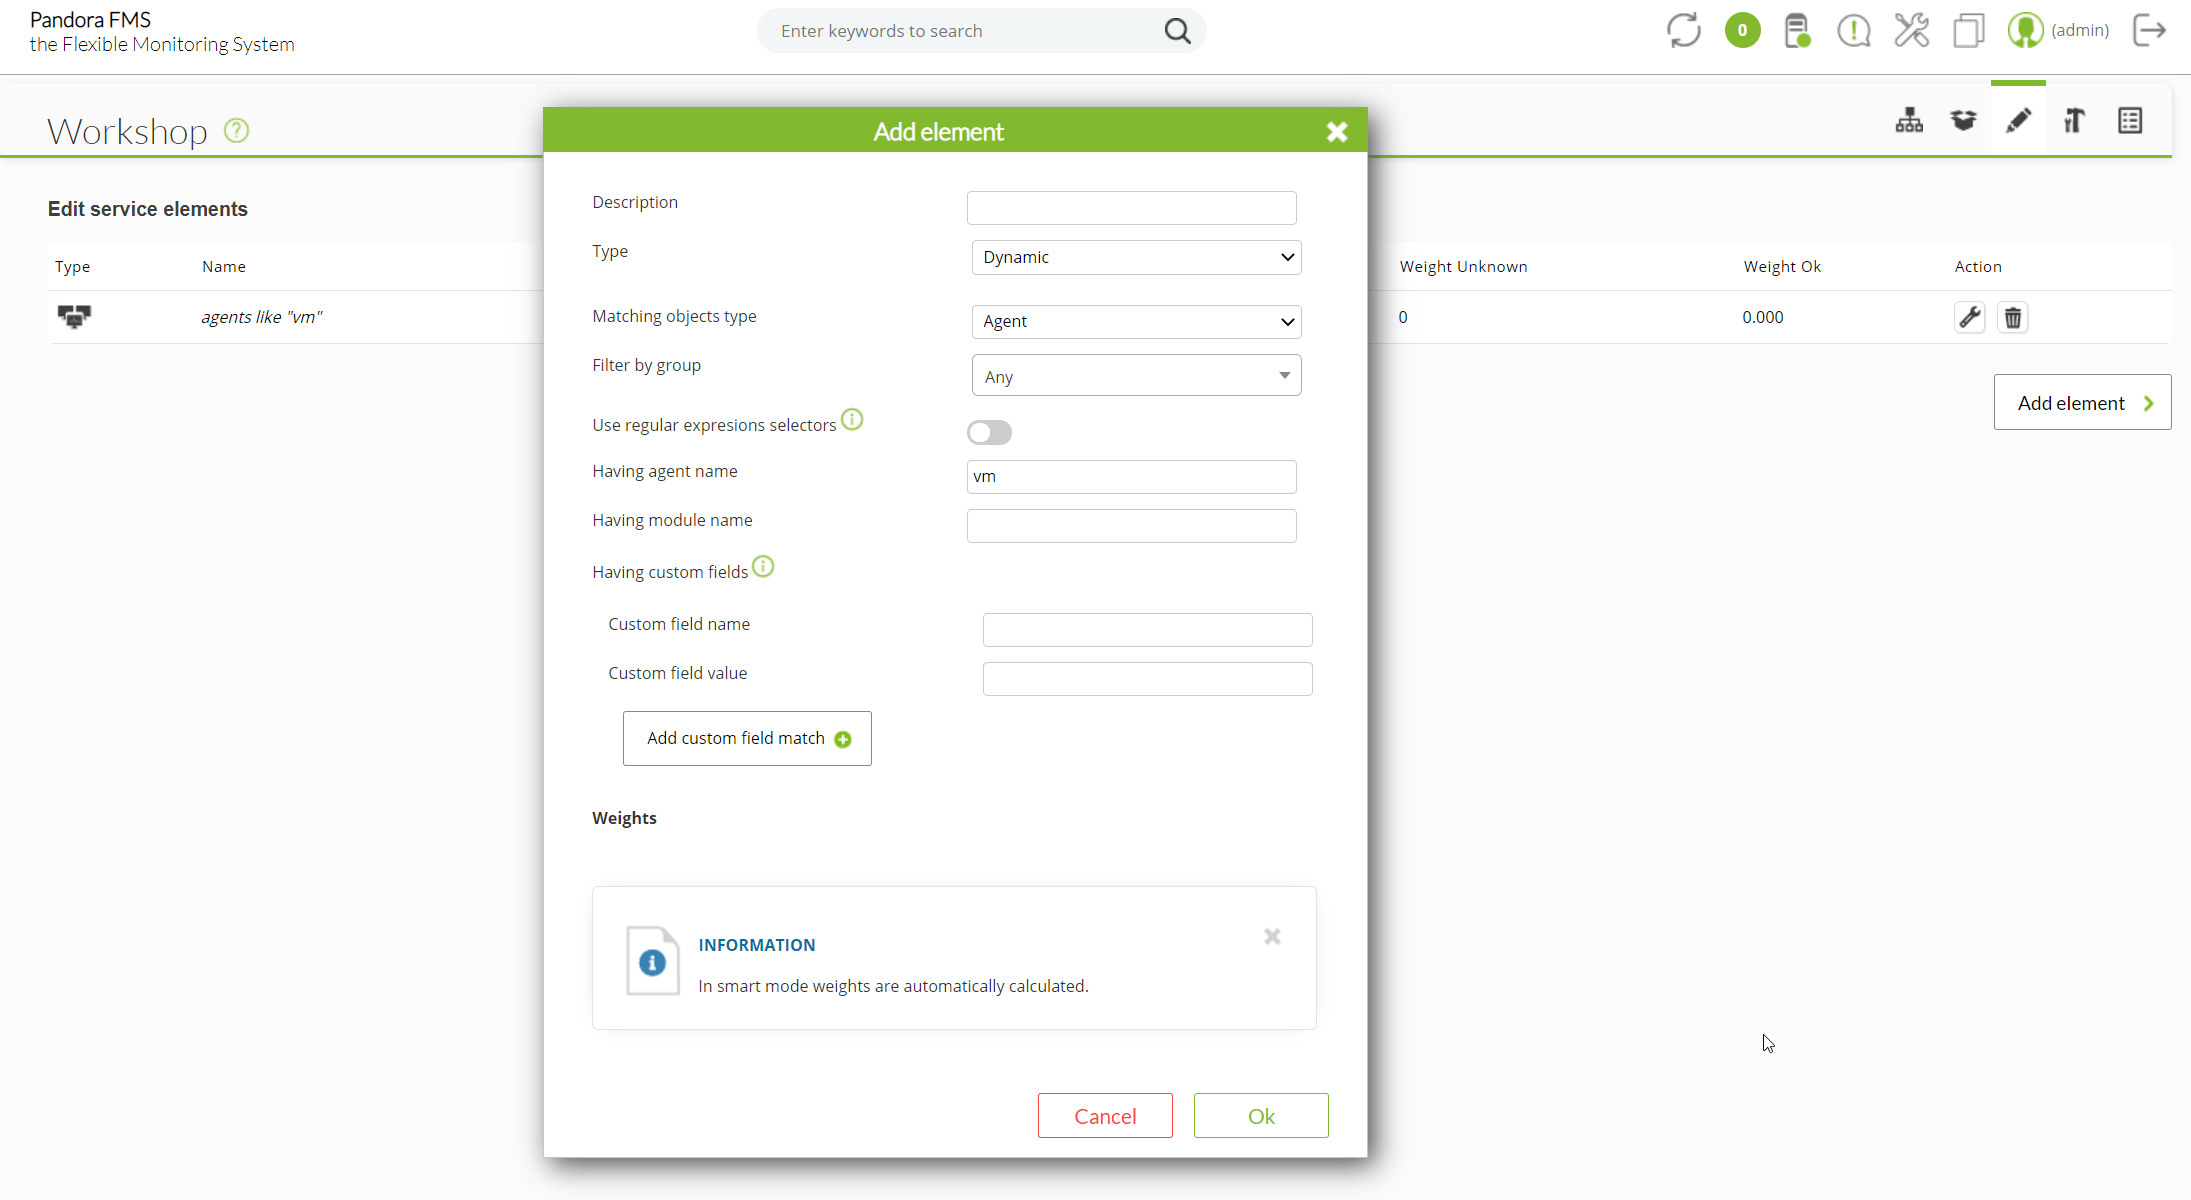
We already know the “services” as they are when using Pandora FMS, and we know that they are hierarchical structures that show the status of a specific service with several elements, such as different servers that are part of a cluster, or even Pandora FMS database, server and console… Previously you had to configure these elements manually, configuring the modules, agents and the weight that each one has in the global structure. Now they have been endowed with a certain intelligence and dynamism that streamlines the process and frees you from all that work, since in the smart mode, among other things, weights are loaded automatically.
IMPROVEMENTS ON DISCOVERY
In Discovery, several features have been renewed and added. If we start with what was already there and it has simply been improved, the recognition tasks themselves should be highlighted. Several options have been revamped and added, from which Auto Discover Known Hardware and Review Results are the most significant.
Thanks to Auto Discover Known Hardware, when you launch a recognition task with SNMP enabled, you can automatically detect which device brand you are looking at. This is based on Private Enterprise Numbers, SNMP identifiers of each brand, for which you can generate module templates in the Module Templates section. One more way to automate remote device monitoring.
Review Results is another pretty cool feature. Has it ever happened to you that you prepared a recognition task, and without realizing it, you set a huge network? It is possible that the license you have does not support such a high number of devices and you get an error in the console. Well, with Review Results, one of the things we avoid is that kind of situation. Taking advantage of the fact that we applied this improvement, we also modified the way Pandora FMS console manages the information coming from recognition, so that you can choose which elements have to be generated and which elements must be discarded before they are even created in Pandora FMS.
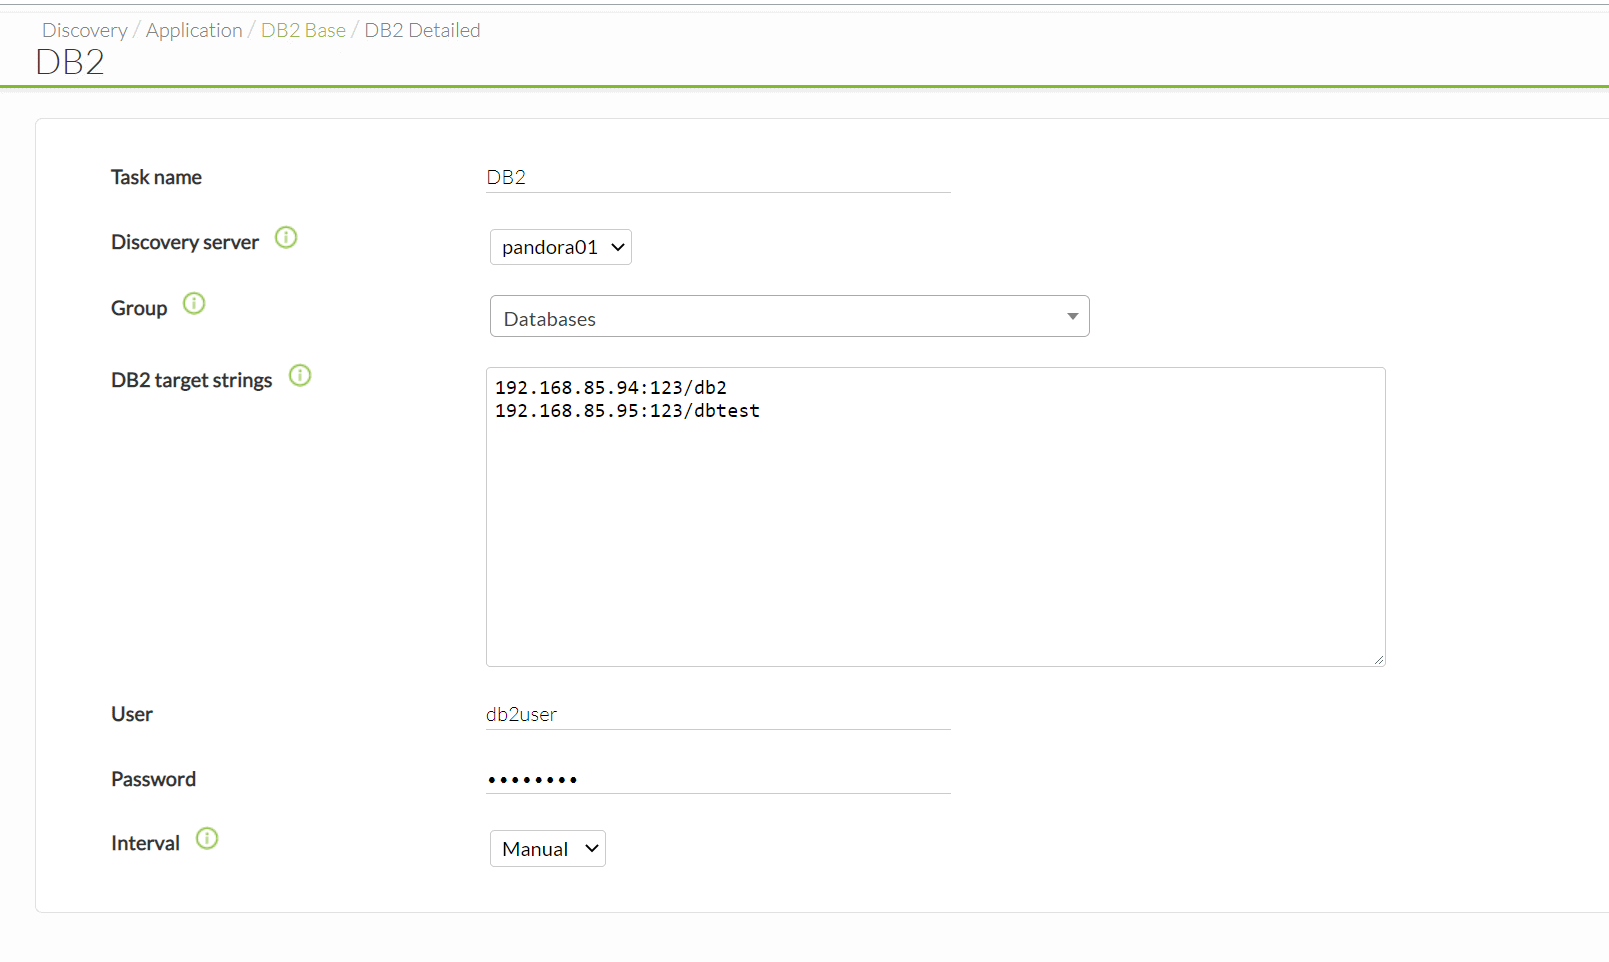
Support for more applications has also been added to Discovery. For instance, DB2 from IBM, which works and is configured quite similarly to Oracle, with quite similar options: username, password, servers, port, database you want to access…
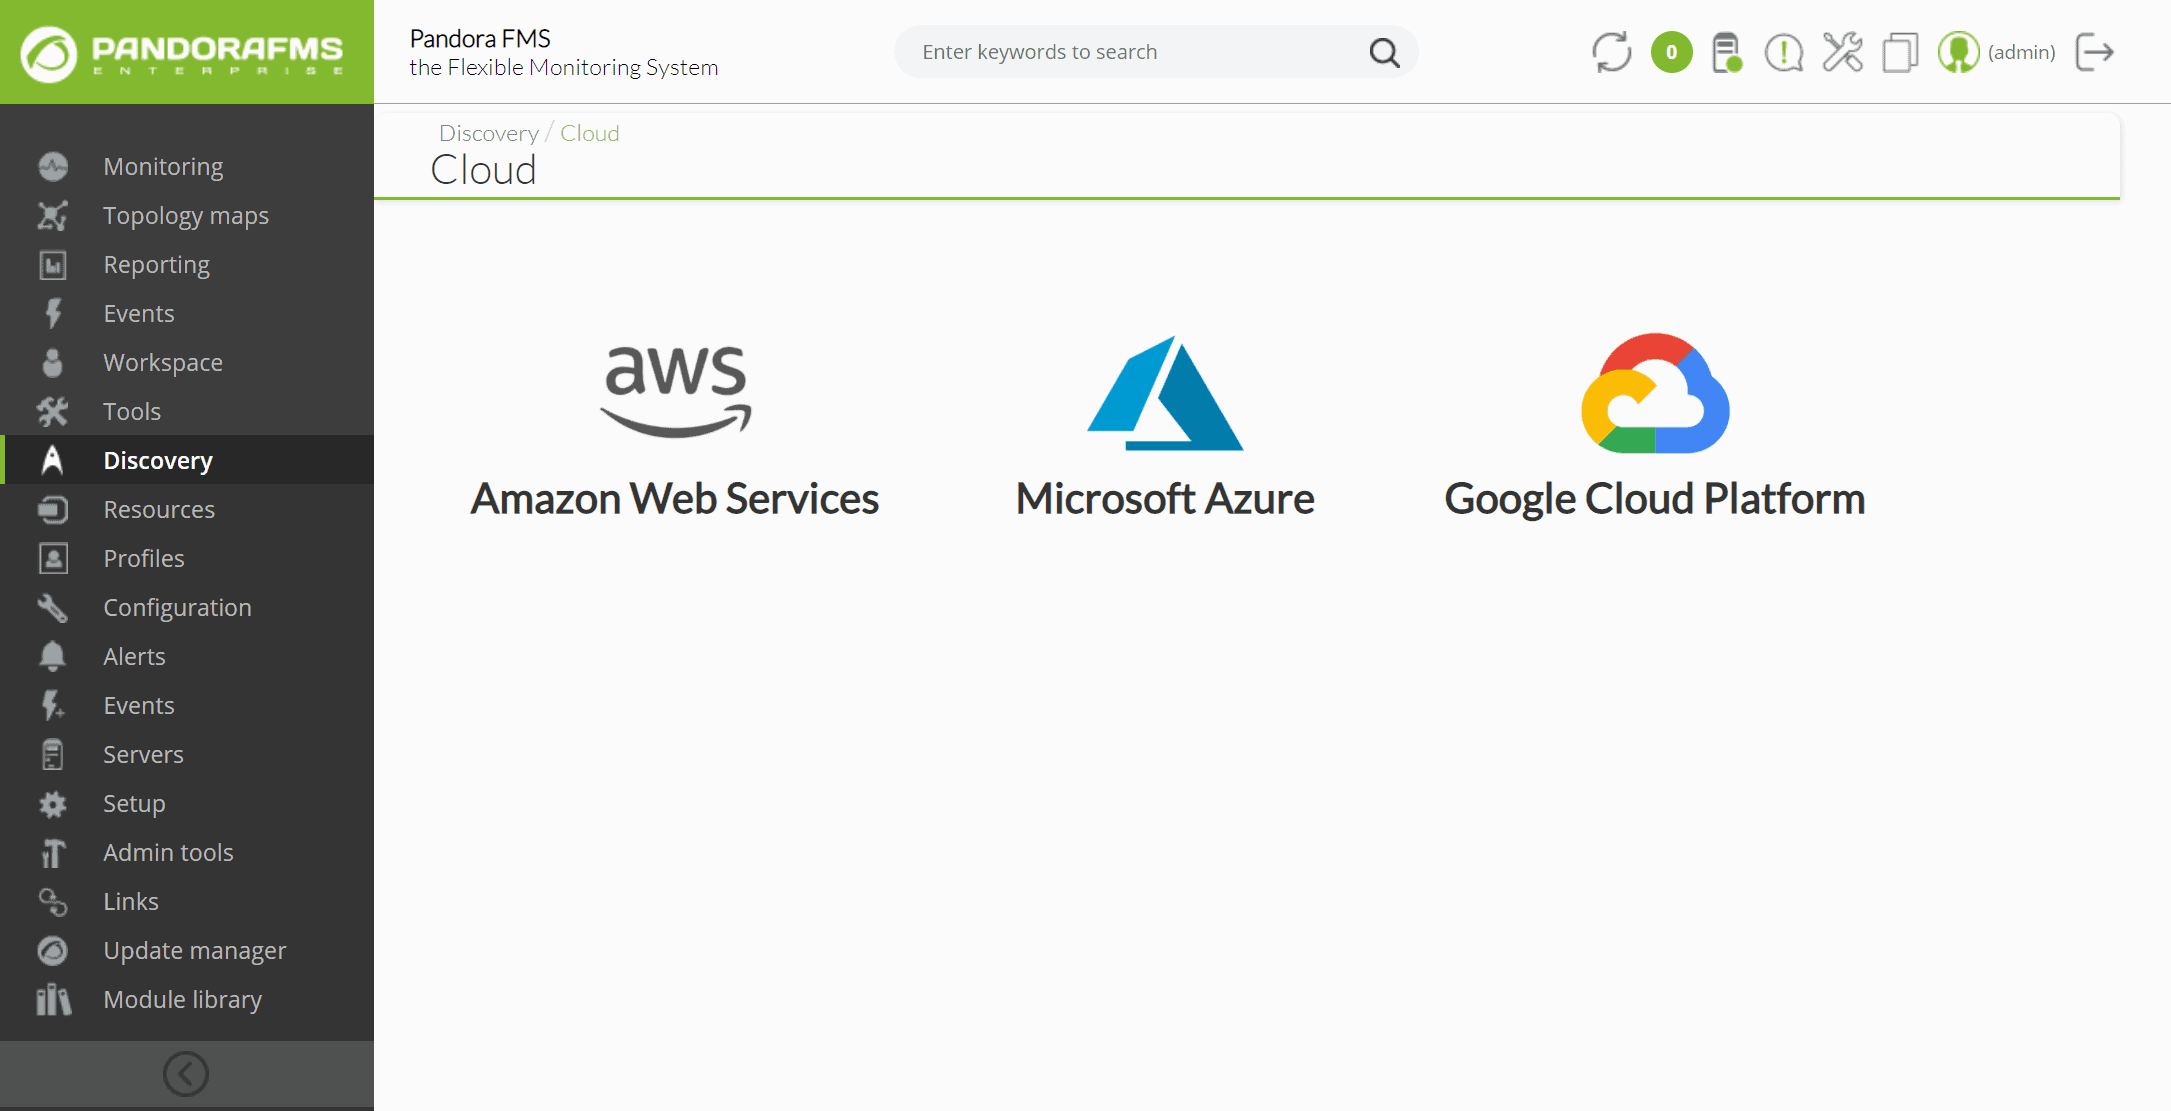
In the Cloud section, we added Google Cloud Platform. Now you have to manage the credentials at Google level. You must enable database encryption and then generate a service user in Google Cloud, which will allow you to download a JSON. With this JSON you will create the authentication account in Pandora FMS. Once this is done, go back to Discovery and use the new credentials to access Google. Choose the monitoring you want, and after waiting a little for it to be processed, it will generate some agents: the main Google Cloud agent, one for each zone where you have machines, and another agent for each virtual machine.
NEW WIZARDS
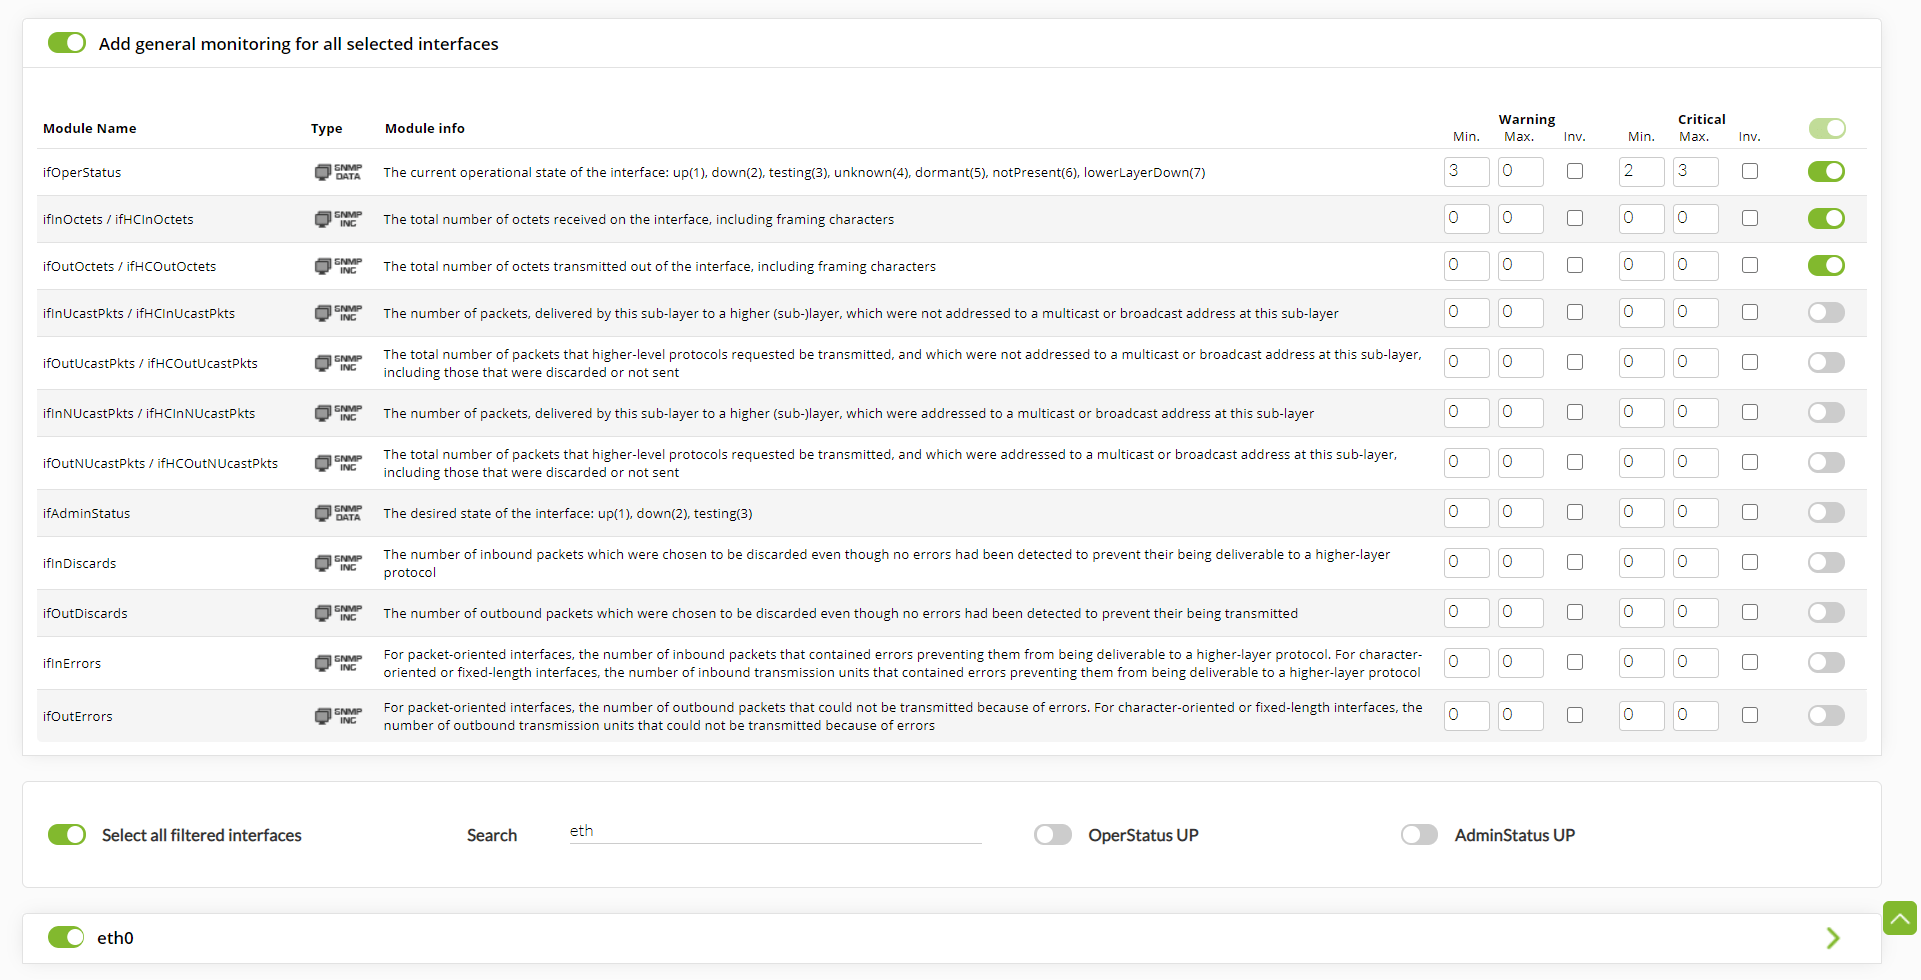
The new wizards for SNMP and WMI are similar to the ones YOU used before, but now they are much more customizable. Compared to the two boxes you had with the agent and module, now you have a much more complete wizard, in which you may indicate the name of the modules that are going to be generated, the description, the thresholds… you may even add monitoring filtering by interface name, using the search engine.
INVENTORY ALERTS
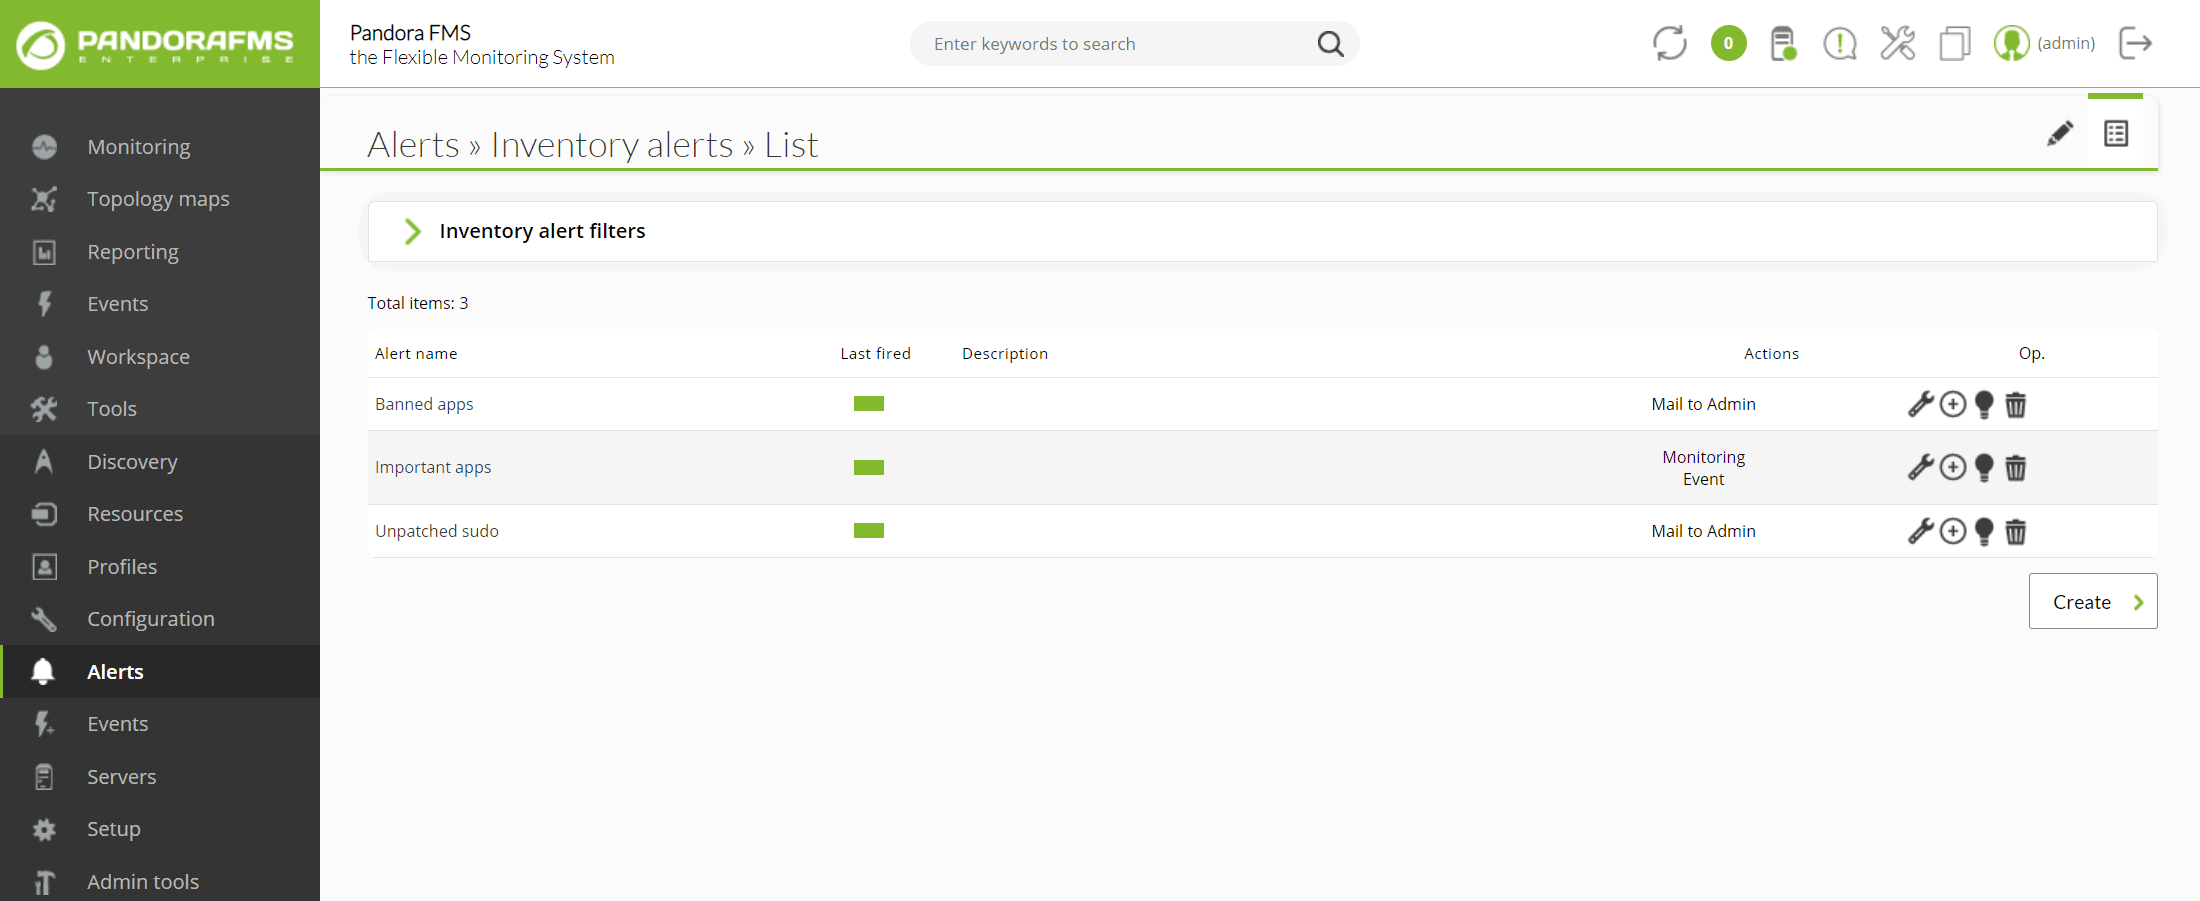
Inventory alerts have been added to configure alerts when something that should be in a machine is missing, when there is something that should not be there or simply when you find something that you want to be alerted about.
EVENT CORRELATION
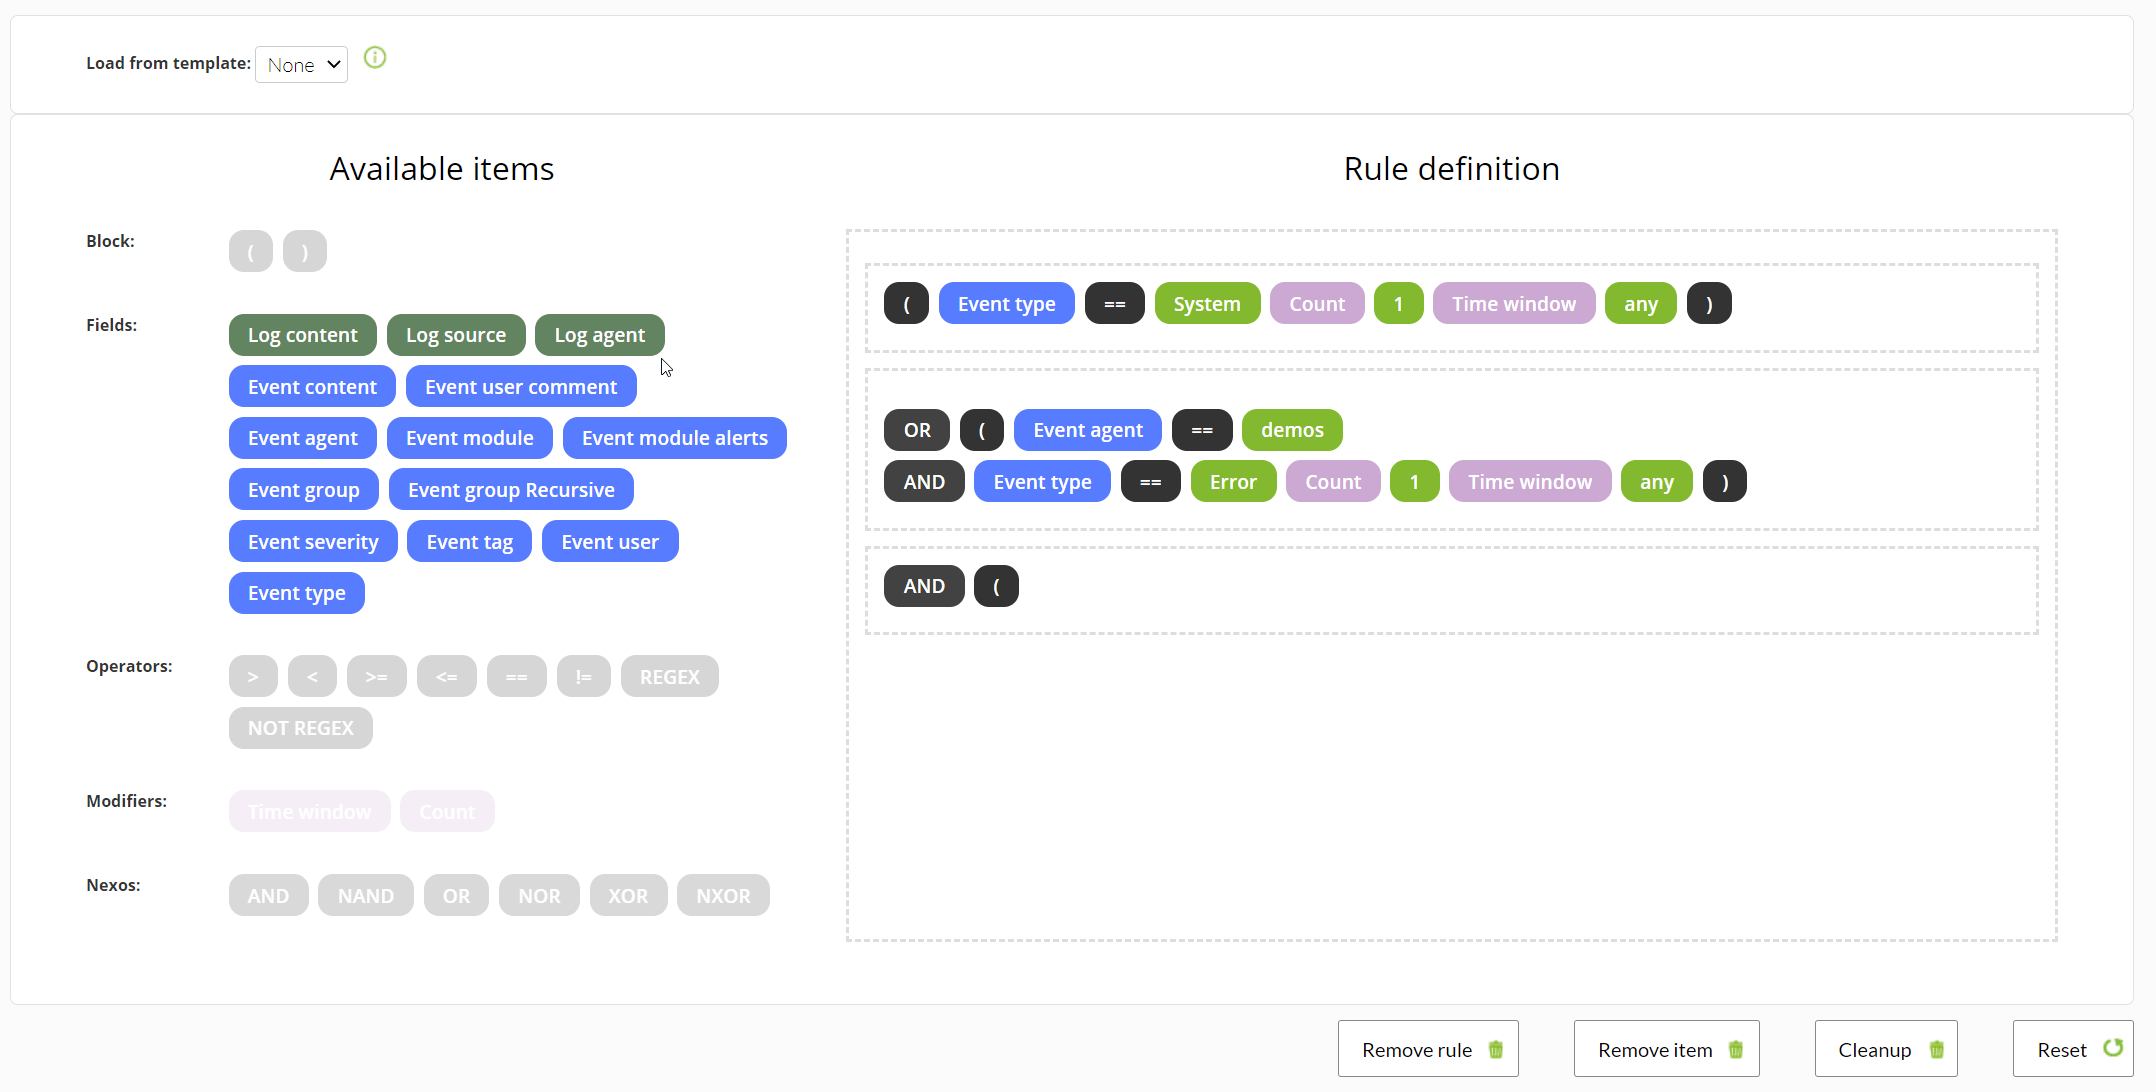
Event alerts also improved in 2020. The event correlation editor interface was updated, so that now you may configure all conditions for an alert in the same section, without the need to generate separate conditions. Now you can also map events with log information in elasticsearch.
Pandora FMS’s editorial team is made up of a group of writers and IT professionals with one thing in common: their passion for computer system monitoring. Pandora FMS’s editorial team is made up of a group of writers and IT professionals with one thing in common: their passion for computer system monitoring.


