Hadoop Monitoring (Open Source) is now possible with this tutorial
Before going into detail about hadoop monitoring (which is written in open source code), first, we need to find out what Hadoop is, which is related to Big Data and also, we need to know how to handle huge amounts of data. For starters, let’s say that the drawbacks lie not only in the quantity but also in the heterogeneity of the data. In other words, to be more specific, it is necessary to bear in mind that problems arise by quantity, with heterogeneity.
Regarding the heterogeneity of big data, we must bear in mind that there are three types of data: structured, semi-structured and unstructured data. The HDFS system (The Hadoop Distributed File System) is based on structured data, such as banking transactions and operating data, among others. So, Hadoop focuses on semi-structured data as well as those that are structured such as text, Facebook posts, audios, videos, records and so on.
On the other hand, we need to point out that the technology of the Hadoop system has been developed and demand levels have grown thanks to Big Data, which, mostly, consists of unstructured data and different formats. Now, the main problem is the storage of big amounts of data, since it is not possible to store them in the traditional system.
The second problem is that the storage of heterogeneous data is complex. Storage is only part of a problem, since the amount of data is not only huge but also, it is found in various formats. Consequently, we need to make sure that we have a system to store this heterogeneity of data, which are generated from different sources.
The third problem to be analysed is about the access and speed of processing. The capacity of hard disks is certainly increasing, although the speed of transfer and the speed of access, are not increasing at the same speed. For example:
In case we only have an I/O channel of 100mbps, processing 1 TB of data, the process itself could take almost three hours (2.90 hours). If we have about four machines, with four I/O channels for the same amount of data, which is 1 TB, the process will “only” take about 43 minutes. This example is perfect so that we immediately realize how important is to know how to monitor Hadoop.
Do you want to know more about application monitoring?
Pandora FMS Enterprise is capable of monitoring the most popular applications and databases. Click here and find out…
Let’s start by saying that there are many tools to analyse and optimize the performance of a Hadoop cluster both written in open source (which are free) and also commercial ones. Now, let’s have a look at the open source tools. It turns out that each component of Hadoop (when it comes to open source) comes packaged with its administrative interface, which, can be used to collect performance metrics of the entire cluster.
However, unfortunately, adding these metrics for the correlation of multiple and different sources is already a challenge. But, you can do it yourself, through a simple guide that we will show. This is mainly a guide to collect HDFS, YARN and MapReduce performance metrics, using the HTTP APIs exposed for each technology. We need to point out that the Apache Ambari Project is a great open source offer for Hadoop management and performance analysis, which provides users with a graphical interface that is quite well designed for cluster management.
In other words, let’s say that in a single interface, you can provide, manage and monitor clusters of thousands of machines. We need to mention that it is an excellent tool to work and also to monitor Hadoop. Let’s see how we can collect Hadoop metrics, we will mainly focus on monitoring the “health” and performance of Hadoop, which provides a wide and varied range of performance metrics about the functioning of assignments, health and the use of resources.
We will also let you know how to collect metrics of the most important components of Hadoop, such as HDFS, YARN and MapReduce, but using standard development tools, as well as other specialised tools such as Cloudera Manager and Apache Ambari.
Collecting HDFS metrics
HDFS delivers metrics from two sources
The DataNodes and the Name Node, which, for the most part, each metric type must be collected at the point of origination. Both the NameNode and DataNodes emit metrics over an HTTP interface as well as via JMX. This way, we will focus on the following three topics:
- Collecting NameNode metrics through API.
- Collecting DataNode metrics through API.
- Collecting HDFS metrics through JMX.
NameNode HTTP API
It turns out that NameNode offers a summary of performance and health metrics, through a web UI. This user interface is accessible via port 50070, so point a web browser at: http://namenodehost:50070
While a summary is advisable and convenient to have, it is possible that some readers want to delve into some other metrics so, in order to see all the metrics, point your browser to htpp://namenodehost:50070/jmx
Whether you use the API or JMX, most of the NameNode metrics can be found under the MBean
Hadoop:name=FSNamesystem,service=NameNode
VolumeFailuresTotal, NumLiveDataNodes, NumDeadDataNodes, NumLiveDecomDataNodes, NumStaleDataNodes can be found under the MBean
Hadoop:name=FSNamesystemState,service=NameNode
DataNode HTTP API
An overview of the health of your DataNodes is available in the NameNode dashboard, under the Datanodes tab (http://localhost:50070/dfshealth.html#tab-datanode).
Now, to get a more detailed view of an individual DataNode, we can access its metrics through the DataNode API.
By default, DataNodes expose absolutely all of their metrics on port 50075, via the jmx endpoint. For example, in the case of placing jmx. the situation could lead to misunderstandings. As we are told in Pandora FMS, “… a monitoring system must be simple and yet effective”.
On the other hand, let’s clarify that the fact of hitting this endpoint on your DataNode with your browser or curl, gives you all the metrics. Now, we will take a look at the NameNode and DataNode metrics through JMX.
NameNode and DataNode metrics via JMX
Like Kafka, Cassandra, and other Java-based systems, both the NameNode and DataNodes also exposes metrics via JMX.. Then, the remote agent interfaces of JMX are disabled by default. To enable them, set the following JVM options in hadoop-env.sh which are usually found in $HADOOP_HOME/conf
So, now we have something like this:
export HADOOP_NAMENODE_OPTS="-Dcom.sun.management.jmxremote
Dcom.sun.management.jmxremote.password.file=$HADOOP_HOME/conf/jmxremote.password

Dcom.sun.management.jmxremote.ssl=false

Dcom.sun.management.jmxremote.port=8004 $HADOOP_NAMENODE_OPTS"
export HADOOP_DATANODE_OPTS="-Dcom.sun.management.jmxremote
Dcom.sun.management.jmxremote.password.file=$HADOOP_HOME/conf/jmxremote.password

Dcom.sun.management.jmxremote.ssl=false

Dcom.sun.management.jmxremote.port=8008 $HADOOP_DATANODE_OPTS"
The previous configuration, obtained from https://goo.gl/D9DAeK, will open port 8008 on the DataNode, with password authentication enabled (we suggest taking a look at how to Set up a Single-User Environment for more information on configuring the JMX remote agent).
Once enabled, you can connect using any JMX console, like JConsole or Jmxterm. The following shows a Jmxterm connection to the NameNode, first listing available MBeans, and then drilling into the Hadoop:name=FSNamesystem,service=NameNode MBean.
Collecting MapReduce counters
● MapReduce counters provide information on MapReduce task execution, like CPU time and memory used. They are dumped to the console when invoking Hadoop jobs from the command line, which is great for spot-checking as jobs run, but more detailed analysis requires monitoring counters over time.
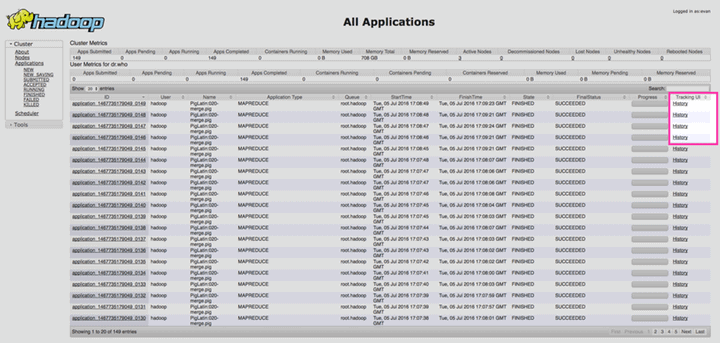
● The ResourceManager also exposes all MapReduce counters for each job. To access MapReduce counters on your ResourceManager, first navigate to the ResourceManager web UI at http://resourcemanagerhost:8088.
Find the application you’re interested in, and click “History” in the Tracking UI column:
Then, on the next page, click “Counters” in the navigation menu on the left
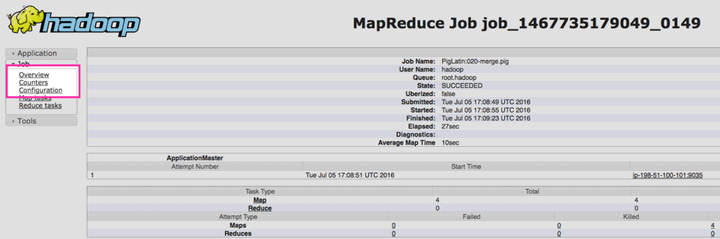
And finally, you should see all of the counters collected associated with your job:

Collecting Hadoop YARN metrics
YARN and HTTP API
By default, YARN exposes all of its metrics on port 8088, via the jmxendpoint. Hitting this API endpoint on your ResourceManager gives you all of the metrics from part two of this series. And as with HDFS, when querying the JMX endpoint you can specify MBeans with the qry parameter:
$ curl resourcemanagerhost:8088/jmx?qry=java.lang:type=Memory
To get only the metrics from part two of the series, you can also query the ws/v1/cluster/metrics endpoint:
Third-party tools
Native collection methods are useful for spot checking metrics in a pinch, but to see the big picture requires collecting and aggregating metrics from all your systems for correlation.
Two projects, Apache Ambari and Cloudera Manager, offer users a unified platform for Hadoop administration and management. These projects both provide tools for the collection and visualization of Hadoop metrics, as well as tools for common troubleshooting tasks.
Apache Ambari
The Apache Ambari project aims to make Hadoop cluster management easier by creating software for provisioning, managing, and monitoring Apache Hadoop clusters. It is a great tool not only for administering your cluster, but for monitoring, too.
Installation instructions for multiple platforms can be found here. Once installed, configure Ambari with ambari-server setup
Most users should be fine with the default configuration options, though you might want to change the Ambari user from the default root user. You should be aware, Ambari will install and use the PostgreSQL database package by default; if you already have your own database server installed, be sure to “Enter advanced database configuration” when prompted.
Once configured, start the server with: service ambari-server start
To connect to the Ambari dashboard, point your browser to AmbariHost:8080 and login with the default user admin and password admin.
Once logged in, you should be met with a screen similar to the one below:
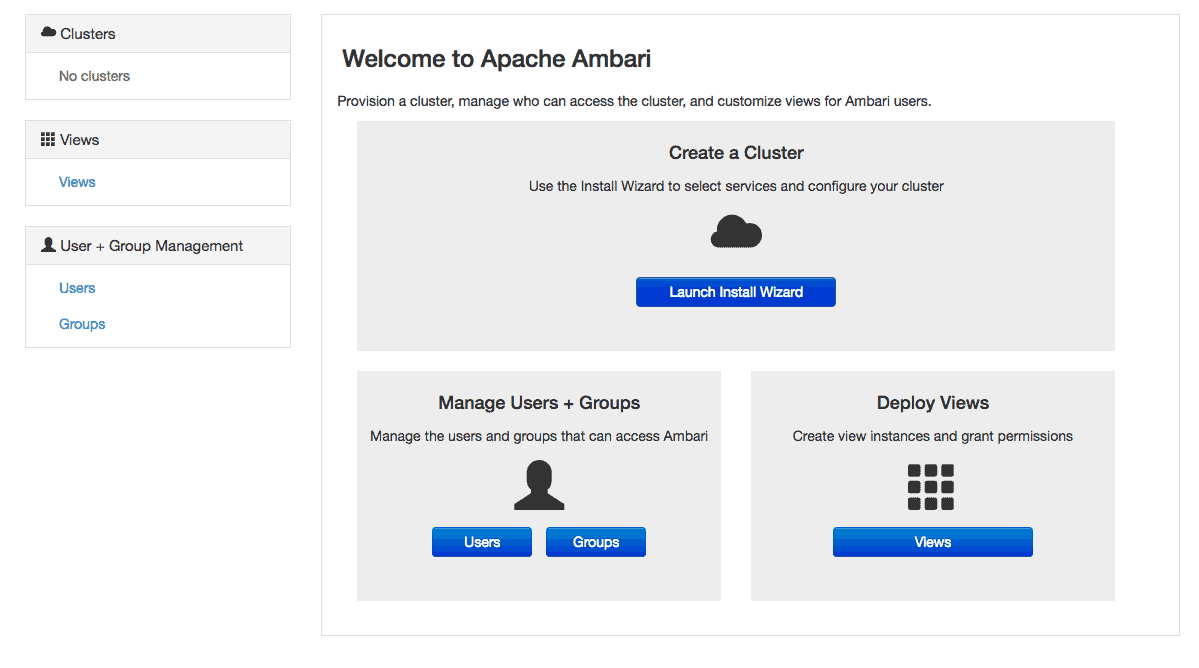
To get started, select “Launch Install Wizard”. On the series of screens that follow, you will be prompted for hosts to be monitored and credentials to connect to each host in your cluster, then you’ll be prompted to configure application-specific settings.
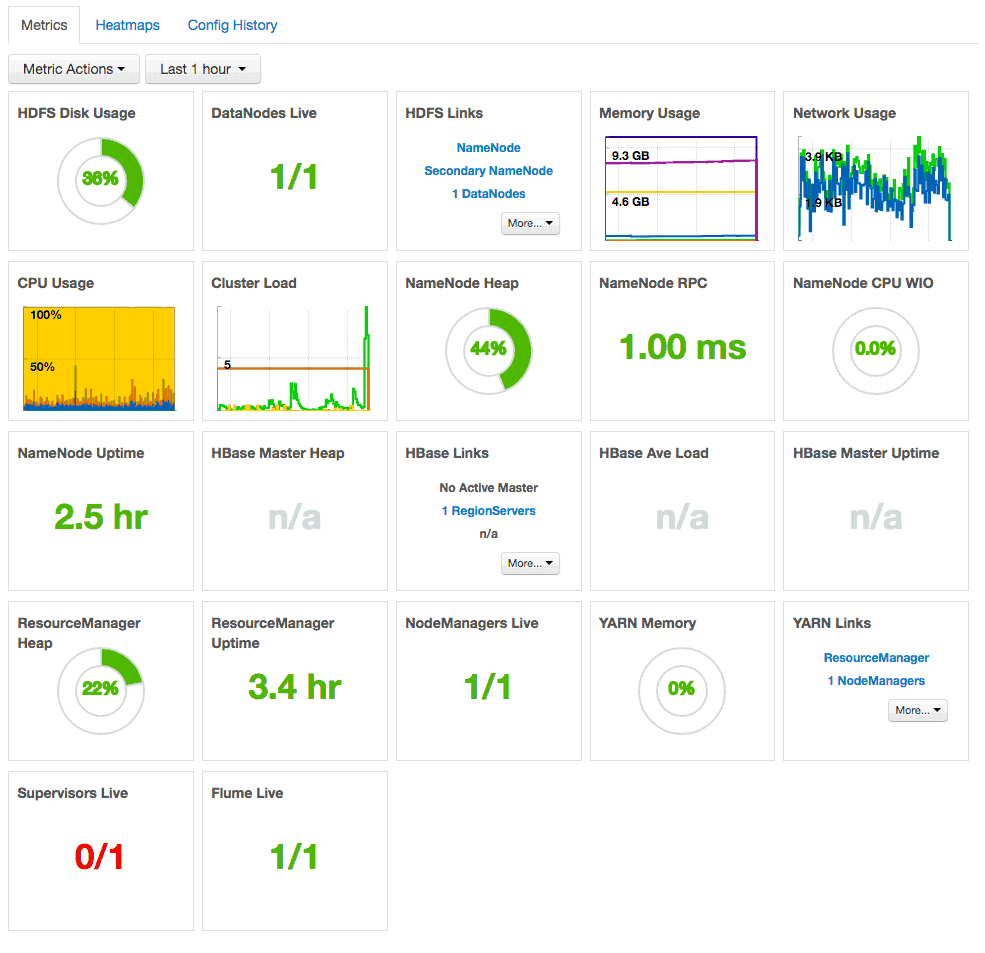
Configuration details will be specific to your deployment and the services you use. Once you’re all set up, you’ll have a detailed dashboard like the one below, complete with health and performance information on your entire cluster, as well as links to connect to the web UIs for specific daemons like the NameNode and ResourceManager.
Cloudera Manager
Another third-party tool, Cloudera Manager, is a cluster management method that ships as part of the Cloudera Hadoop commercial distribution, but is also available as a free download. In the case of this tool, once we have downloaded and installed the respective installation packages and configured a database for Cloudera Manager, we must start the server with:
service cloudera-scm-server start
Finally, if you need any further information, you can visit the Pandora FMS website, where you will find everything related to monitoring.
About Pandora FMS
Pandora FMS is a flexible monitoring system, capable of monitoring devices, infrastructures, applications, services and business processes.
Of course, one of the things that Pandora FMS can control is the hard disks of your computers.
Would you like to know more about what Pandora FMS can offer you? Discover it by entering here: https://pandorafms.com
If you have more than 100 devices to monitor, you can contact us through the following form: https://pandorafms.com/en/contact/
Also, remember that if your monitoring needs are more limited you have at your disposal the OpenSource version of Pandora FMS. Find more information here: https://pandorafms.org
Rodrigo Giraldo, freelance technical writer. Lawyer and astrobiology student, he is passionate about computers, reading and scientific research.