DRBD (Distributed Replicated Block Device) is a system for the distributed replicated storage for the Linux platform. It allows to have a remote mirror in real time (equivalent to RAID-1 in network). DRBD refers both the software (kernel module and management tools), and some specific logic devices managed by the software.
The DRBD software is a free software published under the terms of the GNU General Public License version 2.
To install DRBD for systems with or without Pandora FMS you can get support from its documentation http://www.drbd.org/docs/about/.
If what you need is to install Pandora FMS in a system of this type, you can find an explanation in our WIKI that talks about how to do the installation. http://wiki.pandorafms.com/index.php?title=Pandora:Documentation_en:DRBD
Among the utilities of the DRBD we can find several commands that will be useful to monitor our DRBD system (drbd-overview, drbdadm, crm status, cat /proc/drbd).


1.- CLUSTER GENERAL STATUS
In DRBD , resource is the collective terms that refers to all aspects of an specific replicated data group. These include:
Resource Name. This can be any name of arbitrary US- ASCII that doesn’t contain blank spaces in which the resource refers to.
Volumes. Any resource is a replication group that consist on one or more volumes that share a common replication flow. DRBD ensures the writing fidelity trough all tha volumes in the resource. The volumes are numerated starting by 0, and there could be up to 65.535 volumes in a single resource. One volume contains the group of replicated data, and a metadata group for the DRBD internal use.
At a drbdadm level, with the volume of one resource it could be considered by the name of the resource and the number of volume as <resource>/<volume> .
DRBD Device. This is a virtual block device managed by DRBD. It has 147 devices and their minor numbers are numerated from 0 onwards, as usual. Each DRBD device corresponds to a volume in a resource. The device of the associated block is usually called /dev/drbdX , where X is the minor device number. DRBD allows also blocks of device names defined by the user that should,however, start by drbd_.
Connection. A connection is a link of comunication between two hosts that share a group of replicated data. At present, each resource implies only two hosts and exactly a connection between these servers, so, mostly the terms of the resources and the connection could both be used.
At a drbdadm level , one connection is addressed in the resource name.
Do you want to know more about application monitoring?
Pandora FMS Enterprise is capable of monitoring the most popular applications and databases. Click here and find out…
How to know the name of the resources that are installed in the system?
The system administrator that has installed the drbd is the person in charge of configuring the name of the resources. Through the drbd-overview command we can get a list of all the resources configured in the system and from there, get information about each one of the resources, as we show next.
The drbd-overview command is useful to get general information of the cluster. This command shows the status of the resource, and also its role, the status of their disks, the filesystem installed and its percentage of use.
- Space used in shared partition
module_begin
module_name % Use filesystem <resource>
module_type generic_data
module_exec drbd-overview <resource> | gawk ‘{print $12}’ | tr -d %
module_unit %
module_end
Besides the possibility of geting the status of the resource through the drbd-overview we can do in the same way through the drbdadm cstate command.
The resource normal status is Connected. In case that it would be another one, it would be possible to put the status of the module in critical or warning status, depending of the status that we configure. In the example it will be shown in the critical status as long as the status would not be Connected.
module_begin
module_name Status drbd <resource>
module_type generic_data_string
module_exec drbdadm cstate <resource>
module_str_critical Connected
module_critical_inverse 1
module_end
We can get the current role of the resource through the drbdadm role command. The role of the local node is shown in first place, followed by the role of partner role that is shown after the bar. In this module, it is important the change of status. When an alert is created, the appropiate thing to do would be that in case of change the alert would be fired. Another way is to configure the critical status, for example if the string is not (Primary/Secondary) for the main node and (Secondary/Primary) for the second node.
Ex-. Primary/Secondary
module_begin
module_name Role drbd <resource>
module_type generic_data_string
module_exec ddrbdadm role <resource>
module_str_critical Primary/Secondary
module_critical_inverse 1
module_end
In order to monitor the status of the filesystem associated to each resource, we will use the drbdadm dstate command. The normal status of the resource is Connected. In case that the status would be another one, it would be possible to write the module status in critical or warning.
Ex.- UpToDate/UpToDate
module_begin
module_name Filesystem Status
module_type generic_data_string
module_exec drbdadm dstate <resource>
module_str_critical UpToDate/ UpToDate
module_critical_inverse 1
module_end
2.- PERFORMANCE INDICATORS
Through the command cat /proc/drbd we get several indicators of the cluster performance:
$ cat /proc/drbd
version: 8.4.0 (api:1/proto:86-100) GIT-hash: 09b6d528b3b3de50462cd7831c0a3791abc665c3 build by [email protected], 2011-10-12 09:07:35 0: cs:Connected ro:Primary/Secondary ds:UpToDate/UpToDate C r—–
ns:0 nr:0 dw:0 dr:656 al:0 bm:0 lo:0 pe:0 ua:0 ap:0 ep:1 wo:b oos:0
** Before generating the modules it is important to know to which volume is associated the resource in each case. For the volume and the resource to which it is associated to, we can know it through the command “ service drbd status”, being the output something like this:
#service drbd status
drbd driver loaded OK; device status: version: 8.3.7 (api:88/proto:86-91) GIT-hash: ea9e28dbff98e331a62bcbcc63a6135808fe2917 build by root@drbd1, 2013-11-05 18:41:46
m:res cs ro ds p mounted fstype
0:srv Connected Primary/Secondary UpToDate/ UpToDate C
As we see the previous output, to configure the following modules, you should change the X of the configuration of them by the order in which they are shown in the previous command. For example, in the previouse case we have only one resource configured, so we change the X by a 1.
0:srv Connected Primary/Secondary UpToDate/ UpToDate C
1:var Connected Primary/Secondary UpToDate/ UpToDate C
To extract the modules that correspond to the srv resource, we should change the X by a 1 that is which is on the first palce, and to extract the modules of the var resource, we use 2, so this is in the second place, and so on.
ns ( Network Send ) . Volume of net data sent to the partner via the network connection; in Kbyte.
module_begin
module_name Network_Send_<resource>_DRBD
module_type generic_data
module_exec cat /proc/drbd | grep ns: | gawk ‘{print $1}’ | tr -d ns: | head -X | tail -1
module_end
nr ( Network received ) . Volume of net data received by the partner via the network connection; in Kbyte.
module_begin
module_name Network_Received_<resource>_DRBD
module_type generic_data
module_exec cat /proc/drbd | grep nr: | gawk ‘{print $2}’ | tr -d nr: | head -X | tail -1
module_end
dw (Disk Write ) . Net data written on local hard disk; in Kbyte.
module_begin
module_name Disk_write_<resource>_DRBD
module_type generic_data
module_exec cat /proc/drbd | grep dw: | gawk ‘{print $3}’ | tr -d dw: | head -X | tail -1
module_end
dr ( Disk Read ) . Net data read from local hard disk; in Kbyte.
module_begin
module_name Disk_read_<resource>_DRBD
module_type generic_data
module_exec cat /proc/drbd | grep dr: | gawk ‘{print $4}’ | tr -d dr: | head -X | tail -1
module_end
al ( Activity Log ) . Number of updates of the activity log area of the meta data.
module_begin
module_name Activity_log_<resource>_DRBD
module_type generic_data
module_exec cat /proc/drbd | grep al: | gawk ‘{print $5}’ | tr -d al: | head -X | tail -1
module_end
bm (Bit Map) . Number of updates of the bitmap area of the meta data.
module_begin
module_name Bit_map_<resource>_DRBD
module_type generic_data
module_exec cat /proc/drbd | grep bm: | gawk ‘{print $6}’ | tr -d bm: | head -X | tail -1
module_end
lo ( Local Count) . Number of open requests to the local I/O sub-system issued by DRBD.
module_begin
module_name Local_count_<resource>_DRBD
module_type generic_data
module_exec cat /proc/drbd | grep lo: | gawk ‘{print $7}’ | tr -d lo: | head -X | tail -1
module_end
pe (Pending) . Number of requests sent to the partner, but that have not yet been answered by the latter.
module_begin
module_name Pending_<resource>_DRBD
module_type generic_data
module_exec cat /proc/drbd | grep pe: | gawk ‘{print $8}’ | tr -d pe: | head -X | tail -1
module_end
ua ( Unacknowledged ) . Number of requests received by the partner via the network connection, but that have not yet been answered.
module_begin
module_name Unacknowledged_<resource>_DRBD
module_type generic_data
module_exec cat /proc/drbd | grep ua: | gawk ‘{print $9}’ | tr -d ua: | head -X | tail -1
module_end
ap ( Application Pending ) . Number of block I/O requests forwarded to DRBD, but not yet answered by DRBD.
module_begin
module_name Aplication_pending_<resource>_DRBD
module_type generic_data
module_exec cat /proc/drbd | grep ap: | gawk ‘{print $10}’ | tr -d ap: | head -X | tail -1
module_end
ep ( epochs ) . Number of epoch objects. Usually 1. Might increase under I/O load when using either the barrier or the none write ordering method.
module_begin
module_name Epoch_<resource>_DRBD
module_type generic_data
module_exec cat /proc/drbd | grep ep: | gawk ‘{print $11}’ | tr -d ep: | head -X | tail -1
module_end
wo ( Write Order ) . Currently used write ordering method: b(barrier), f(flush), d(drain) or n(none).
module_begin
module_name Write_Order_<resource>_DRBD
module_type generic_data_string
module_exec cat /proc/drbd | grep wo: | gawk ‘{print $12}’ | tr -d ua: | head -X | tail -1
module_end
oos ( Out of Sync ) . Amount of storage currently out of sync; in Kbytes.
module_begin
module_name Out_of_sync_<resource>_DRBD
module_type generic_data
module_exec cat /proc/drbd | grep oos: | gawk ‘{print $13}’ | tr -d oos: | head -X | tail -1
module_end
3.- INSTANCE STATUS
Besides these commands, if we have configured the cluster through crm, we can monitor other things through the use of the command crm_mon -1 or crm status.
With the output of this command we can see the status of the configured nodes, the status of the different resources and the instances that are running in that resource.
We can see a possible output of this command:
============
Last updated: Wed Nov 6 02:46:33 2013
Stack: openais
Current DC: drbd1 – partition with quorum
Version: 1.0.8-042548a451fce8400660f6031f4da6f0223dd5dd
2 Nodes configured, 2 expected votes
2 Resources configured.
============Online: [ drbd1 drbd2 ]
Resource Group: srv
fs_mysql (ocf::heartbeat:Filesystem): Started drbd1
ip_mysql (ocf::heartbeat:IPaddr2): Started drbd1
mysqld (lsb:mysql): Started drbd1
apache2 (lsb:apache2): Started drbd1
pandora_server (lsb:apache2): Started drbd1
Master/Slave Set: ms_drbd_mysql
Masters: [ drbd1 ]
Slaves: [ drbd2 ]
As we can see, we have in the “srv” resource, the mysql, apache2, pandora_server, an IP address (Heartbeat) and the filesystem shared.
Next we show the configuration to follow for each one of the cases:
module_begin
module_name Mysql_drbd_status
module_type generic_data_string
module_exec crm status | grep <hostname> | grep mysqld | gawk ‘{print $3}’
module_str_critical Started
module_critical_inverse 1
module_endmodule_begin
module_name Apache_drbd_status
module_type generic_data_string
module_exec crm status | grep <hostname> | grep apache | gawk ‘{print $3}’
module_str_critical Started
module_critical_inverse 1
module_endmodule_begin
module_name Pandora_server_drbd_status
module_type generic_data_string
module_exec crm status | grep <hostname> | grep pandora_server | gawk ‘{print $3}’
module_str_critical Started
module_critical_inverse 1
module_endmodule_begin
module_name fs_mysql_status
module_type generic_data_string
module_exec crm status | grep <hostname> | grep fs_mysql | gawk ‘{print $3}’
module_str_critical Started
module_critical_inverse 1
module_end
* The hostname is that we can get through the command hostname in each one of the drbd systems and that which in its turn will be the name with which is called to each one of the systems in the file /etc/drbd.conf.
Another key point to monitor in a DRBD system is the Heartbeat. As we have seen previously, through the command crm_mon -1 we can monitor if this have been started. We can also do this through a tcp check of web check pointing directly to the IP configured in the heartbeat.
If it is about the Pandora FMS console, it is useful to monitor it if the virtual IP does not allow to have access, but instead, through the IP of the node that is started if it works, it will notify to us that something is taking place with the virtual IP.
We can know which processes of the heartbeat are running through the following module and if there is no one running, do that it reports the module in critical status:
module_begin
module_name Heartbeat Processes
module_type generic_data
module_exec ps aux | grep heartbeat | grep -v grep | wc -l
module_max_critical 0,5
module_min_critical -1
module_end
module_begin
module_name IP_mysql_status
module_type generic_data_string
module_exec crm status | grep <hostname> | grep fs_mysql | gawk ‘{print $3}’
module_str_critical Started
module_critical_inverse 1
module_end
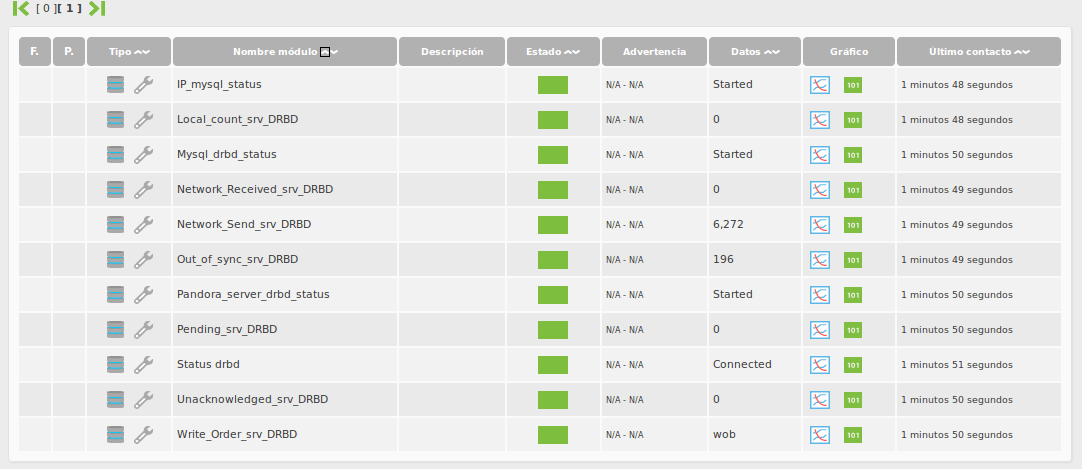
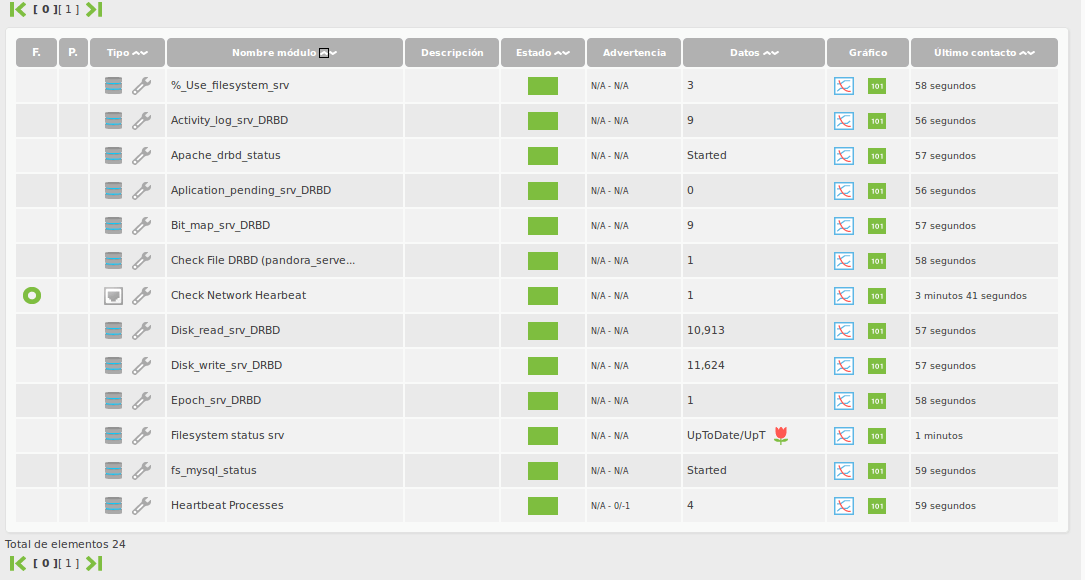
4.- SUMMARY OF THE MONITORING MODULES GOT IN PANDORA FMS.
All modules that we have taken from the different administration commands that the drbd have, are local modules and they should be configured in the agenta configuration file ( /etc/pandora/pandora_agent.conf ) as we have shown previously.
- % Use filesystem <resource>. Percentage of use of the filesystem that is associated to the resource.
- Status drbd <resource>.– Status of the resource in the drbd.
- Role drbd <resource>. Role of the resource in the drbd.
- Filesystem Status . Status of the filesystem associated to the resource.
- Network_Send_<resource>_DRBD.– KBytes sent to the partner through the network connection.
- Network_Received_<resource>_DRBD.- KBytes received from the partner.
- Disk_write_<resource>_DRBD.– KBytes written by the resource in the local system.
- Disk_read_<resource>_DRBD.– KBytes read by the resource in the local system.
- Activity_log_<resource>_DRBD.- Number of log changes.
- Bit_map_<resource>_DRBD.- Changes of the bit map area.
- Pending_<resource>_DRBD.– Number of requests sent to the partner, but that have not been answered yet.
- Local_count_<resource>_DRBD.– Number of open requests to the local subsystem I/O sent by DRBD.
- Unacknowledged_<resource>_DRBD.- Number of E/S block of the requests sent to DRBD, but unanswered but DRBD.
- Epoch_<resource>_DRBD.– Number of epoch objects
- Aplication_pending_<resource>_DRBD.-Número de bloque de E / S de las solicitudes remitidas a DRBD, pero aún no respondida por DRBD.
- Write_Order_<resource>_DRBD.– Writing method.
- Out_of_sync_<resource>_DRBD.– Storage quantity that is at present out of synchrony, in kbytes.
- Mysql_drbd_status.– Status of the Mysql instance.
- Apache_drbd_status.– Status of the Apache instance.
- Pandora_server_drbd_status .- Status of the Pandora_Server instance.
- fs_mysql_status .– Status of the Mysql instance filesystem.
- Heartbeat Processes.– Number of Hearbeat running processes.
- IP_mysql_status .- Status of the heartbeat.
DRBD Monitoring with Nagios
Nagios, to monitor the status of a DRB uses a plugin called check_drbd, that we can find in the Nagios web plugin library.
Trough the plugin check_drbd we get the drbd status with an output like this:
DRBD OK: Device 0 Primary Connected Consistent
These data are which we will see with the plugin output, but it will depend on the parameters that we pass to it to that it would be an output or another.
Plugin check_drbd parametrization
check_drbd
-d STRING [By default: 0. It will show through this string the resource to monitor (0,1,2,3,…) ]
-p STRING [By default: /proc/drbd. We should show the path where this file is located in case that it would be another one.]
The following parameters will configure the final status of the plugin output.
-e STRING [Should be the connected status.Example: Connected]
-r STRING [Should be the node status.Example: Primary]
-o STRING [Change the value to OK. Example: StandAlone]
-w STRING [Change the value to WARNING. Example: SyncingAll]
-c STRING [Change the value to CRITICAL. Example: Inconsistent,WFConnection]
This plugin could be used executing it directly in a Nagios agent or in a remote way from the nagios server. If we choose to execute it from the agent, then we should copy the plugin in the folder /usr/lib/nagios/plugins
To install it in the nrpe agent that uses Nagios to execute commands in a remote way we should add this line in its configuration file (/etc/nagios/nrpe.cfg)
command[check_drbd]=/usr/lib/nagios/plugins/check_drbd -d $ARG1$
The last step to create this plugin is to create the service in the Nagios Console. To do this we should do it from the CCM > Services, creating a new service that uses the command check_nrpe in order that in a remote way it will be executed in the drbd server. The command to configure will be similar to this:
$USER1$/check_nrpe -H $HOSTADDRESS$ -t 30 -c check_drbd -d 0

Other thing that could be monitored through Nagios is the Heartbeat number or processes. This could be done through a snmp check.
First we should add the command if it is not added in the command.cfg of the Nagios server:
define command{
command_name check_process_snmp
command_line /usr/bin/perl $USER1$/check_snmp_process.pl -H $HOSTADDRESS$ -C $ARG1$ -n $ARG2$ -w $ARG3$ -c $ARG4$
}
Being the arguments:
-C $ARG1$ : Snmp community
-n $ARG2$ : Process name
-w $ARG3$ : <min_proc>[,<max_proc>] Threshold warning status
-c $ARG3$ : <min_proc>[,<max_proc>] Threshold critical status
After adding the command with these arguments, the following step is to create the service in the Host, as we did previously with the Drbd Status service, but in this case, using the command check_process_snmp. Example of configuration:
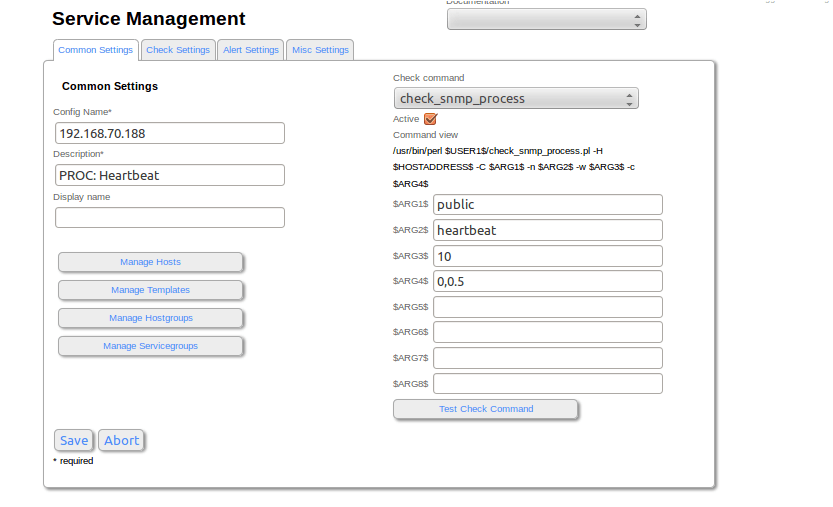
The result of the two services is which we show here:
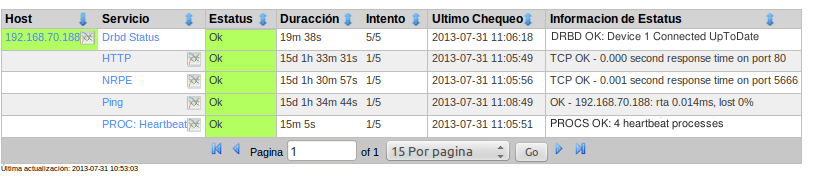
With the other drbd server, we should do the same process.