In the early 70’s the computer networks appeared for the first time. These networks were rapidly converted into an absolute necessity for all the IT people who were troubled with the need to transfer information. In the companies, the integration of computer networks at all levels improved the general work rate, as well as the team work between different departments. At the beginning, the connections were in Frame relay style where, to be sure of the performance of the network, was just enough to do checks from a monitoring tool. Nowadays, connections are established also between the standalone systems, and monitoring the connection’s performance becomes important from the perspective of those systems.
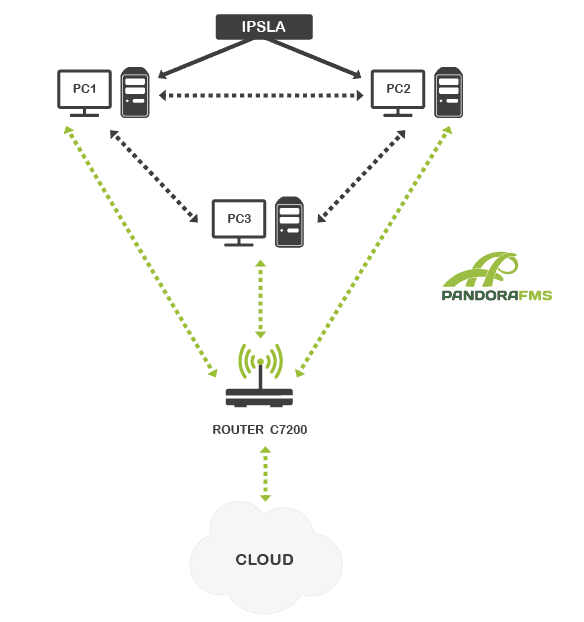
In the following graph we can see 3 servers connected in a network and to a Cisco type router with cloud access.

There are different ways in which we could measure the performance level of the connections from the perspective of the 3 servers. The first one is install The first is to install Pandora FMS agent to make all necessary measurements from the machines, which would be tedious to manage and would supose a big time and system resources consumption. The second is based on the usage of the proper tools of the network devices such as IP SLA.
What is IPSLA?
IP SLA is an embedded tool in some of the modern versions of the Cisco Device’s IOS and in some devices. This tool allows us to monitor the system level services for applications and specific network performance statistics in real time and from the perspective of the standalone computers.
Why IPSLA?
Due to the fact that the IPSLA agent reside inside the Cisco Devices they have good knowledge of the delays and allow complex measurements, normally not available, with a great level of precision, without any need to install additional software and without any impact on the performance of the servers or network.
IPSLA is both implemented by companies and providers with great interest into knowing the performance of the networks, taking into account the quality of the service (Qos), voice over IP, security, virtual private networks and Multiprotocol Label Switching.
Extracted information
The router is configured in order to inject packets with a specific time interval and in bidirectional style in order to calculate the values for the different monitors:
• Jitter – Metric that analyzes if there are any interruptions in the connection due to delays of some of the, (for example in voIP or video conferences).
• Echo / PathEcho –Analyzes the end to end communication interval. Can be useful to measure the traffic between different parts of the network and detect bottlenecks.
• Udpecho –Similar to the previous but for protocols based on UDP Similar which have the same packet loss characteristic.
• http –This operation can detect the status of the httpd server measuring the time response between the source machine and the load of the web page.
• Dns – Monitors the time acquired for a DNS petition to be responded from the DNS server.
• Voip – Monitors the delay in the Voip communications in calls and gatekeepers connections.
How to look at the extracted information
The values of the different monitors can be observed in the Cisco device’s shell, where IPSLA is configured, or the information can be extracted using the SNMP protocol and some specific oids.
Due to that functionality the new Pandora FMS plugin can extract the information in real time from the IPSLA monitors and display it on the Pandora FMS’s interactive graphs, include in the reports and establish alerts on specific thresholds or use the information to build dashboards.

The total number of the modules we can obtain depends on the amount of configured monitors on the cisco device. In this article only the most important ones are commented:
• ICPIF, MOS – Monitors used to measure the quality of the voice .
• Packet_Late_Arrival – Packets received late.
• Average_Jitter – The estimated average value of jitter observer in the last XX packets. Jitter in VoIP is stop in the voice or in the videoconference.
• PacketLoss – Packet loss both from A to B and B to A (it can be different and it is interesting to know).
• RTT – Round trip time that the packets take to travel from A to B and return.
For more information of this plugin you can visit the Pandora FMS module and plugin library.
 |
 |
| ¿Do you want to know more about Pandora FMS? |
¿Do you want to get the Cisco IPSLA plugin? |

Pandora FMS’s editorial team is made up of a group of writers and IT professionals with one thing in common: their passion for computer system monitoring. Pandora FMS’s editorial team is made up of a group of writers and IT professionals with one thing in common: their passion for computer system monitoring.