
The infrastructure must be “invisible” to the user, but visible to IT strategists to ensure the performance and service levels required by the business, where observability (as part of SRE or site reliability engineering) is essential to understand the internal state of a system based on its external results. For effective observability, there are four key pillars: metrics, events, logs, and traces, which are summarized in the acronym MELT
Next, define each of these pillars.
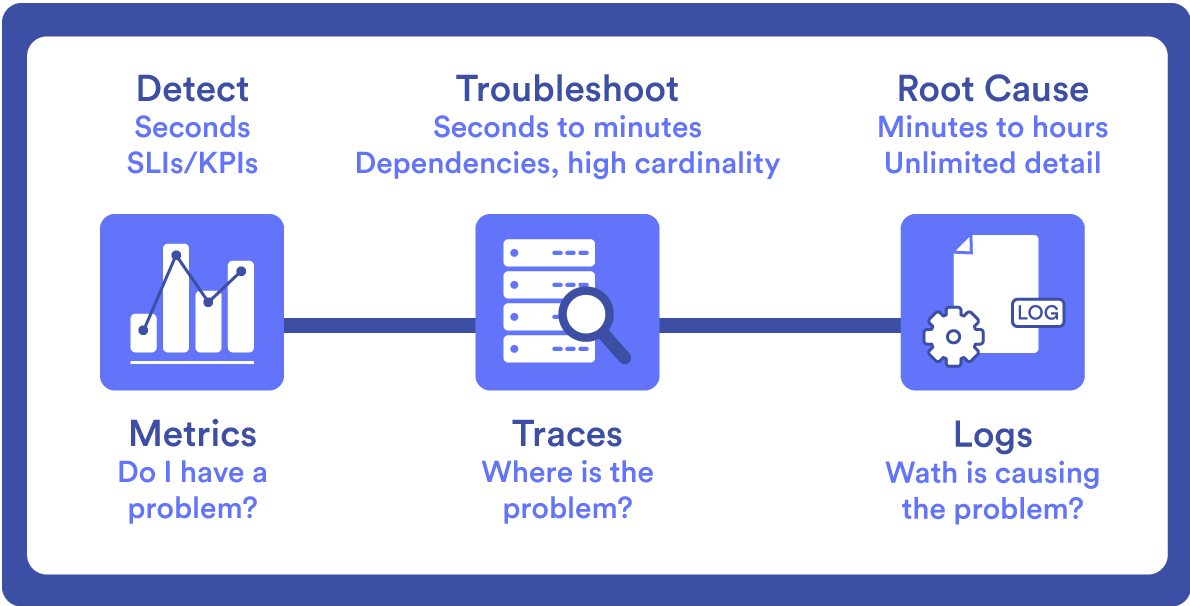
Metrics
What are Metrics?
They are numerical measures, usually periodic, that provide information about the state of a system and performance.
Examples of useful metrics
Response times, error rates, CPU usage, memory consumption, and network performance.
Advantages of using metrics
Metrics allow IT and security teams to track key performance indicators (KPIs) to detect trends or anomalies in system performance.
Events
What are Events?
They are discrete events or facts within a system, which can range from the creation of a module to the login of a user in the console. The event describes the problem, source (agent), and creation.
Event examples in systems
User actions (user login attempts), HTTP responses, changes in system status, or other notable incidents.
How events provide context
Events are often captured as structured data, including attributes such as timestamp, event type, and associated metadata, providing greater elements and information to the IT team to understand system performance and detect patterns or anomalies.
Logs
What are logs?
They are detailed records of events and actions that take place in a system. Also these collected data provide a chronological view of system activity, offering more elements for troubleshooting and debugging, understanding user behavior, and tracking system changes. Logs can contain information such as error messages, stack traces, user interactions, notifications about system changes.
Common log formats
Usually, logs use plain format files, either in ASCII type character encodings or stored in text form. The best known formats are Microsoft IIS3.0, NCSA, O’Reilly or W3SVC. In addition, there are special formats such as ELF (Extended Log Format) and CLF (Common Log Format).
Importance of centralizing logs
Log centralization ensures a complete and more contextualized system view at any time. This allows you to proactively spot problems and potential problems, as well as take action before they become bigger problems. Also this centralization allows to have the essential elements for audits and regulatory compliance, since compliance with policies and regulations on safety can be demonstrated.
Traces
What are Traces?
Traces provide a detailed view of the request flow through a distributed system. This is because they capture the path of a request as it goes through multiple services or components, including the time at each step. That way, traces help to understand dependencies and potential performance bottlenecks, especially in a complex system. Also traces allow to analyze how system architecture can be optimized to improve overall performance and, consequently, the end user experience.
Examples of traces in distributed systems
- The interval or span is a timed, named operation that represents a portion of the workflow. For example, intervals may include data queries, browser interactions, calls to other services, etc.
- Transactions may consist of multiple ranges and represent a complete end-to-end request that travels across multiple services in a distributed system.
- The unique identifiers for each, in order to track the path of the request through different services. This helps visualize and analyze the path and duration of the request.
- Spreading trace context involves passing trace context between services.
- Trace display to show the request flow through the system, which helps identify failures or performance bottlenecks.
Also, traces provide detailed data for developers to perform root cause analysis and with that information address issues related to latency, errors, and dependencies.
Challenges in trace instrumentation
Trace instrumentation can be difficult basically because of two factors:
- Each component of a request must be modified to transmit trace data.
- Many applications rely on libraries or frameworks that use open source, so they may require additional instrumentation.
Implementing MELT in Distributed Systems
Adopting observability through MELT involves Telemetry; that is, automatic data collection and transmission from remote sources to a centralized location for monitoring and analysis. From the data collected, the principles of telemetry (analyze, visualize and alert) must be applied to build resilient and reliable systems.
Telemetry Data Collection
Data is the basis of MELT, in which there are three fundamental principles of telemetry:
- Analyzing the collected data allows obtaining important information, relying on statistical techniques, machine learning algorithms and data mining methods to identify patterns, anomalies and correlations. By analyzing metrics, events, logs, and traces, IT teams can uncover performance issues, detect security threats, and understand system performance.
- Viewing data makes it accessible and understandable to stakeholders. Effective visualization techniques are the dashboards, charts, and graphs that represent the data clearly and concisely. In a single view, you and your team can monitor system health, identify trends, and communicate findings effectively.
- Alerting is a critical aspect of observability. When alerts are set up based on predefined thresholds or anomaly detection algorithms, IT teams can proactively identify and respond to issues. Alerts can be triggered based on metrics that exceed certain limits, events that indicate system failures, or specific patterns in logs or traces.
Aggregate Data Management
Implementing MELT involves handling a large amount of data from different sources such as application logs, system logs, network traffic, services and third-party infrastructure. All of this data should be found in a single place and aggregated in the most simplified form to observe system performance, detect irregularities and their source, as well as recognize potential problems. Hence, aggregate data management based on a defined organization, storage capacity, and adequate analysis is required to obtain valuable insights.
Aggregating data is particularly useful for logs, which make up the bulk of the telemetry data collected. Logs can also be aggregated with other data sources to provide supplemental insights into application performance and user behavior.
Importance of MELT in observability
MELT offers a comprehensive approach to observability, with insights into system health, performance, and behavior, from which IT teams can efficiently detect, diagnose, and solve issues.
System Reliability and Performance Improvements
Embracing observability supports the goals of SRE:
- Reduce the work associated with incident management, particularly around cause analysis, by improving uptime and Mean Time To Repair (MTTR).
- Provide a platform to monitor and adapt according to goals in service levels or service level contracts and their indicators (see What are SLAs, SLOs, and SLIs?). It also provides the elements for a possible solution when goals are not met.
- Ease the burden on the IT team when dealing with large amounts of data, reducing exhaustion or overalerting. This also leads to boosting productivity, innovation and value delivery.
- Support cross-functional and autonomous computers. Better collaboration with DevOps teams is achieved.
Creating an observability culture
Metrics are the starting point for observability, so a culture of observability must be created where proper collection and analysis are the basis for informed and careful decision-making, in addition to providing the elements to anticipate events and even plan the capacity of the infrastructure that supports the digitization of the business and the best experience of end users.
Tools and techniques for implementing MELT
- Application Performance Monitoring (APM): APM is used to monitor, detect, and diagnose performance problems in distributed systems. It provides system-wide visibility by collecting data from all applications and charting data flows between components.
- Analysis AIOps: These are tools that use artificial intelligence and ML to optimize system performance and recognize potential problems.
- Automated Root Cause Analysis: AI automatically identifies the root cause of a problem, helping to quickly detect and address potential problems and optimize system performance.
Benefits of Implementing MELT
System reliability and performance requires observability, which must be based on the implementation of MELT, with data on metrics, events, logs, and traces. All of this information must be analyzed and actionable to proactively address issues, optimize performance, and achieve a satisfactory experience for users and end customers.
Pandora FMS: A Comprehensive Solution for MELT
Pandora FMS is the complete monitoring solution for full observability, as its platform allows data to be centralized to obtain an integrated and contextualized view, with information to analyze large volumes of data from multiple sources. In a single view, it is possible to see the status and trends in system performance, in addition to generating smart alerts efficiently. It also generates information that can be shared with customers or suppliers to meet the standards and goals of services and system performance. To implement MELT:
- Pandora FMS unifies https://pandorafms.com/en/it-topics/it-system-monitoring/ regardless of the operating model and infrastructures (physical or SaaS, PaaS or IaaS).
- With Pandora FMS, you may collect and store all kinds of logs (including Windows events) to be able to search and configure alerts. Logs are stored in non-SQL storage that allows you to keep data from multiple sources for quite some time, supporting compliance and audit efforts. Expanding on this topic, we invite you to read the Infrastructure Logs document, the key to solving new compliance, security and business related questions.
- Pandora FMS offers custom dashboard layouts to display real-time data and multi-year history data. Reports on availability calculations, SLA reports (monthly, weekly or daily), histograms, graphs, capacity planning reports, event reports, inventories and component configuration, among others, can be predefined.
- With Pandora FMS, you may monitor traffic in real time, getting a clear view of the volume of requests and transactions. This tool allows you to identify usage patterns, detect unexpected spikes, and plan capacity effectively.
- With the premise that it is much more effective to visually show the source of a failure than simply receiving hundreds of events per second. Pandora FMS offers the value of its service monitoring, which allows you to filter all information and show only what is critical for making appropriate decisions.

EN: Market analyst and writer with +30 years in the IT market for demand generation, ranking and relationships with end customers, as well as corporate communication and industry analysis.
ES: Analista de mercado y escritora con más de 30 años en el mercado TIC en áreas de generación de demanda, posicionamiento y relaciones con usuarios finales, así como comunicación corporativa y análisis de la industria.
FR: Analyste du marché et écrivaine avec plus de 30 ans d’expérience dans le domaine informatique, particulièrement la demande, positionnement et relations avec les utilisateurs finaux, la communication corporative et l’anayse de l’indutrie.